Wheaton Precious Metals: gold and silver rallied, yet EBITDA fell 11% short of what year-ago prices implied
Contents

On 11 November Wheaton Precious Metals released its third-quarter 2026 results. The average gold price in the period was 4268 dollars per ounce against 3459 a year earlier (+23.4%), silver – 62.8 against 39.9 dollars (+57.6%). At those prices and year-ago volumes revenue would have been 669 million dollars and EBITDA 574.5 million on our calculation; the company actually reported revenue of 771.7 million and EBITDA of 639.6 million, beating the price-implied benchmark, yet net profit rose only 11.7% while EBITDA rose 67.5%. Our conclusion: rather unattractive – on the portal's model the share sits 57% below fair value, even though EV/EBITDA of 21.8 is 1.4 times below its own three-year average of 30.6. Our view: the share is rather unattractive at the current price; upside on the portal model -57%.
Our view: is there upside
Our view in numbers
| Metric | Our read |
|---|---|
| Verdict | Rather unattractive |
| Upside on the portal model | -57% |
| How the model works | spot model: EBITDA re-priced to current commodity prices at the target EV/EBITDA, against market cap |
| EV/EBITDA now and 3-year average | 21.8 vs 30.6 – a 29% discount to its history |
| Dividend yield, 12m | 0.4% |
| Net debt / EBITDA | 0.52 – low leverage |
| Strongest case for | The company earns more than prices alone imply: at year-ago prices EBITDA would have been 574.5 million but 639.6 million was reported, with an 82.9% margin and leverage of 0.52 times EBITDA. |
| Strongest case against | The portal model at current prices puts fair value 57% below the market, and at spot EBITDA falls to 2338.2 million against 2943.7 million over twelve months. |
| What would change the view | A return of gold above 4268 dollars and silver above 62.8 dollars per ounce would move the verdict one step up, towards neutral. |
Key takeaways
— Gold and silver averaged 4268 and 62.8 dollars in the quarter – 23.4% and 57.6% above a year earlier
— At year-ago prices the company would have earned EBITDA of 574.5 million but reported 639.6 million – 11.3% more on our calculation
— Revenue grew 62.0% year on year but decelerated from 84.7% in the previous quarter
— EBITDA margin rose to 82.9%, while net margin fell from 77.1% to 53.2% – profit was held back by items below operating income
— Spot prices are now below the quarterly averages: gold at 4041 dollars, silver at 52.2 – EBITDA at current prices is 2338.2 million against 2943.7 million over twelve months
— Leverage is moderate: net debt of 1452.3 million, or 0.52 times EBITDA over twelve months
— Trailing dividend yield is just 0.43% – the payout compensates neither the risk nor the valuation
Key figures, USD bn
| Metric | Q3 2025 | Q3 2026 | Change |
|---|---|---|---|
| Revenue | 0.48 | 0.77 | +62.0% |
| EBITDA | 0.38 | 0.64 | +67.5% |
| Operating profit | 0.32 | 0.51 | +62.0% |
| Net profit | 0.37 | 0.41 | +11.7% |
| Operating cash flow | 0.38 | 0.64 | +68.4% |
| Capex | 0.25 | 0.09 | -65.3% |
| EBITDA margin | 80.2% | 82.9% | +2.7 pp |
| Net margin | 77.1% | 53.2% | -23.9 pp |
Gold and silver averaged 4268 and 62.8 dollars in the quarter – 23.4% and 57.6% above a year earlier
The average gold price in the third quarter of 2026 was 4268 dollars per ounce against 3459 dollars a year earlier, up 23.4%. Silver rose more sharply – from 39.9 to 62.8 dollars, up 57.6%. In the portal's model gold and silver each account for half of revenue, so such a price shift should have lifted both revenue and EBITDA substantially.
Against the previous quarter the metals fell: gold from 4514 to 4268 dollars (-5.5%), silver from 73.1 to 62.8 dollars (-14.1%). As of 11 November 2026 spot gold is 4041 dollars and silver 52.2, which is 5.3% and 16.9% below the reported-quarter averages. The quarterly results were therefore earned on prices the market no longer offers.
Commodity prices: period average and now
| Benchmark | Year ago | Q3 2026 | YoY | Spot 2026-11-11 |
|---|---|---|---|---|
| Gold, USD | 3 459 | 4 268 | +23,4% | 4 041 |
| Silver, USD | 39,9 | 62,8 | +57,6% | 52,2 |
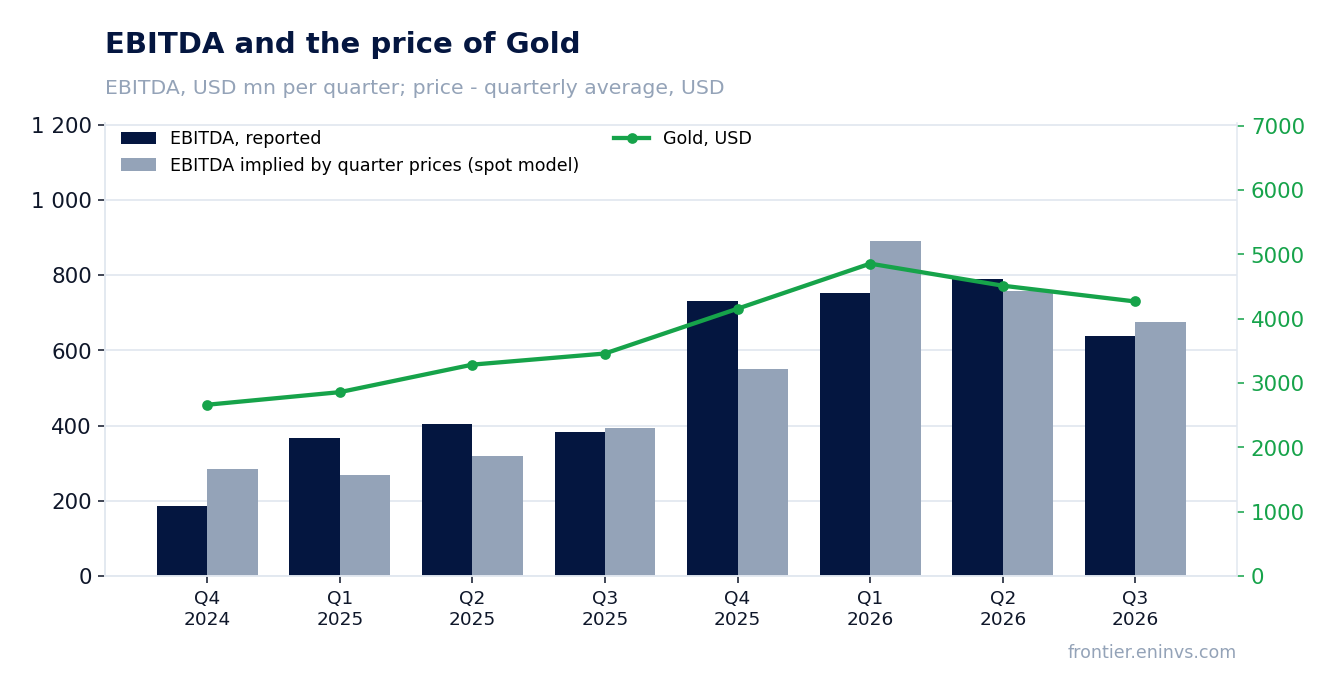
At year-ago prices the company would have earned EBITDA of 574.5 million but reported 639.6 million – 11.3% more on our calculation
Holding third-quarter 2025 volumes and non-commodity costs and substituting only the reported-period prices gives revenue of 669 million dollars and EBITDA of 574.5 million. Actual revenue of 771.7 million is 102.7 million, or 15.4%, higher; actual EBITDA of 639.6 million is 65.0 million, or 11.3%, higher. The price effect alone accounted for 192.8 million of revenue, so the company beat even that.
Against the previous quarter the picture reverses: at second-quarter 2026 volumes and costs, reported-period prices would have produced revenue of 838.2 million and EBITDA of 698.8 million. Actual 771.7 million and 639.6 million are 7.9% and 8.5% below. The portal's spot model, built from the average of the previous four quarters, expected EBITDA of 674.2 million and revenue of 798.7 million – actuals are 5.1% and 3.4% below.
The gap to the year-ago benchmark is explained by volumes and the realised price against the exchange benchmark; the facts do not allow it to be broken down further. What matters is that the company earned more than prices alone implied, but markedly less than the previous quarter's prices implied – quarterly dynamics moved down with the metals.
What the prices implied and what the company earned
| Base (Q3 2025) | Implied at period prices | Reported | Reported vs implied | |
|---|---|---|---|---|
| Revenue, USD mn | 476,3 | 669,0 | 771,7 | +15,4% |
| EBITDA, USD mn | 381,8 | 574,5 | 639,6 | +11,3% |
| EBITDA, portal spot model, USD mn | — | 674,2 | 639,6 | -5,1% |
Revenue and EBITDA by quarter
| Period | Measure | bn USD |
|---|---|---|
| Q4 2024 | Revenue | 0.381904 |
| Q1 2025 | Revenue | 0.47 |
| Q2 2025 | Revenue | 0.503218 |
| Q3 2025 | Revenue | 0.476257 |
| Q4 2025 | Revenue | 0.8647140000000001 |
| Q1 2026 | Revenue | 0.9014690000000001 |
| Q2 2026 | Revenue | 0.929201 |
| Q3 2026 | Revenue | 0.771734 |
| Q4 2024 | EBITDA | 0.18553899999999995 |
| Q1 2025 | EBITDA | 0.367679 |
| Q2 2025 | EBITDA | 0.405017 |
| Q3 2025 | EBITDA | 0.381779 |
| Q4 2025 | EBITDA | 0.7323310000000001 |
| Q1 2026 | EBITDA | 0.752076 |
| Q2 2026 | EBITDA | 0.789866 |
| Q3 2026 | EBITDA | 0.639209 |
EBITDA margin
| Period | Measure | % |
|---|---|---|
| Q4 2024 | EBITDA margin | 48.6 |
| Q1 2025 | EBITDA margin | 78.2 |
| Q2 2025 | EBITDA margin | 80.5 |
| Q3 2025 | EBITDA margin | 80.2 |
| Q4 2025 | EBITDA margin | 84.7 |
| Q1 2026 | EBITDA margin | 83.4 |
| Q2 2026 | EBITDA margin | 85.0 |
| Q3 2026 | EBITDA margin | 82.8 |
Revenue grew 62.0% year on year but decelerated from 84.7% in the previous quarter
Third-quarter 2026 revenue was 771.7 million dollars, 62.0% more than a year earlier. That is strong growth, but it is slower than the 84.7% of the second quarter: the deceleration stems mainly from metals getting cheaper quarter on quarter and from a higher year-ago base.
Over the last twelve months revenue was 3500.0 million dollars. Quarterly revenue of 771.7 million is about 22% of the annual figure, below the second quarter's share (929.2 million). For a holder the annual rate matters less than the fact that consecutive quarters are declining: 929.2 million in the second, 771.7 million in the third.
EBITDA margin rose to 82.9%, while net margin fell from 77.1% to 53.2% – profit was held back by items below operating income
EBITDA margin in the reported quarter was 82.9% against 80.2% a year earlier. Operating profit of 511.0 million plus depreciation of 128.2 million gives EBITDA of 639.6 million – on revenue of 771.7 million that is 82.9%. A rising margin while prices fell quarter on quarter means unit costs did not rise proportionally.
Net profit, however, was 410.2 million, and its annual growth was only 11.7% against 67.5% for EBITDA. Net margin fell from 77.1% to 53.2%. The cause lies in items below operating income that are not part of EBITDA: they explain the gap between EBITDA growth and net profit growth. The facts do not break these items down, so no specific one can be named.
For valuation this matters: a strong EBITDA margin did not translate into commensurate earnings-per-share growth, and earnings underpin the trailing P/E of 29.7.
Spot prices are now below the quarterly averages: gold at 4041 dollars, silver at 52.2 – EBITDA at current prices is 2338.2 million against 2943.7 million over twelve months
On the portal's spot model, annual EBITDA at today's prices would be 2338.2 million against 2943.7 million over the last twelve months – 20.6% less. This is the key valuation figure: trailing earnings were earned at the average prices of past quarters, while the market pays for future ones.
At current prices EV/EBITDA is 27.2 against 21.8 on the historical base, and net debt to EBITDA is 0.62 against 0.52. On the prices the market offers now the share is more expensive than the reported multiple suggests. For a commodity producer this is the right starting point.
Valuation vs its own history
now vs the 3-year average
| Period | Measure | × |
|---|---|---|
| EV/EBITDA | Now | 21.849968029394958 |
| EV/EBITDA | 3-year average | 30.575912264170967 |
Leverage is moderate: net debt of 1452.3 million, or 0.52 times EBITDA over twelve months
As of 30 September 2026 net debt was 1452.3 million dollars, equal to 0.52 times EBITDA over the last twelve months. That is low leverage for a commodity producer: even with EBITDA falling to 2338.2 million on the spot model the ratio stays comfortable at 0.62.
Operating cash flow in the quarter was 644.9 million, capital expenditure 86.9 million. Free cash flow is therefore about 558 million, comfortably covering both interest and dividends. Capex of 86.9 million is small relative to cash flow, which is normal for a royalty model: the company pays for a share of others' production rather than building mines.
Share price, three years
close, last point 2026-11-10
| Period | Measure | USD per share |
|---|---|---|
| 2025-11-10 | Closing price | 102.30999755859375 |
| 2025-11-11 | Closing price | 104.08999633789062 |
| 2025-11-12 | Closing price | 107.7699966430664 |
| 2025-11-13 | Closing price | 105.70999908447266 |
| 2025-11-14 | Closing price | 104.16999816894531 |
| 2025-11-17 | Closing price | 102.27999877929688 |
| 2025-11-18 | Closing price | 103.05999755859375 |
| 2025-11-19 | Closing price | 104.06999969482422 |
| 2025-11-20 | Closing price | 99.62000274658203 |
| 2025-11-21 | Closing price | 99.2699966430664 |
| 2025-11-24 | Closing price | 102.69000244140625 |
| 2025-11-25 | Closing price | 102.5 |
| 2025-11-26 | Closing price | 106.76000213623047 |
| 2025-11-28 | Closing price | 110.05000305175781 |
| 2025-12-01 | Closing price | 109.9800033569336 |
| 2025-12-02 | Closing price | 107.75 |
| 2025-12-03 | Closing price | 107.9800033569336 |
| 2025-12-04 | Closing price | 108.80000305175781 |
| 2025-12-05 | Closing price | 108.08999633789062 |
| 2025-12-08 | Closing price | 104.95999908447266 |
| 2025-12-09 | Closing price | 109.2699966430664 |
| 2025-12-10 | Closing price | 112.83000183105469 |
| 2025-12-11 | Closing price | 117.31999969482422 |
| 2025-12-12 | Closing price | 117.52999877929688 |
| 2025-12-15 | Closing price | 115.72000122070312 |
| 2025-12-16 | Closing price | 114.44000244140625 |
| 2025-12-17 | Closing price | 115.08000183105469 |
| 2025-12-18 | Closing price | 115.44999694824219 |
| 2025-12-19 | Closing price | 119.69999694824219 |
| 2025-12-22 | Closing price | 122.20999908447266 |
| 2025-12-23 | Closing price | 122.87999725341797 |
| 2025-12-24 | Closing price | 121.95999908447266 |
| 2025-12-26 | Closing price | 124.22000122070312 |
| 2025-12-29 | Closing price | 117.37999725341797 |
| 2025-12-30 | Closing price | 118.87999725341797 |
| 2025-12-31 | Closing price | 117.5199966430664 |
| 2026-01-02 | Closing price | 117.87000274658203 |
| 2026-01-05 | Closing price | 120.98999786376953 |
| 2026-01-06 | Closing price | 125.51000213623047 |
| 2026-01-07 | Closing price | 122.98999786376953 |
| 2026-01-08 | Closing price | 123.77999877929688 |
| 2026-01-09 | Closing price | 124.73999786376953 |
| 2026-01-12 | Closing price | 128.42999267578125 |
| 2026-01-13 | Closing price | 130.8000030517578 |
| 2026-01-14 | Closing price | 133.13999938964844 |
| 2026-01-15 | Closing price | 135.5 |
| 2026-01-16 | Closing price | 135.35000610351562 |
| 2026-01-20 | Closing price | 141.67999267578125 |
| 2026-01-21 | Closing price | 137.61000061035156 |
| 2026-01-22 | Closing price | 143.6999969482422 |
| 2026-01-23 | Closing price | 146.16000366210938 |
| 2026-01-26 | Closing price | 147.86000061035156 |
| 2026-01-27 | Closing price | 149.3800048828125 |
| 2026-01-28 | Closing price | 156.3000030517578 |
| 2026-01-29 | Closing price | 152.6999969482422 |
| 2026-01-30 | Closing price | 131.8699951171875 |
| 2026-02-02 | Closing price | 132.2100067138672 |
| 2026-02-03 | Closing price | 136.77999877929688 |
| 2026-02-04 | Closing price | 140.22999572753906 |
| 2026-02-05 | Closing price | 130.89999389648438 |
| 2026-02-06 | Closing price | 135.97999572753906 |
| 2026-02-09 | Closing price | 142.77999877929688 |
| 2026-02-10 | Closing price | 144.60000610351562 |
| 2026-02-11 | Closing price | 149.11000061035156 |
| 2026-02-12 | Closing price | 139.1699981689453 |
| 2026-02-13 | Closing price | 145.89999389648438 |
| 2026-02-17 | Closing price | 142.3300018310547 |
| 2026-02-18 | Closing price | 144.82000732421875 |
| 2026-02-19 | Closing price | 145.33999633789062 |
| 2026-02-20 | Closing price | 150.3800048828125 |
| 2026-02-23 | Closing price | 155.86000061035156 |
| 2026-02-24 | Closing price | 157.3800048828125 |
| 2026-02-25 | Closing price | 157.42999267578125 |
| 2026-02-26 | Closing price | 161.02000427246094 |
| 2026-02-27 | Closing price | 163.64999389648438 |
| 2026-03-02 | Closing price | 165.72000122070312 |
| 2026-03-03 | Closing price | 151.33999633789062 |
| 2026-03-04 | Closing price | 153.9499969482422 |
| 2026-03-05 | Closing price | 147.8300018310547 |
| 2026-03-06 | Closing price | 146.85000610351562 |
| 2026-03-09 | Closing price | 147.9499969482422 |
| 2026-03-10 | Closing price | 150.8300018310547 |
| 2026-03-11 | Closing price | 148.6699981689453 |
| 2026-03-12 | Closing price | 145.72999572753906 |
| 2026-03-13 | Closing price | 139.8699951171875 |
| 2026-03-16 | Closing price | 139.19000244140625 |
| 2026-03-17 | Closing price | 137.19000244140625 |
| 2026-03-18 | Closing price | 128.75 |
| 2026-03-19 | Closing price | 121.25 |
| 2026-03-20 | Closing price | 114.62000274658203 |
| 2026-03-23 | Closing price | 119.87999725341797 |
| 2026-03-24 | Closing price | 120.58999633789062 |
| 2026-03-25 | Closing price | 122.63999938964844 |
| 2026-03-26 | Closing price | 118.94999694824219 |
| 2026-03-27 | Closing price | 124.69999694824219 |
| 2026-03-30 | Closing price | 123.69999694824219 |
| 2026-03-31 | Closing price | 131.00999450683594 |
| 2026-04-01 | Closing price | 136.8000030517578 |
| 2026-04-02 | Closing price | 135.55999755859375 |
| 2026-04-06 | Closing price | 134.08999633789062 |
| 2026-04-07 | Closing price | 135.97000122070312 |
| 2026-04-08 | Closing price | 140.13999938964844 |
| 2026-04-09 | Closing price | 140.88999938964844 |
| 2026-04-10 | Closing price | 144.83999633789062 |
| 2026-04-13 | Closing price | 144.8300018310547 |
| 2026-04-14 | Closing price | 147.69000244140625 |
| 2026-04-15 | Closing price | 147.61000061035156 |
| 2026-04-16 | Closing price | 144.72000122070312 |
| 2026-04-17 | Closing price | 152.3800048828125 |
| 2026-04-20 | Closing price | 149.2100067138672 |
| 2026-04-21 | Closing price | 141.80999755859375 |
| 2026-04-22 | Closing price | 144.72000122070312 |
| 2026-04-23 | Closing price | 141.5500030517578 |
| 2026-04-24 | Closing price | 139.44000244140625 |
| 2026-04-27 | Closing price | 136.50999450683594 |
| 2026-04-28 | Closing price | 129.42999267578125 |
| 2026-04-29 | Closing price | 124.88999938964844 |
| 2026-04-30 | Closing price | 126.45999908447266 |
| 2026-05-01 | Closing price | 125.83999633789062 |
| 2026-05-04 | Closing price | 124.13999938964844 |
| 2026-05-05 | Closing price | 125.23999786376953 |
| 2026-05-06 | Closing price | 134.57000732421875 |
| 2026-05-07 | Closing price | 131.55999755859375 |
| 2026-05-08 | Closing price | 138.85000610351562 |
| 2026-05-11 | Closing price | 143.8000030517578 |
| 2026-05-12 | Closing price | 142.72999572753906 |
| 2026-05-13 | Closing price | 142.22000122070312 |
| 2026-05-14 | Closing price | 139.25999450683594 |
| 2026-05-15 | Closing price | 130.41000366210938 |
| 2026-05-18 | Closing price | 129.49000549316406 |
| 2026-05-19 | Closing price | 124.13999938964844 |
| 2026-05-20 | Closing price | 127.16000366210938 |
| 2026-05-21 | Closing price | 127.23999786376953 |
| 2026-05-22 | Closing price | 126.52999877929688 |
| 2026-05-26 | Closing price | 130.27000427246094 |
| 2026-05-27 | Closing price | 127.0999984741211 |
| 2026-05-28 | Closing price | 130.07000732421875 |
| 2026-05-29 | Closing price | 132.60000610351562 |
| 2026-06-01 | Closing price | 128.82000732421875 |
| 2026-06-02 | Closing price | 130.30999755859375 |
| 2026-06-03 | Closing price | 124.94999694824219 |
| 2026-06-04 | Closing price | 128.42999267578125 |
| 2026-06-05 | Closing price | 116.2300033569336 |
| 2026-06-08 | Closing price | 114.87000274658203 |
| 2026-06-09 | Closing price | 112.58000183105469 |
| 2026-06-10 | Closing price | 107.5199966430664 |
| 2026-06-11 | Closing price | 112.66000366210938 |
| 2026-06-12 | Closing price | 116.0999984741211 |
| 2026-06-15 | Closing price | 123.94000244140625 |
| 2026-06-16 | Closing price | 128.24000549316406 |
| 2026-06-17 | Closing price | 125.8499984741211 |
| 2026-06-18 | Closing price | 122.56999969482422 |
| 2026-06-22 | Closing price | 121.72000122070312 |
| 2026-06-23 | Closing price | 116.45999908447266 |
| 2026-06-24 | Closing price | 112.79000091552734 |
| 2026-06-25 | Closing price | 113.08000183105469 |
| 2026-06-26 | Closing price | 113.31999969482422 |
| 2026-06-29 | Closing price | 110.93000030517578 |
| 2026-06-30 | Closing price | 112.31999969482422 |
| 2026-07-01 | Closing price | 111.44000244140625 |
| 2026-07-02 | Closing price | 115.7300033569336 |
| 2026-07-06 | Closing price | 115.23999786376953 |
| 2026-07-07 | Closing price | 111.88999938964844 |
| 2026-07-08 | Closing price | 107.5999984741211 |
| 2026-07-09 | Closing price | 110.6500015258789 |
| 2026-07-10 | Closing price | 110.05000305175781 |
| 2026-07-13 | Closing price | 107.83000183105469 |
| 2026-07-14 | Closing price | 108.48999786376953 |
| 2026-07-15 | Closing price | 108.52999877929688 |
| 2026-07-16 | Closing price | 104.25 |
| 2026-07-17 | Closing price | 104.18000030517578 |
| 2026-07-20 | Closing price | 103.44999694824219 |
| 2026-07-21 | Closing price | 109.95999908447266 |
| 2026-07-22 | Closing price | 111.36000061035156 |
| 2026-07-23 | Closing price | 110.02999877929688 |
| 2026-07-24 | Closing price | 111.4800033569336 |
| 2026-07-27 | Closing price | 112.01000213623047 |
| 2026-07-28 | Closing price | 109.58000183105469 |
| 2026-07-29 | Closing price | 109.45999908447266 |
| 2026-07-30 | Closing price | 113.37999725341797 |
| 2026-07-31 | Closing price | 109.02999877929688 |
| 2026-08-03 | Closing price | 111.86000061035156 |
| 2026-08-04 | Closing price | 115.41000366210938 |
| 2026-08-05 | Closing price | 122.81999969482422 |
| 2026-08-06 | Closing price | 125.30000305175781 |
| 2026-08-07 | Closing price | 134.1999969482422 |
| 2026-08-10 | Closing price | 133.38999938964844 |
| 2026-08-11 | Closing price | 134.41000366210938 |
| 2026-08-12 | Closing price | 134.8800048828125 |
| 2026-08-13 | Closing price | 131.86000061035156 |
| 2026-08-14 | Closing price | 134.2100067138672 |
| 2026-08-17 | Closing price | 136.61000061035156 |
| 2026-08-18 | Closing price | 132.6999969482422 |
| 2026-08-19 | Closing price | 147.42999267578125 |
| 2026-08-20 | Closing price | 150.25 |
| 2026-08-21 | Closing price | 157.77999877929688 |
| 2026-08-24 | Closing price | 160.19000244140625 |
| 2026-08-25 | Closing price | 163.72000122070312 |
| 2026-08-26 | Closing price | 156.02000427246094 |
| 2026-08-27 | Closing price | 157.99000549316406 |
| 2026-08-28 | Closing price | 153.3300018310547 |
| 2026-08-31 | Closing price | 150.8300018310547 |
| 2026-09-01 | Closing price | 144.92999267578125 |
| 2026-09-02 | Closing price | 150.91000366210938 |
| 2026-09-03 | Closing price | 156.6300048828125 |
| 2026-09-04 | Closing price | 154.97999572753906 |
| 2026-09-08 | Closing price | 155.11000061035156 |
| 2026-09-09 | Closing price | 156.75999450683594 |
| 2026-09-10 | Closing price | 150.97999572753906 |
| 2026-09-11 | Closing price | 154.1199951171875 |
| 2026-09-14 | Closing price | 149.6699981689453 |
| 2026-09-15 | Closing price | 150.02000427246094 |
| 2026-09-16 | Closing price | 146.72999572753906 |
| 2026-09-17 | Closing price | 152.1999969482422 |
| 2026-09-18 | Closing price | 151.00999450683594 |
| 2026-09-21 | Closing price | 147.66000366210938 |
| 2026-09-22 | Closing price | 153.80999755859375 |
| 2026-09-23 | Closing price | 145.4499969482422 |
| 2026-09-24 | Closing price | 143.8800048828125 |
| 2026-09-25 | Closing price | 142.9199981689453 |
| 2026-09-28 | Closing price | 135.6199951171875 |
| 2026-09-29 | Closing price | 135.38999938964844 |
| 2026-09-30 | Closing price | 133.72000122070312 |
| 2026-10-01 | Closing price | 133.4199981689453 |
| 2026-10-02 | Closing price | 136.27999877929688 |
| 2026-10-05 | Closing price | 136.27000427246094 |
| 2026-10-06 | Closing price | 137.64999389648438 |
| 2026-10-07 | Closing price | 133.69000244140625 |
| 2026-10-08 | Closing price | 134.9600067138672 |
| 2026-10-09 | Closing price | 138.64999389648438 |
| 2026-10-12 | Closing price | 138.11000061035156 |
| 2026-10-13 | Closing price | 136.02999877929688 |
| 2026-10-14 | Closing price | 129.5800018310547 |
| 2026-10-15 | Closing price | 133.16000366210938 |
| 2026-10-16 | Closing price | 134.17999267578125 |
| 2026-10-19 | Closing price | 131.99000549316406 |
| 2026-10-20 | Closing price | 131.22999572753906 |
| 2026-10-21 | Closing price | 132.1699981689453 |
| 2026-10-22 | Closing price | 123.52999877929688 |
| 2026-10-23 | Closing price | 120.88999938964844 |
| 2026-10-26 | Closing price | 122.37000274658203 |
| 2026-10-27 | Closing price | 125.91999816894531 |
| 2026-10-28 | Closing price | 126.56999969482422 |
| 2026-10-29 | Closing price | 123.26000213623047 |
| 2026-10-30 | Closing price | 116.58000183105469 |
| 2026-11-02 | Closing price | 119.1500015258789 |
| 2026-11-03 | Closing price | 117.41999816894531 |
| 2026-11-04 | Closing price | 131.5 |
| 2026-11-05 | Closing price | 132.4600067138672 |
| 2026-11-06 | Closing price | 136.30999755859375 |
| 2026-11-09 | Closing price | 143.94000244140625 |
| 2026-11-10 | Closing price | 137.00999450683594 |
Trailing dividend yield is just 0.43% – the payout compensates neither the risk nor the valuation
Trailing twelve-month dividend yield is 0.43%. For a company that returns part of its cash flow to shareholders this is very little: with quarterly operating cash flow of 644.9 million and capex of 86.9 million free cash exists, but only a small share goes into the payout.
Our estimate of the current-year dividend cannot be derived from this: the facts give neither a declared amount, nor a payout ratio, nor a dividend policy. One thing is clear – at a 0.43% yield the dividend is not an argument for the share, and a holder's decision should rest on valuation and metal prices, not on the payout.
Net profit by quarter
| Period | Measure | bn USD |
|---|---|---|
| Q4 2024 | Net profit | 0.08814699999999999 |
| Q1 2025 | Net profit | 0.2539849999999999 |
| Q2 2025 | Net profit | 0.29227 |
| Q3 2025 | Net profit | 0.367216 |
| Q4 2025 | Net profit | 0.558249 |
| Q1 2026 | Net profit | 0.582044 |
| Q2 2026 | Net profit | 0.5432359999999999 |
| Q3 2026 | Net profit | 0.410248 |
EV/EBITDA of 21.8 is 1.4 times below its own three-year average of 30.6 – a 29% discount, yet the portal model gives minus 57%
On the trailing EV/EBITDA multiple of 21.8 the share trades 29% below its own three-year average of 30.6. On this yardstick there is room: the market pays less for EBITDA than it did on average over three years. Trailing P/E is 29.7, return on equity 16.6%.
But the portal model, which re-prices EBITDA at current metal prices and the target multiple, puts fair value 57% below the market. The discrepancy is explainable: the historical multiple is built on earnings made at higher prices, while spot prices are now 5.3% below on gold and 16.9% on silver. For a commodity producer the current-price model, not the historical average, is decisive.
Valuation on the latest reported figures
| Metric | Value |
|---|---|
| Market cap | 62.2 bn USD |
| P/E (LTM) | 29.7 |
| EV/EBITDA (LTM) | 21.8 |
| P/B | 7.16 |
| Net debt / EBITDA (LTM) | 0.52 |
| Operating cash flow (LTM) | 2.81 bn |
| ROE | 16.6% |
| Dividend yield (12m) | 0.4% |
| EV/EBITDA, 3-year average | 30.6 |
Bottom line
The strong side of the report is the ability to earn more than prices alone imply: at year-ago prices EBITDA would have been 574.5 million, and the company reported 639.6 million. EBITDA margin rose to 82.9%, leverage is low at 0.52 times trailing EBITDA, and operating cash flow of 644.9 million comfortably covers capex of 86.9 million. The weak spot is profit: net margin fell from 77.1% to 53.2%, and net profit growth of 11.7% lags far behind EBITDA growth. For a holder the real question is not the reported quarter but the fact that spot prices are below the quarterly averages, at which EBITDA drops to 2338.2 million and EV/EBITDA rises to 27.2. Our conclusion: rather unattractive – on the portal's model the share sits 57% below fair value, and the 29% discount to its own three-year EV/EBITDA average does not offset that. Our view: the share is rather unattractive at the current price; upside on the portal model -57%.