ID_ASII profit fell 11.7% on flat revenue while net debt rose 13.7 trn IDR over the year
ID_ASII's nine-month 2026 report showed almost flat revenue and weaker profit: revenue reached 243,869 bn IDR (+0.1% year on year), net profit 21,602 bn IDR (–11.7%), and the net margin slipped to 8.9% from 10.0%. Net debt stood at 64,894 bn IDR on 30 September 2026 against 51,204 bn a year earlier, with net debt to LTM EBITDA at 1.32. At an EV/EBITDA of 5.0 versus its own three-year average of 4.4 and a portal-model upside of –11%, the share looks rather unattractive at the current price, though an 8.1% dividend yield keeps it from being outright unattractive.
Key takeaways
— Nine-month revenue added just 0.1%, to 243,869 bn IDR – growth has effectively stalled
— Net profit fell 11.7%, to 21,602 bn IDR, and the margin dropped to 8.9% from 10.0% a year earlier
— Net debt rose from 51,204 bn IDR on 30 September 2025 to 64,894 bn on 30 September 2026
— Nine-month operating cash flow of 28,608 bn IDR covers profit but not the rise in debt
— The 8.1% dividend yield is the main support for the valuation, but the payout rests on falling profit
— EV/EBITDA of 5.0 is 12% above its own three-year average of 4.4 – the share is more expensive than its history
— The portal model implies –11% upside to fair value, meaning the market has already priced in more than the model
Attractiveness
Key figures, IDR bn
| Metric | 9M 2025 | 9M 2026 | Change |
|---|---|---|---|
| Revenue | 243 608 | 243 869 | +0.1% |
| EBITDA | 41 659 | — | — |
| Operating profit | 28 390 | — | — |
| Net profit | 24 473 | 21 602 | -11.7% |
| Operating cash flow | 35 071 | 28 608 | -18.4% |
| EBITDA margin | 17.1% | — | — |
| Net margin | 10.0% | 8.9% | -1.1 pp |
Nine-month revenue added just 0.1%, to 243,869 bn IDR – growth has effectively stalled
For the nine months of 2026 revenue reached 243,869 bn IDR, just 0.1% above the same period a year earlier. That gain means the company has effectively plateaued: no segment made a visible contribution to growth, and the overall dynamic is set by a small positive revaluation of the base.
The standalone first quarter of 2026 shows revenue down 5.6% year on year, to 78,668 bn IDR. These are quarterly figures and do not describe the full nine-month period, but they confirm that within the year there were months of falling revenue, not only growth.
For valuation this matters: with revenue that is not growing, the entire burden of servicing the larger debt falls on profit and cash flow. The company cannot count on operating leverage – cost growth against flat revenue hits the margin directly.
Net profit fell 11.7%, to 21,602 bn IDR, and the margin dropped to 8.9% from 10.0% a year earlier
Nine-month 2026 net profit reached 21,602 bn IDR, 11.7% less than a year earlier. With revenue almost unchanged, the profit decline means costs grew faster than income, and the net margin fell to 8.9% from 10.0%.
A 1.1 percentage point margin compression on revenue of 243,869 bn IDR is roughly 2.7 trn IDR of foregone annual profit. The source of this pressure is not disclosed in the facts: all that is known is that profit fell faster than revenue, which points to costs or interest expense rather than sales volume.
For the shareholder this is the key signal: the company is losing efficiency at the operating level, and if the trend persists the dividend base will shrink. Profit over the last twelve months was 29,898 bn IDR, already below what a stable margin would imply.
Net debt rose from 51,204 bn IDR on 30 September 2025 to 64,894 bn on 30 September 2026
Net debt on 30 September 2026 was 64,894 bn IDR against 51,204 bn on 30 September 2025 – an increase of 13,690 bn IDR over the year. Over the quarter debt declined: from 72,940 bn on 30 June 2026 to 64,894 bn on 30 September, a fall of 8,046 bn IDR.
Net debt to LTM EBITDA stands at 1.32. That is a moderate level that does not by itself create debt risk, but it is calculated on LTM EBITDA of 49,192 bn IDR, and with falling profit the denominator will shrink.
Interest expense on debt of this size is a material line that explains part of the gap between revenue and profit. The company is adding debt at a time when revenue is flat, which limits its room for manoeuvre: refinancing will have to be done against weaker operating results.
Nine-month operating cash flow of 28,608 bn IDR covers profit but not the rise in debt
Nine-month 2026 operating cash flow was 28,608 bn IDR, above net profit of 21,602 bn IDR. That means the company is generating cash, and depreciation partly offsets non-cash charges.
However, the annual increase in net debt of 13,690 bn IDR is comparable to half of the nine-month operating flow. That is, a significant part of the cash earned operationally goes not to debt repayment but to investment or shareholder payouts.
Over the last twelve months operating cash flow reached 38,231 bn IDR. That is enough to service debt, but with falling profit and rising debt the margin of safety is narrowing: if operating flow declines, the company will have to either cut capex or borrow more.
The 8.1% dividend yield is the main support for the valuation, but the payout rests on falling profit
Trailing twelve-month dividend yield is 8.1%. That is a high yield which at the current price provides a substantial part of the shareholder's total return and explains why the share does not look expensive on a P/E of 6.2.
The payout rests on profit, and nine-month profit fell 11.7%. If the full-year result is at that level, the dividend base will shrink, and with an unchanged payout ratio the dividend per share will be lower. Our estimate is that at current profit the dividend could fall roughly in proportion to the profit decline if the payout policy is unchanged.
The 8.1% yield should be compared with the key rate, but it is not in the facts, so we limit ourselves to saying: the yield is high, but it compensates for risk rather than creating a cushion. If profit keeps falling, the market will reprice both the dividend and the share itself.
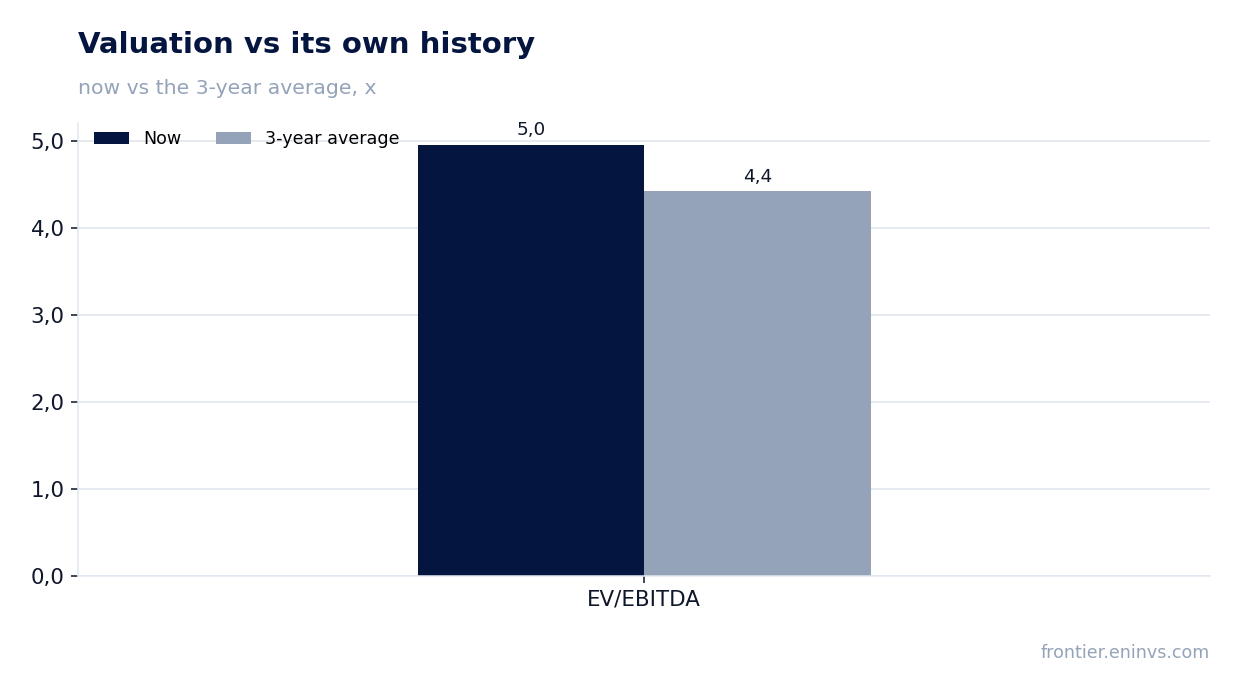
EV/EBITDA of 5.0 is 12% above its own three-year average of 4.4 – the share is more expensive than its history
The LTM EV/EBITDA multiple is 5.0 against its own three-year average of 4.4. The share trades 12% above its history on this multiple, meaning the market values it more expensively than it did on average over the past three years.
The LTM P/E is 6.2, lower than one might expect given the profit dynamic. The gap between P/E and EV/EBITDA is explained by debt: EV includes net debt of 64,894 bn IDR, and the larger the debt, the higher EV/EBITDA at the same P/E.
For the investor this means the current price already discounts part of a future recovery. If profit does not recover, the multiple will prove inflated relative to history, and the share will correct.
The portal model implies –11% upside to fair value, meaning the market has already priced in more than the model
On the portal model the fair value of the share is 11% below the current price. This is our own estimate based on EBITDA growth and a target multiple, and it is not a market consensus or a target price.
Negative upside means the market values the company above what the model implies. With falling profit and rising debt this creates correction risk: if the next report does not show a margin recovery, the market may reprice towards the model.
The model is sensitive to two parameters – EBITDA growth and the target multiple. If profit recovers, the upside could turn positive, but there is no evidence of recovery yet.
Valuation on the latest reported figures
| Metric | Value |
|---|---|
| Market cap | 186 135 bn IDR |
| P/E (LTM) | 6.2 |
| EV/EBITDA (LTM) | 5.0 |
| P/B | 0.81 |
| Net debt / EBITDA (LTM) | 1.32 |
| Operating cash flow (LTM) | 38 231 bn |
| ROE | 12.3% |
| Dividend yield (12m) | 8.1% |
| EV/EBITDA, 3-year average | 4.4 |
Bottom line
The report's strength remains cash flow: nine-month operating flow of 28,608 bn IDR covers profit, and the 8.1% dividend yield supports the price. The weak spot is profit: it fell 11.7%, the margin compressed to 8.9%, and revenue is not growing. Debt rose to 64,894 bn IDR, and although the 1.32 ratio to EBITDA remains moderate, it will deteriorate with falling profit. The key question for the holder is whether the dividend holds at the current level and when the margin recovers; for now the portal model implies –11% to fair value, and the share looks rather unattractive at the current price.
Open the company's financial profile ASII →
See also: market overview · valuation map · stock screeners