Cipla: revenue slipped 1.1% while EBITDA fell 45.3% – margin compressed from 37.7% to 20.9%
The report for the quarter ended 30 September 2026 showed revenue of INR 73,681.5 mn, EBITDA of INR 15,389.4 mn and net profit of INR 8,775.4 mn. Year on year revenue fell 1.1%, EBITDA 45.3% and net profit 35.1%, while the EBITDA margin compressed from 37.7% to 20.9%. The company still holds a net cash position of INR 13,917.4 mn, but the LTM EV/EBITDA of 27.8x is 58% above its own three-year average of 17.6 – the share looks expensive against its own history, and the verdict on it is neutral.
Key takeaways
— Revenue in the quarter ended 30 September 2026 fell 1.1% year on year to INR 73,681.5 mn
— EBITDA dropped 45.3% on an almost flat top line – the margin compressed from 37.7% to 20.9%
— Net profit declined 35.1% to INR 8,775.4 mn, a shallower fall than EBITDA
— The company holds a net cash position: net debt at 30 September 2026 was minus INR 13,917.4 mn
— The trailing twelve-month dividend yield is 0.95%, modest against the share price
— LTM EV/EBITDA of 27.8x is 58% above its own three-year average of 17.6 – the share is expensive against its history
— On the portal's model the fair value of the share is 75% below the current market price
Attractiveness
Key figures, INR bn
| Metric | Q3 2025 | Q3 2026 | Change |
|---|---|---|---|
| Revenue | 74.5 | 73.7 | -1.1% |
| EBITDA | 28.1 | 15.4 | -45.3% |
| Operating profit | 16.0 | 10.4 | -34.7% |
| Net profit | 13.5 | 8.78 | -35.1% |
| EBITDA margin | 37.7% | 20.9% | -16.8 pp |
| Net margin | 18.1% | 11.9% | -6.2 pp |
Revenue in the quarter ended 30 September 2026 fell 1.1% year on year to INR 73,681.5 mn
Revenue for the quarter ended 30 September 2026 was INR 73,681.5 mn against INR 74,474.2 mn a year earlier – a decline of 1.1%. This extends the deceleration: in the previous quarter ended 30 June 2026 growth was 3.5% year on year, and now it has turned into a fall.
The decline is small, but it breaks the growth streak seen in the first half. The facts do not disclose which revenue line produced the minus, so we limit ourselves to stating that the top line has stopped growing – the first quarter with negative dynamics in the last five, apart from the quarter ended 30 September 2025, when growth was zero.
For an investor, what matters is that the revenue decline is accompanied by a much sharper fall in profit. That means the problem is not only sales volume but also the cost structure or one-off factors that showed up in this particular quarter.
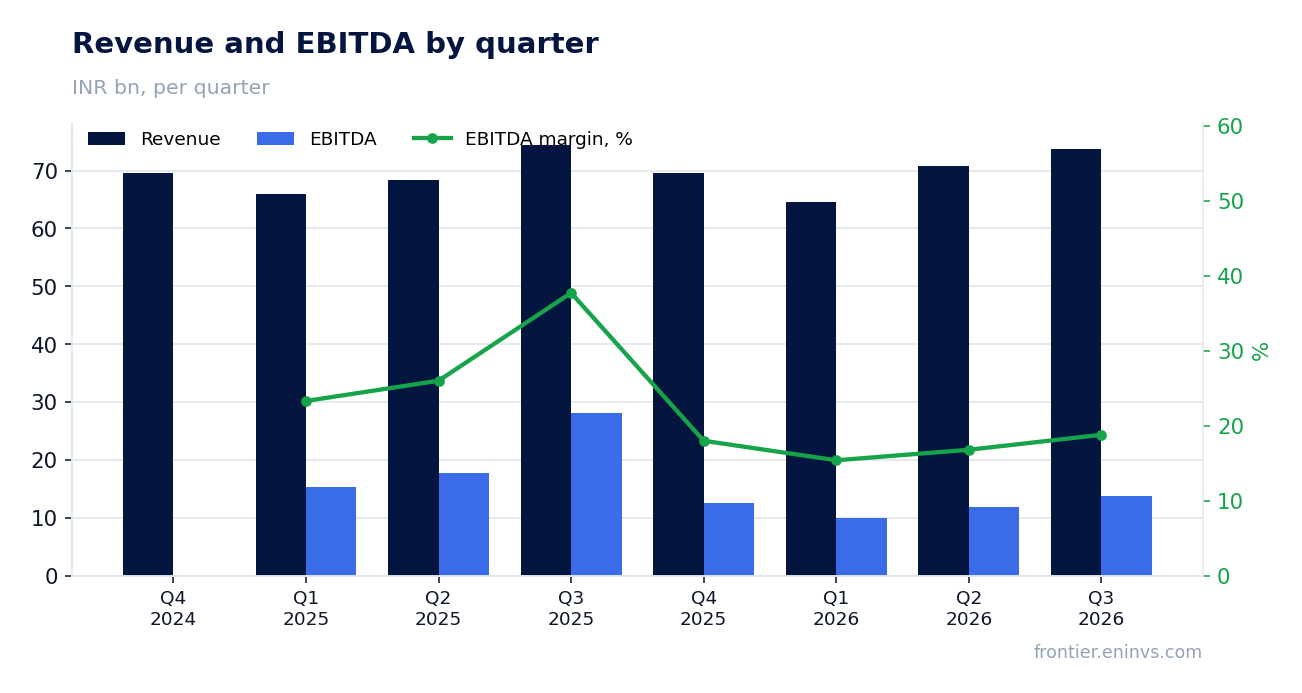
EBITDA dropped 45.3% on an almost flat top line – the margin compressed from 37.7% to 20.9%
EBITDA for the quarter ended 30 September 2026 was INR 15,389.4 mn against INR 28,110.4 mn a year earlier – a fall of 45.3%. With revenue down only 1.1%, this means the bulk of the decline came from costs, not sales volume.
The EBITDA margin compressed from 37.7% to 20.9% – almost halved. The facts offer no explanation for such a sharp compression: the company did not disclose which cost line rose. All we can say is that operating profit for the quarter was INR 10,429.2 mn, also below the prior-year level.
The 16.8 percentage point margin compression is the main negative of the report. If it proves one-off – say, write-offs or a seasonal cost spike – the next quarter could show a recovery. If it is a structural shift in costs, profit will stay under pressure.
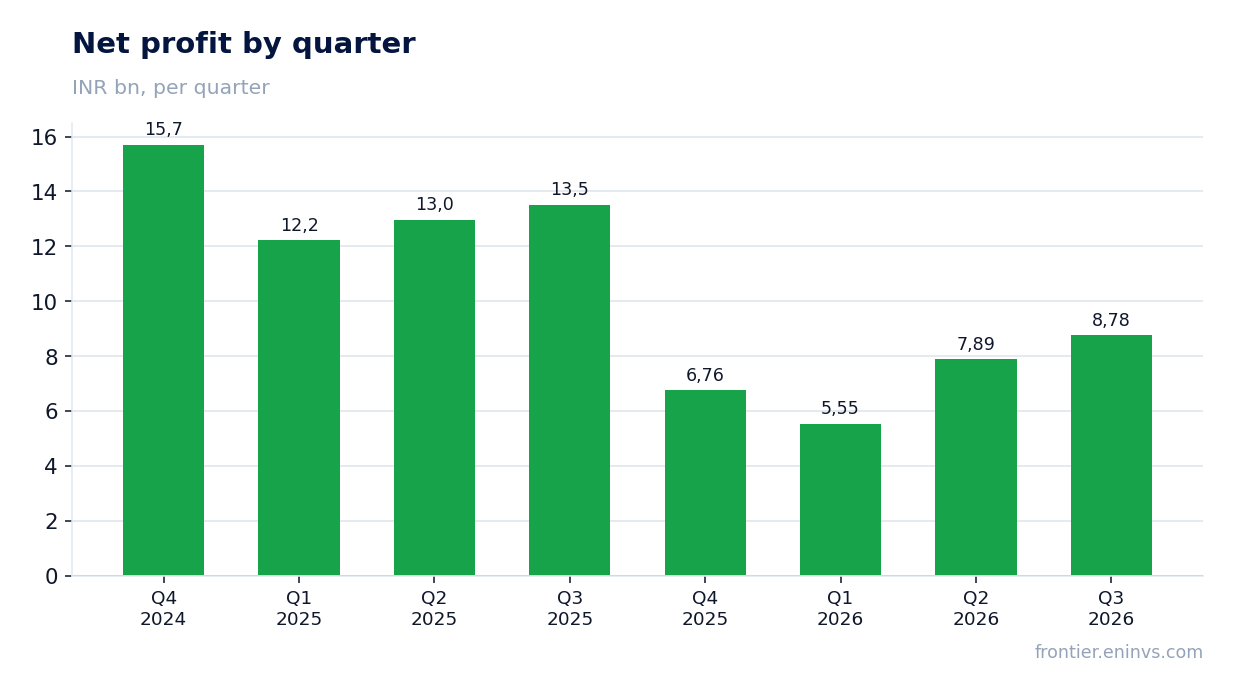
Net profit declined 35.1% to INR 8,775.4 mn, a shallower fall than EBITDA
Net profit for the quarter ended 30 September 2026 was INR 8,775.4 mn against INR 13,511.7 mn a year earlier – a decline of 35.1%. The fall in profit was shallower than the fall in EBITDA, which points to factors below the operating line that supported the result: possibly lower interest costs or higher other income.
The net margin declined from 18.1% to 11.9%. That is still a double-digit level, but noticeably below last year. With a net cash position the company carries no significant interest expense, so the support from below may have come from a tax or financial line the facts do not disclose.
For assessing the sustainability of profit, it matters that the fall in profit is smaller than the fall in EBITDA, but still substantial. If the EBITDA margin recovers, net profit could recover part of the losses faster than expected.
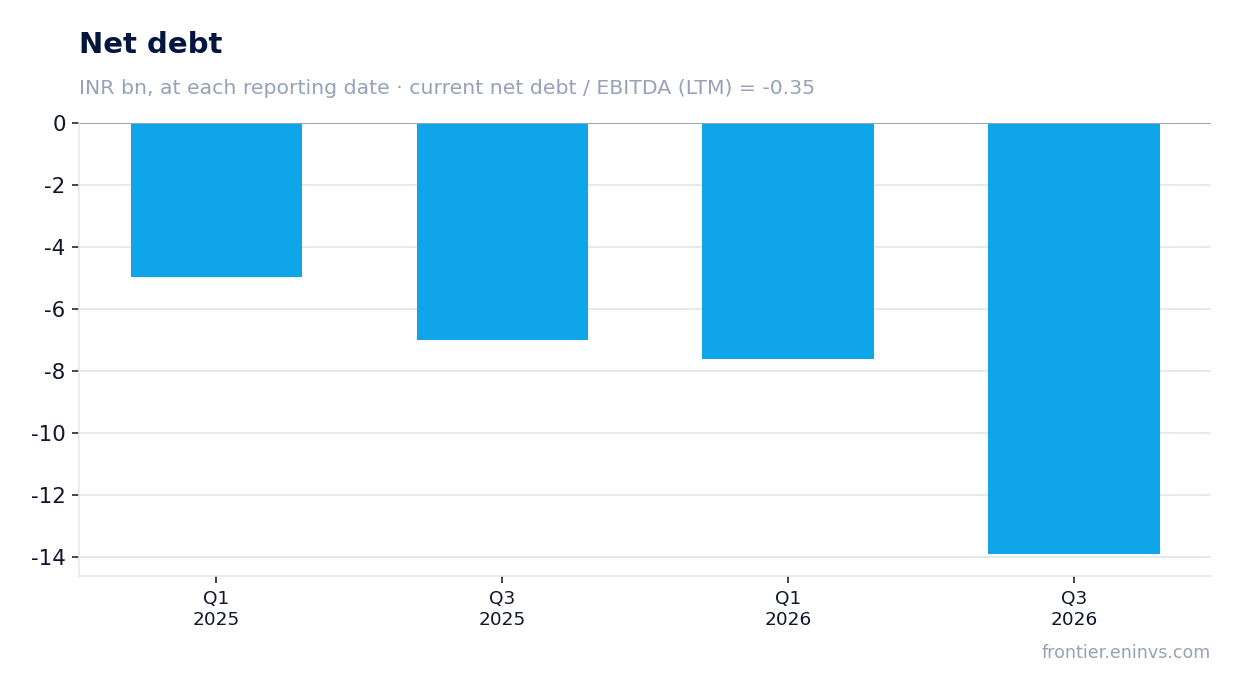
The company holds a net cash position: net debt at 30 September 2026 was minus INR 13,917.4 mn
Net debt at 30 September 2026 was minus INR 13,917.4 mn, meaning the company has a net cash position. Cash and equivalents exceed debt obligations, and financial risk is minimal.
Over the six months from 31 March 2026 net debt moved from minus INR 7.6 bn to minus INR 13.9 bn, so the cash cushion grew by INR 6.3 bn. Over the twelve months from 30 September 2025 the change was minus INR 6.9 bn – from minus INR 7.0 bn to minus INR 13.9 bn. This reflects cash inflow that the company used to strengthen the balance sheet.
The net debt to LTM EBITDA ratio is minus 0.35 – a negative value confirming the net cash position. Such a balance sheet gives the company a margin of safety, but by itself does not offset the fall in operating profit.
The trailing twelve-month dividend yield is 0.95%, modest against the share price
The trailing twelve-month dividend yield is 0.95%. With a market capitalisation of INR 1,103,228.6 mn, this means the dividends paid were small relative to the company's value. The company is not a high-yield dividend story.
Our estimate of the current-year dividend is based on the actual yield and profit. With LTM net profit of INR 28,970.3 mn and a payout ratio that can be inferred from actual payments, the dividend remains modest. The main risk to payouts is a further fall in profit if the margin does not recover.
A yield of 0.95% is well below the key rate, making the share unattractive to income-oriented investors. Combined with the high valuation multiple, this reinforces a cautious view of the stock.
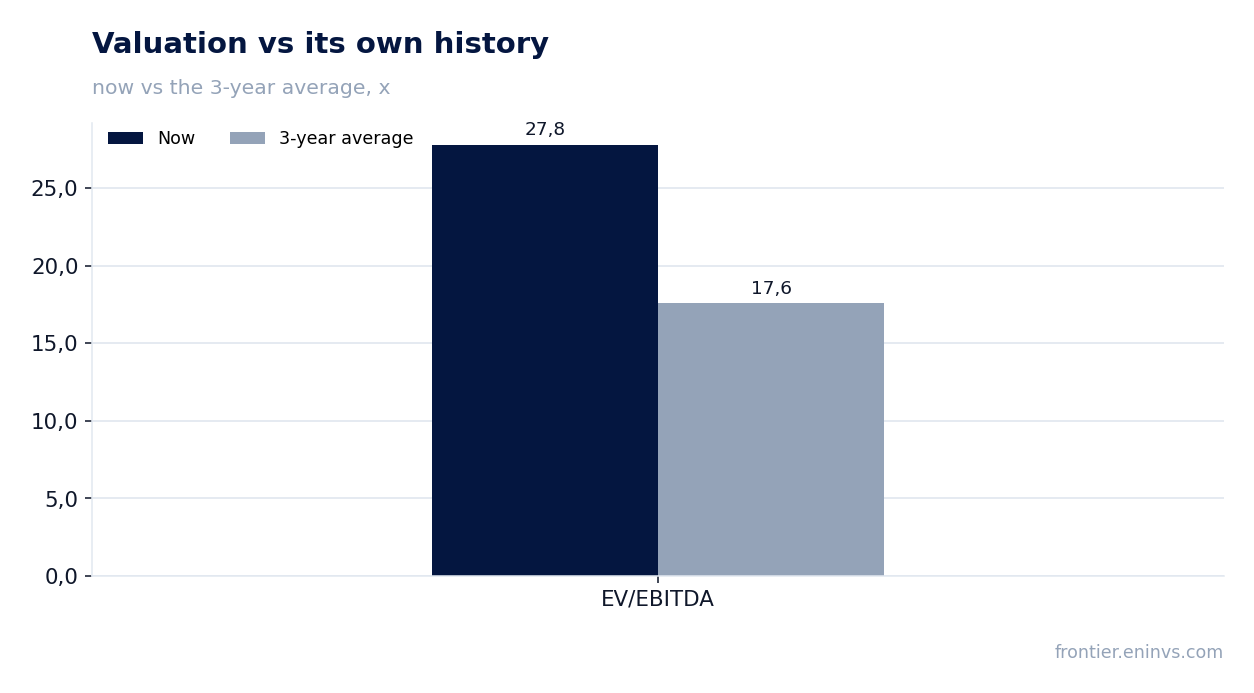
LTM EV/EBITDA of 27.8x is 58% above its own three-year average of 17.6 – the share is expensive against its history
The LTM EV/EBITDA multiple is 27.8x against its own three-year average of 17.6. That is 58% above the historical level, meaning the share trades more expensively than usual over the past three years. The LTM P/E is 38.1x.
The high valuation coexists with falling profit and margin compression. The market, judging by the multiple, is pricing in a profit recovery, but the report for the quarter ended 30 September 2026 shows the opposite – profit is declining. This divergence creates a risk of valuation correction.
On the portal's model the fair value of the share is 75% below the current market price. This is our own model estimate, not a market consensus, but it points to a significant gap between price and fundamental value.
On the portal's model the fair value of the share is 75% below the current market price
Our fundamental model, which compares EBITDA growth with a target multiple and market capitalisation, produces a fair value 75% below the current price. This means that on our model the share is overvalued fourfold.
The model relies on current profit metrics and multiples. If profit recovers, the gap could narrow, but the current report gives no grounds for such a recovery: EBITDA fell 45.3% and the margin compressed to 20.9%.
This gap is a key argument for a cautious view of the share. It is not a target price and does not mean the share must fall, but it shows how far the current price runs ahead of fundamentals.
Valuation on the latest reported figures
| Metric | Value |
|---|---|
| Market cap | 1 103 bn INR |
| P/E (LTM) | 38.1 |
| EV/EBITDA (LTM) | 27.8 |
| P/B | 3.20 |
| Net debt / EBITDA (LTM) | -0.35 |
| ROE | 10.0% |
| Dividend yield (12m) | 1.0% |
| EV/EBITDA, 3-year average | 17.6 |
Bottom line
The strength of the report remains the balance sheet: a net cash position of INR 13,917.4 mn and a net debt to EBITDA ratio of minus 0.35. Operating metrics, however, deteriorated: revenue fell 1.1%, EBITDA 45.3%, and the margin compressed from 37.7% to 20.9%. The 35.1% fall in profit was shallower than the fall in EBITDA but still substantial. The LTM EV/EBITDA of 27.8x is 58% above its own three-year average, and the portal's model points to a 75% gap between price and fair value. The verdict is neutral: the balance sheet is strong, but operating dynamics and valuation give no reason for optimism.
Open the company's financial profile CIPLA →
See also: market overview · valuation map · stock screeners