Dr. Reddy's: revenue nearly back to last year's level, but profit fell by a third as margin compressed
In its report for the quarter ended 30 September 2026, Dr. Reddy's posted revenue of INR 86,708 mn – down 1.5% year on year – EBITDA of INR 18,794 mn (–22.7%) and net profit of INR 9,250 mn (–35.6%). The EBITDA margin compressed from 27.6% to 21.7% and the net margin from 16.3% to 10.7%, while net debt stood at INR 59.0 bn on 30 September 2026. With EV/EBITDA at 22.0 against its own three-year average of 13.5, the share looks more expensive than its history, hence the verdict: rather unattractive.
Key takeaways
— Revenue nearly caught up with last year's level: the decline slowed from 5.6% in the prior quarter to 1.5%
— EBITDA fell 22.7% and the margin compressed from 27.6% to 21.7%
— Net profit dropped 35.6% – more than EBITDA – as the net margin fell to 10.7%
— Free cash flow remains positive but thin: INR 959 mn after capex
— Net debt rose to INR 59.0 bn, with net debt/EBITDA LTM at 1.13
— A dividend yield of 0.6% barely offsets the profit decline
— EV/EBITDA of 22.0 is 62% above its own three-year average of 13.5
Attractiveness
Key figures, INR bn
| Metric | Q3 2025 | Q3 2026 | Change |
|---|---|---|---|
| Revenue | 88.1 | 86.7 | -1.5% |
| EBITDA | 24.3 | 18.8 | -22.7% |
| Operating profit | 17.9 | 12.8 | -28.3% |
| Net profit | 14.4 | 9.25 | -35.6% |
| Operating cash flow | 15.6 | 5.28 | -66.1% |
| Capex | 10.1 | 4.33 | -57.3% |
| EBITDA margin | 27.6% | 21.7% | -5.9 pp |
| Net margin | 16.3% | 10.7% | -5.6 pp |
Revenue nearly caught up with last year's level: the decline slowed from 5.6% in the prior quarter to 1.5%
In the quarter ended 30 September 2026, revenue came in at INR 86,708 mn – 1.5% below the year-earlier level. That is a marked improvement on the prior quarter, when the decline reached 5.6%: the pace of contraction slowed, and relative to that quarter the dynamic accelerated.
A year earlier, revenue in the same quarter was INR 88,051 mn, so the absolute reduction is about INR 1.3 bn. The company has nearly returned to last year's sales level but remains below it.
For assessing durability, it matters that the decline is not accelerating: the pace has improved for two consecutive quarters. One quarter is not enough to call a turnaround, however – the next report will show whether the improvement has taken hold.
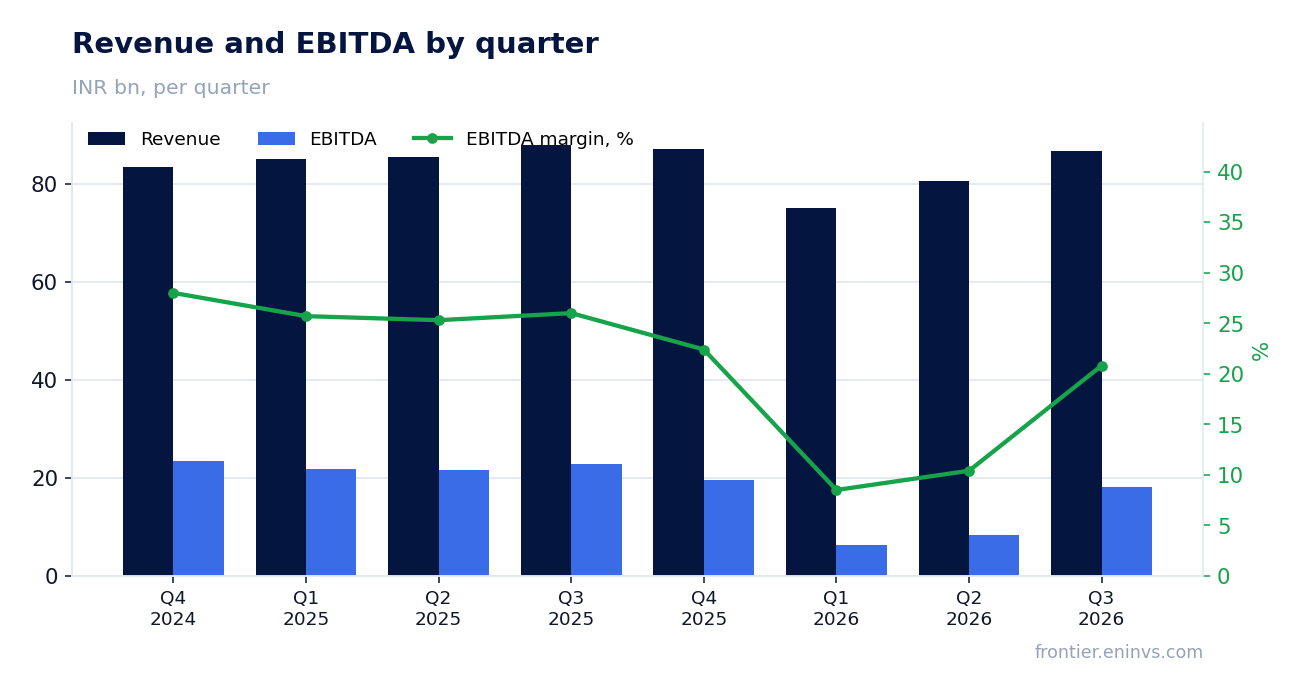
EBITDA fell 22.7% and the margin compressed from 27.6% to 21.7%
EBITDA for the quarter ended 30 September 2026 was INR 18,794 mn versus INR 22,918 mn a year earlier – a decline of 22.7%. With revenue nearly flat, this means the pressure came mainly from profitability rather than volumes.
The EBITDA margin compressed from 27.6% to 21.7% – by 5.9 percentage points. Operating profit fell to INR 12,806 mn from INR 17,867 mn a year earlier, or 28.3% – faster than revenue, confirming that costs grew relative to sales.
The 5.9 pp margin compression is the main factor behind the profit decline. Without a recovery in profitability, even a return to revenue growth will not bring profit back to prior levels.
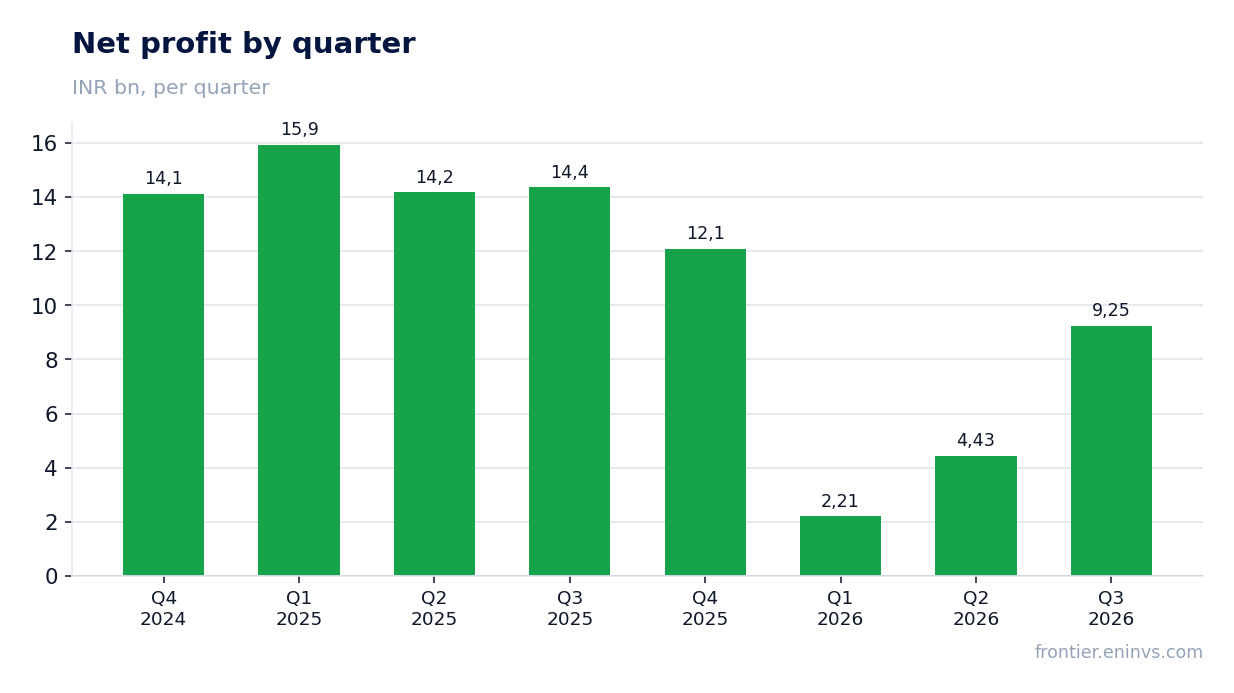
Net profit dropped 35.6% – more than EBITDA – as the net margin fell to 10.7%
Net profit for the quarter ended 30 September 2026 was INR 9,250 mn versus INR 14,372 mn a year earlier – a decline of 35.6%. That is larger than the EBITDA drop, pointing to pressure below the operating line.
The net margin fell from 16.3% to 10.7% – by 5.6 percentage points. With revenue of INR 86,708 mn and net profit of INR 9,250 mn, the company earns about 10.7 paise per rupee of sales.
The gap between the EBITDA decline (–22.7%) and the net profit decline (–35.6%) suggests that items below EBITDA – likely depreciation and interest expense – absorbed part of the profit, but the facts do not provide a breakdown, so the exact cause cannot be named. For an investor, what matters is that the pressure on profit is stronger than on the operating result.
Free cash flow remains positive but thin: INR 959 mn after capex
Operating cash flow for the quarter ended 30 September 2026 was INR 5,284 mn, with capital expenditure of INR 4,325 mn. Free cash flow after capex was INR 959 mn, which against net profit of INR 9,250 mn means only a small part of profit converted into cash.
For comparison, a year earlier operating cash flow was INR 15,573 mn with capex of INR 10,135 mn, so free cash flow was INR 5,438 mn. It is now almost six times smaller – even though revenue fell only 1.5%.
Thin free cash flow limits the company's ability to reduce debt and pay dividends without increasing borrowings. This is a key risk to keep in view.
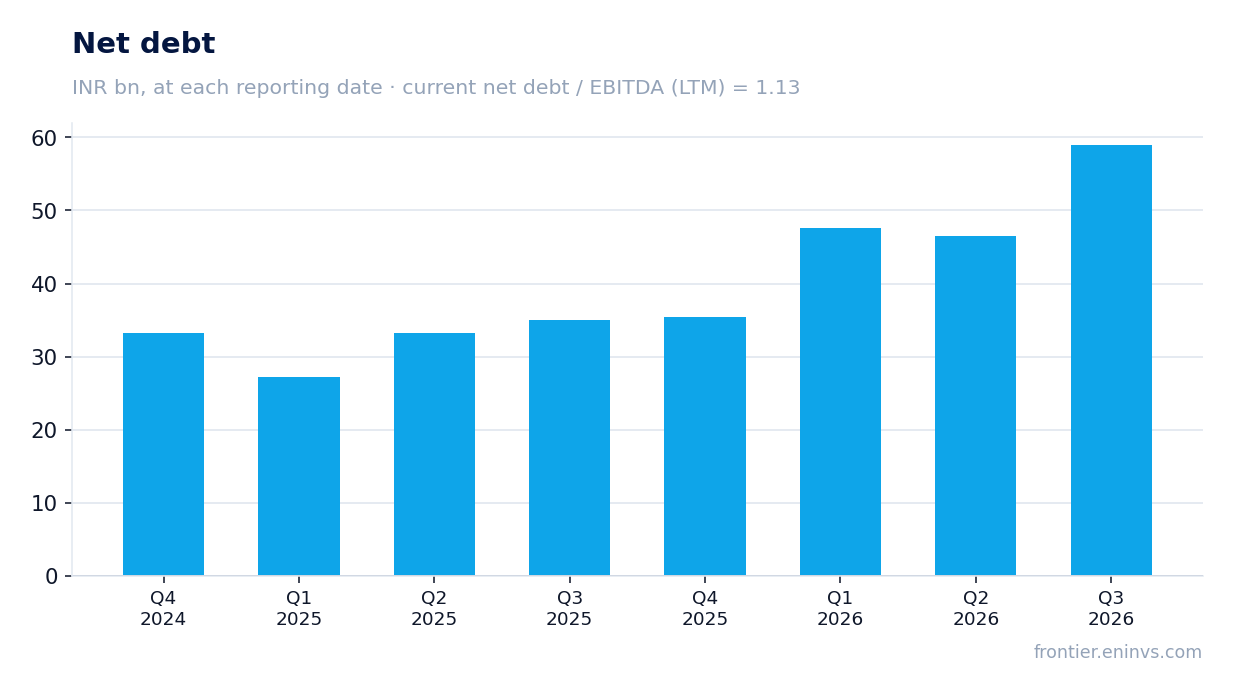
Net debt rose to INR 59.0 bn, with net debt/EBITDA LTM at 1.13
Net debt on 30 September 2026 was INR 59.0 bn. From 30 June 2026 it rose from INR 46.5 bn to INR 59.0 bn (+12.5 bn), and over 12 months from INR 35.0 bn on 30 September 2025 to INR 59.0 bn (+23.9 bn).
The ratio of net debt to EBITDA over the last twelve months is 1.13. That is a moderate level, but it is calculated on LTM EBITDA of INR 52,162.8 mn, which includes stronger prior quarters; if the current EBITDA level persists, the burden will be higher.
The INR 23.9 bn increase in debt over the year, combined with thin free cash flow, means the company is funding payouts and investment partly through borrowings. This limits financial flexibility.
A dividend yield of 0.6% barely offsets the profit decline
The trailing twelve-month dividend yield is 0.6%. At a market capitalisation of INR 1,098,160 mn, that corresponds to payouts of about INR 6.7 bn, roughly a quarter of net profit over the last twelve months (INR 27,985 mn).
Our estimate for the current year's dividend assumes the payout stays at about a quarter of profit; with LTM net profit of INR 27,985 mn, the payout could be around INR 7 bn, giving a yield of about 0.6% on the current price. The estimate is sensitive to profit: if quarterly profit stays at INR 9,250 mn, the annual base will fall and the payout will shrink.
A yield of 0.6% is well below the key rate and does not offset the 35.6% profit decline. The dividend is not an argument for the share at the current price; a further margin compression and weak free cash flow could reduce the payout.
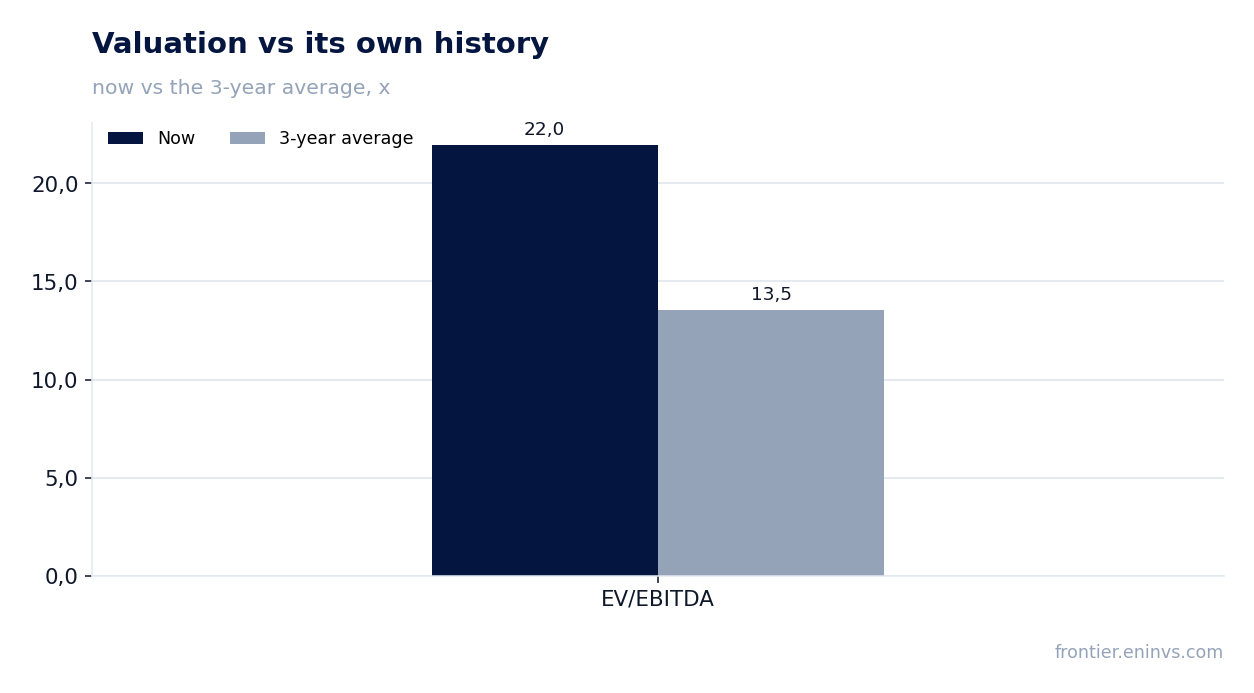
EV/EBITDA of 22.0 is 62% above its own three-year average of 13.5
EV/EBITDA over the last twelve months is 22.0 against its own three-year average of 13.5 – 62% above. The share trades markedly more expensive than its history on this multiple.
P/E LTM is 39.2, which against LTM net profit of INR 27,985 mn and a market capitalisation of INR 1,098,160 mn reflects a high valuation of earnings. Return on equity (ROE) is 9.6%, below the cost of capital for most investors.
On the portal's model, the share's fair value is 23% below the current market price. This is our own estimate, not a market consensus; it relies on EBITDA growth and a target multiple.
Valuation on the latest reported figures
| Metric | Value |
|---|---|
| Market cap | 1 098 bn INR |
| P/E (LTM) | 39.2 |
| EV/EBITDA (LTM) | 22.0 |
| P/B | 2.91 |
| Net debt / EBITDA (LTM) | 1.13 |
| Operating cash flow (LTM) | 30.9 bn |
| ROE | 9.6% |
| Dividend yield (12m) | 0.6% |
| EV/EBITDA, 3-year average | 13.5 |
Bottom line
The strong point of the report was the slowing revenue decline: from 5.6% to 1.5% year on year shows sales nearly back to last year's level. But profit fell 35.6%, the EBITDA margin compressed from 27.6% to 21.7%, and free cash flow was only INR 959 mn. Net debt rose to INR 59.0 bn, a 0.6% dividend yield does not offset the losses, and EV/EBITDA of 22.0 is 62% above its own three-year average. The verdict is rather unattractive: an improvement requires margin recovery and profit growth, not just revenue stabilisation.
Open the company's financial profile DRREDDY →
See also: market overview · valuation map · stock screeners