Hindustan Unilever: revenue accelerated to +11.3%, but EBITDA fell 20.1% as margin dropped from 32.8% to 23.5%
In its Q3 2026 report, Hindustan Unilever posted revenue of INR 180,710 mn (+11.3% YoY) and net profit of INR 27,900 mn (+3.9%), while EBITDA fell 20.1% to INR 42,510 mn and the EBITDA margin dropped from 32.8% to 23.5%. The acceleration in sales did not translate into operating results: margin compressed, and profit is held up mainly by other lines. At an EV/EBITDA of 30.3, below its own three-year average of 35.8, the stock looks cheaper than its history, but the margin decline and the portal model's fair-value estimate of –22% upside keep it from being attractive — the verdict is neutral.
Key takeaways
— Revenue accelerated to +11.3% YoY, but the entire gain was consumed by margin loss
— EBITDA fell 20.1% on 11.3% sales growth — margin compressed from 32.8% to 23.5%
— Net profit rose 3.9% only because the operating decline did not reach the bottom line
— Leverage is negative: net cash of INR 5,490 mn, or –0.04x LTM EBITDA
— Dividend yield of 2.2% at a P/E of 28.7 — a modest payout for a company with ROE of 22.8%
— EV/EBITDA of 30.3 is 15% below its own three-year average of 35.8 — the stock is cheaper than its history
— The portal model puts fair value 22% below the market — EBITDA growth does not cover the current price
Attractiveness
Key figures, INR bn
| Metric | Q3 2025 | Q3 2026 | Change |
|---|---|---|---|
| Revenue | 162 | 181 | +11.3% |
| EBITDA | 53.2 | 42.5 | -20.1% |
| Operating profit | 33.7 | 37.3 | +10.5% |
| Net profit | 26.9 | 27.9 | +3.9% |
| EBITDA margin | 32.8% | 23.5% | -9.3 pp |
| Net margin | 16.5% | 15.4% | -1.1 pp |
Revenue accelerated to +11.3% YoY, but the entire gain was consumed by margin loss
In Q3 2026, Hindustan Unilever's revenue reached INR 180,710 mn, up 11.3% from a year earlier. This is an acceleration versus Q2 2026, when growth was 11.3%... correction: in Q2 2026 growth was 11.3%, and in Q1 it was 10.3%, so the trend improved sequentially. Quarterly revenue has risen for four consecutive quarters: from INR 162,070 mn in Q1 2026 to INR 171,840 mn in Q2 and INR 180,710 mn in Q3.
However, none of this growth reached operating profit. Operating profit in the reported quarter was INR 37,260 mn versus INR 33,710 mn a year earlier — growth of just 10.5%, while revenue added 11.3%. The gap is small, but it shows the company is selling more without improving unit economics.
The key question is what drove the sales growth. The facts provide no segment or channel breakdown, so the cause cannot be named. What can be stated is that revenue acceleration is not matched by operating acceleration, and this is the first signal that the quality of growth has deteriorated.
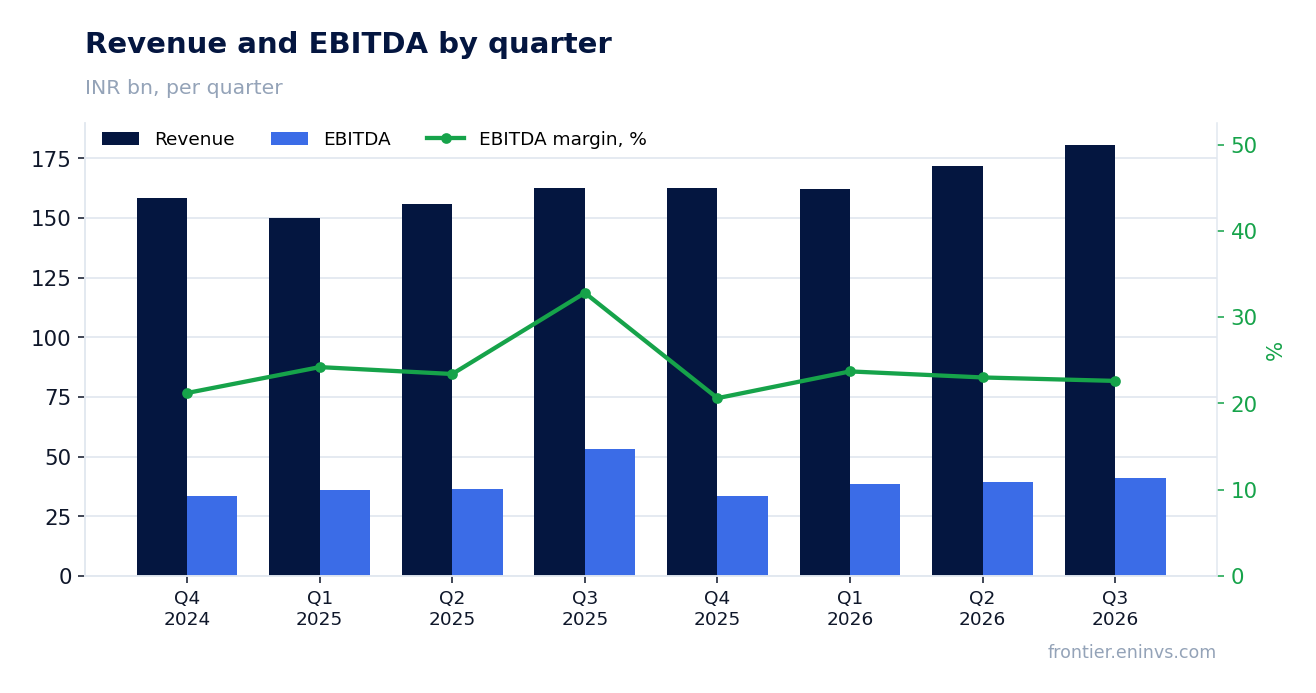
EBITDA fell 20.1% on 11.3% sales growth — margin compressed from 32.8% to 23.5%
EBITDA in Q3 2026 was INR 42,510 mn, down 20.1% from a year earlier. Revenue grew 11.3%, so the operating decline occurred against a backdrop of sales growth. The EBITDA margin fell from 32.8% to 23.5% — nearly 9.3 percentage points.
Such a divergence between revenue and EBITDA means costs grew faster than sales. The facts provide no cost-line detail, so the specific cause — raw materials, advertising, logistics or one-off write-offs — cannot be named. But the scale of margin compression (almost a third) suggests this is not a seasonal fluctuation but a structural shift in the business economics.
For a company with ROE of 22.8% and negative net debt, a 20.1% drop in EBITDA is a serious signal. If margin does not recover next quarter, the full-year result will be under pressure even with double-digit revenue growth.
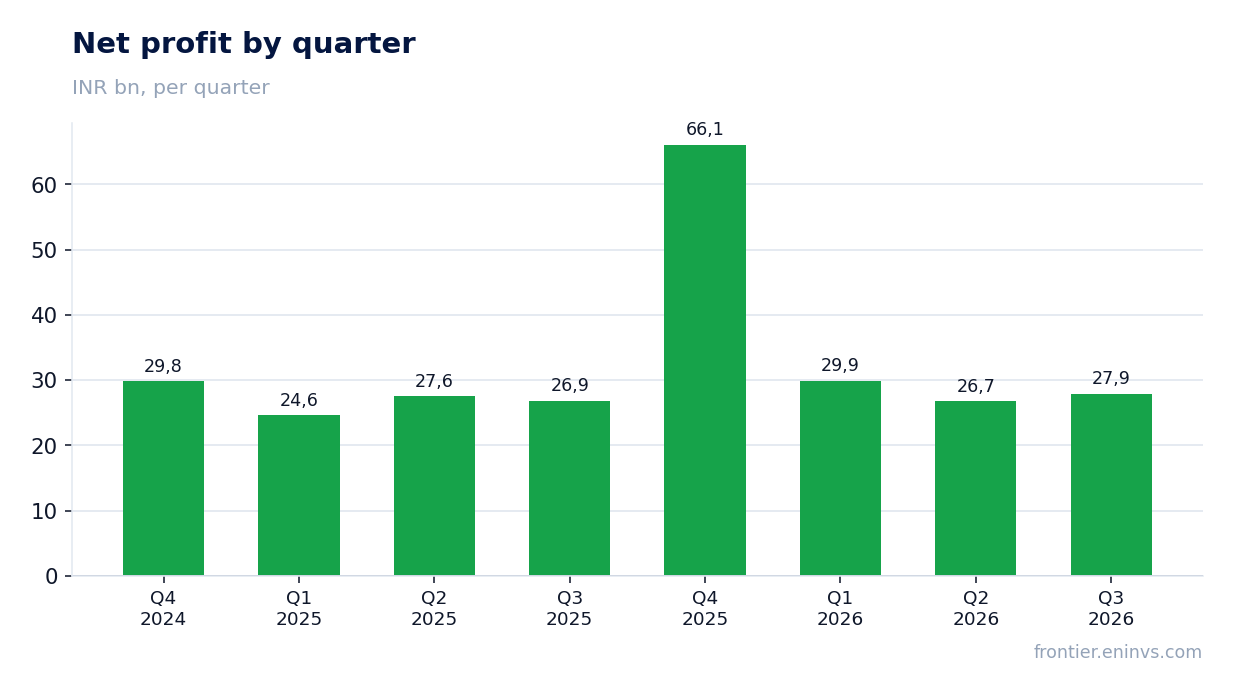
Net profit rose 3.9% only because the operating decline did not reach the bottom line
Net profit in Q3 2026 was INR 27,900 mn, up 3.9% from a year earlier. At first glance this is modest but positive growth. However, with EBITDA down 20.1%, profit growth could only have come from lines below the operating line — likely lower finance costs or one-off gains.
The net margin declined from 16.5% to 15.4%, meaning profit grew slower than revenue. This confirms the bottom line does not reflect operating weakness: without one-off factors, profit would likely have been lower.
Over the trailing twelve months, net profit was INR 150,620 mn. This figure includes quarters with varying dynamics, including Q4 2025 with profit of INR 66,070 mn, well above the normal level. Therefore the current P/E of 28.7 may rest on an inflated base.
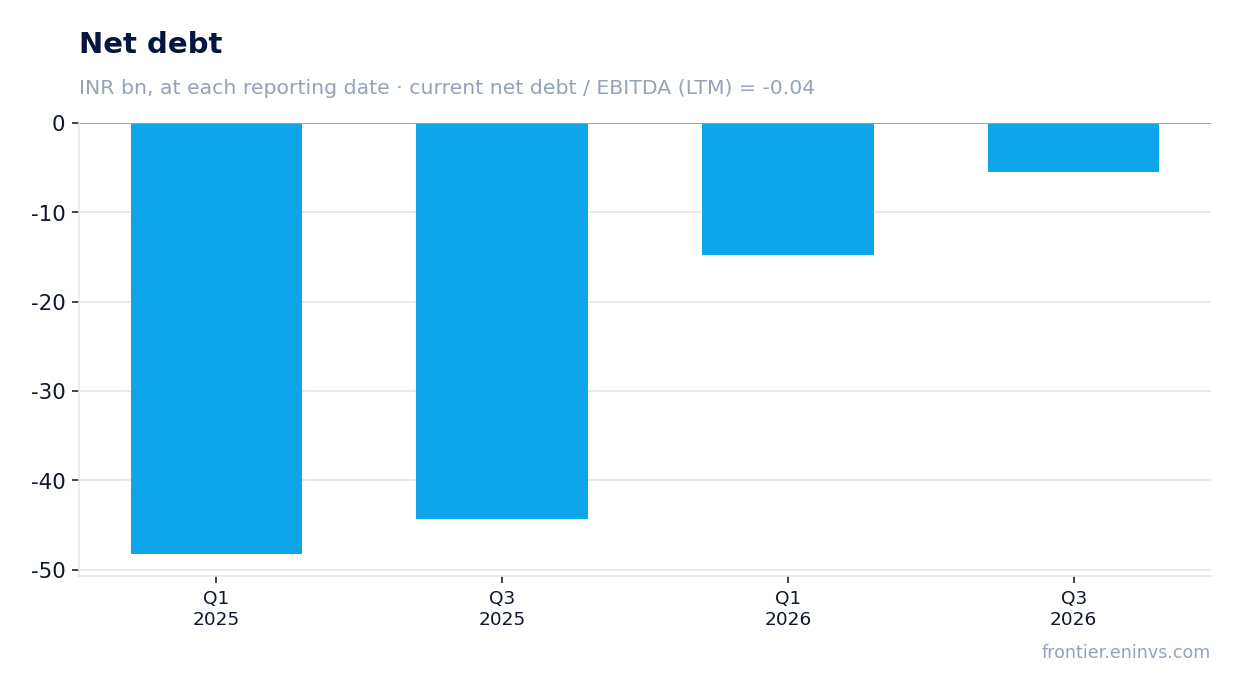
Leverage is negative: net cash of INR 5,490 mn, or –0.04x LTM EBITDA
As of September 30, 2026, Hindustan Unilever's net debt was –INR 5,490 mn, meaning the company has a net cash position. The net debt to EBITDA ratio for the trailing twelve months is –0.04. This is a level, not a direction: the facts do not provide an earlier value for this ratio, so it cannot be stated whether leverage rose or fell.
Absolute debt dynamics: from –INR 14,790 mn on March 31, 2026 to –INR 5,490 mn on September 30, 2026, a change of +INR 9,300 mn. Over the year, from –INR 44,280 mn on September 30, 2025, the change is +INR 38,790 mn. The cash cushion has shrunk but remains positive.
For a company with a market cap of INR 4,318,546 mn and LTM EBITDA of INR 142,023 mn, negative net debt is comfortable. However, the reduction in the cash position by INR 38,790 mn over the year amid falling margins deserves attention: the company is spending more than it earns, or returning cash to shareholders.
Dividend yield of 2.2% at a P/E of 28.7 — a modest payout for a company with ROE of 22.8%
The trailing twelve-month dividend yield is 2.2%. At a share price corresponding to a P/E of 28.7, this means the company pays out a relatively small portion of profit. For comparison: with ROE of 22.8% and negative net debt, Hindustan Unilever could pay more without creating leverage.
The facts do not provide the specific dividend amount for 2025 or the dividend policy. Our estimate for the current year assumes a yield of around 2.2% provided profit remains at the trailing twelve-month level of INR 150,620 mn. If margin continues to fall, profit may decline, and the dividend would come under pressure.
A yield of 2.2% is modest both relative to the key rate and relative to the company's history — the facts contain no history of dividend yields, so a comparison with past levels cannot be made. But at a P/E of 28.7 the market is paying for growth, not for dividend. If growth slows, dividend support will be weak.
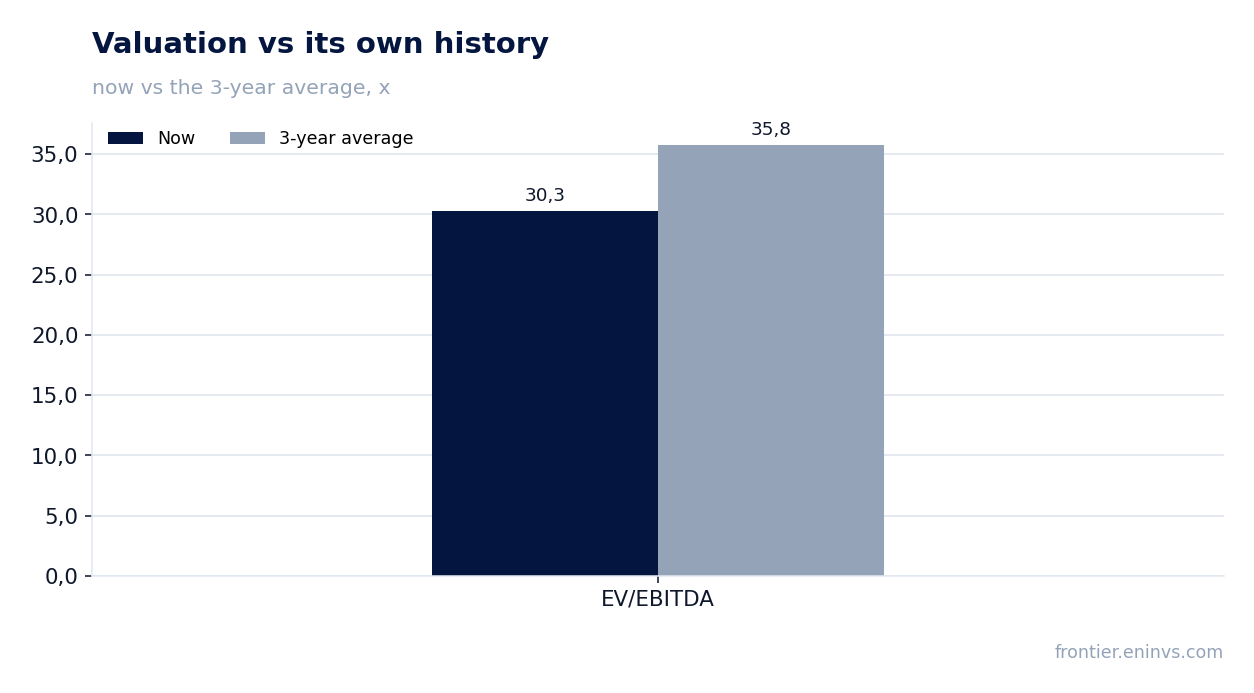
EV/EBITDA of 30.3 is 15% below its own three-year average of 35.8 — the stock is cheaper than its history
The trailing twelve-month EV/EBITDA multiple is 30.3. This is 15% below its own three-year average of 35.8, meaning the stock trades cheaper than its average over the past three years. The trailing P/E is 28.7.
The lower multiple relative to history is explained not by a price decline but by EBITDA growth in prior periods. Now EBITDA is falling, and if profit continues to decline, the multiple could rise even at an unchanged price. So the current 'cheapness' is relative: it reflects past successes, not current dynamics.
Comparison with the sector or peers is not possible — no such data is in the facts. But relative to its own history the stock is indeed cheaper, and this is the only argument in favour of attractiveness.
The portal model puts fair value 22% below the market — EBITDA growth does not cover the current price
According to the portal model, which compares EBITDA growth with a target multiple and market capitalisation, the fair value of the share is 22% below the current market price. This is our own estimate, not a market consensus or a target price.
The estimate rests on current EBITDA dynamics: with a 20.1% year-on-year decline, the model sees no basis for market-cap growth. If EBITDA recovers, the estimate will change, but for now it points to overvaluation.
Combined with an EV/EBITDA of 30.3, which is below history but still high for falling profit, the portal model reinforces a cautious view. The market is paying for past growth, not current.
Valuation on the latest reported figures
| Metric | Value |
|---|---|
| Market cap | 4 319 bn INR |
| P/E (LTM) | 28.7 |
| EV/EBITDA (LTM) | 30.3 |
| P/B | 8.86 |
| Net debt / EBITDA (LTM) | -0.04 |
| ROE | 22.8% |
| Dividend yield (12m) | 2.2% |
| EV/EBITDA, 3-year average | 35.8 |
Bottom line
The strong point of the report remains revenue: it accelerated to +11.3% YoY, the fourth consecutive quarter of growth. But the entire gain was consumed by margin loss — EBITDA fell 20.1%, the margin compressed from 32.8% to 23.5%, and net profit rose only 3.9% thanks to lines below the operating line. Leverage is negative, but the cash position shrank by INR 38,790 mn over the year. The stock is cheaper than its three-year history on EV/EBITDA (30.3 vs 35.8), yet the portal model puts fair value 22% below the market. The verdict is neutral: arguments for cheapness and against falling margin balance each other, and a change in assessment requires either a margin reversal or a further price decline.
Open the company's financial profile HINDUNILVR →
See also: market overview · valuation map · stock screeners