Maruti Suzuki: revenue up 36%, but margin halved – sales growth no longer delivers the same profit
10 августа Maruti Suzuki раскрыла результаты за первый квартал 2026 финансового года (апрель–июнь 2025). Выручка выросла на 36,1% год к году, до 517 082 млн INR, однако EBITDA снизилась на 6,7%, а чистая прибыль – на 9,1%. Маржа EBITDA упала с 12,2% до 8,3%, что отражает давление на рентабельность. При текущей цене акции выглядят скорее непривлекательно: мультипликаторы выше исторических средних, а модель портала показывает потенциал снижения на 6%.
Key takeaways
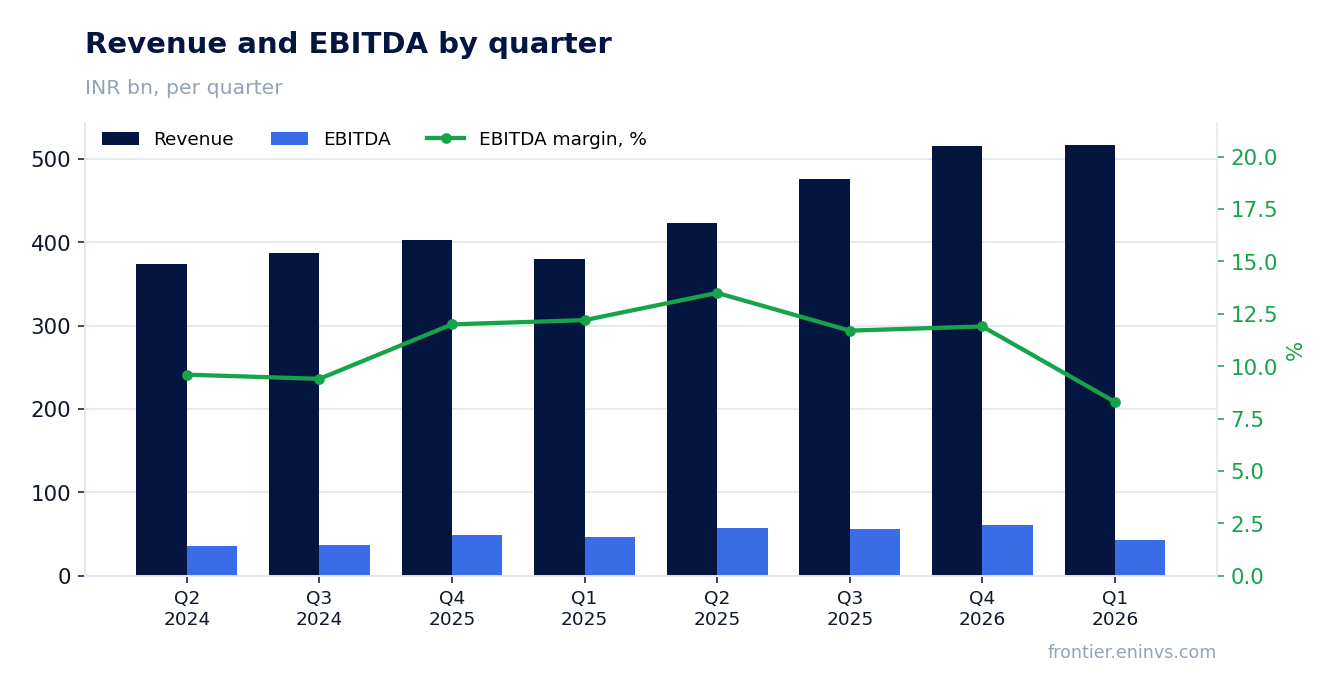
— Revenue +36.1% – record quarter, but EBITDA margin fell to 8.3% from 12.2% a year earlier
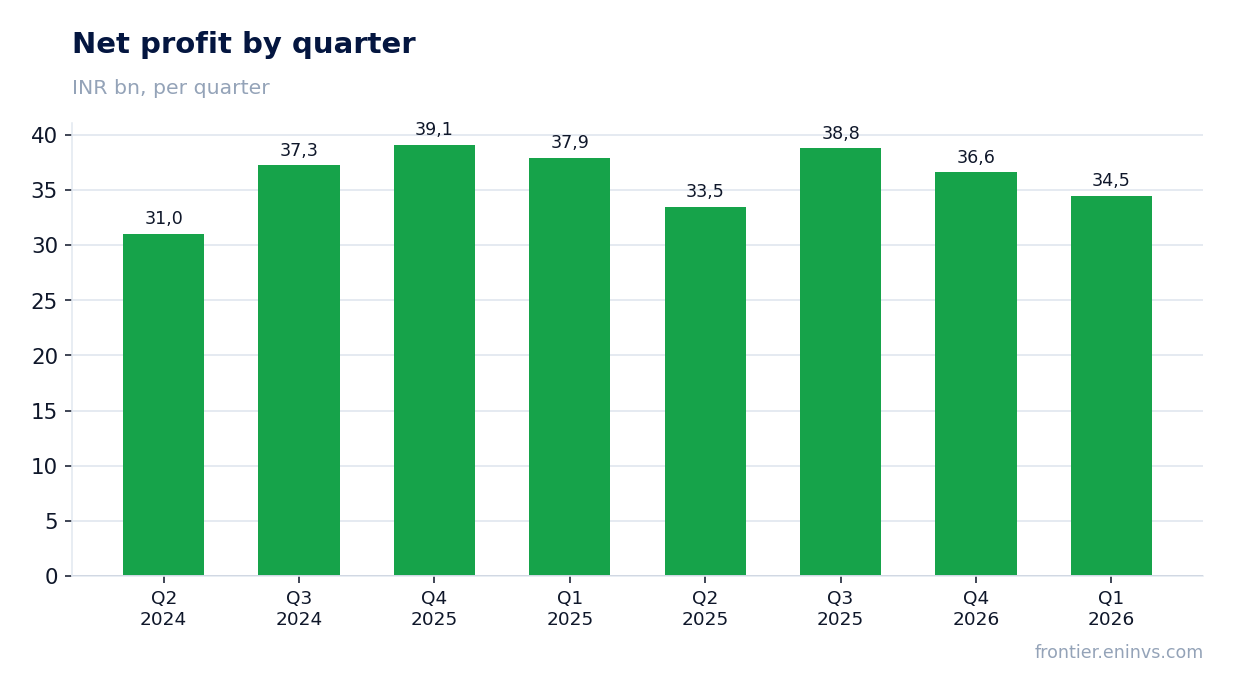
— Net profit down 9.1% despite revenue growth – operating leverage works negatively
— LTM EBITDA 212,208 million INR – margin under pressure, but absolute figure remains high
— Leverage: net debt/EBITDA LTM at -0.0 – company is financially stable
— Dividend yield 1.11% – modest, but payments backed by strong cash flow
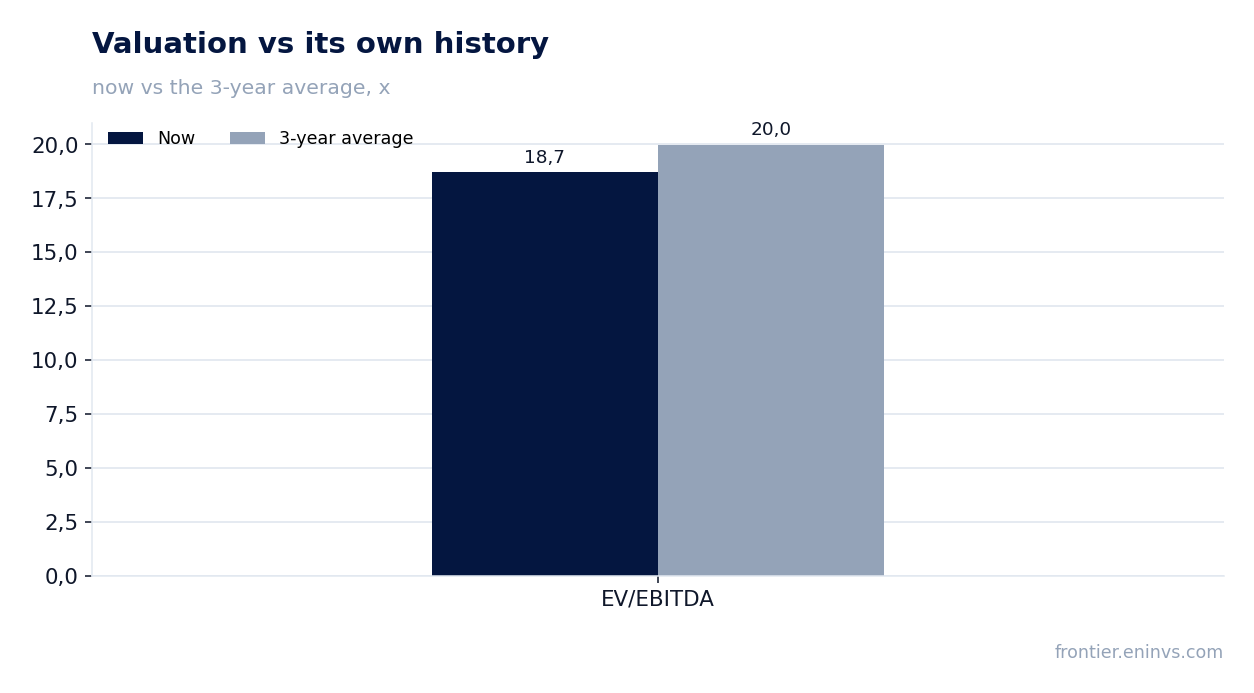
— Valuation: EV/EBITDA LTM 18.69 vs 3-year average 19.98 – shares slightly cheaper than their history
— Portal model: 6% downside – fair value below current price
Attractiveness
Key figures, INR bn
| Metric | Q1 2025 | Q1 2026 | Change |
|---|---|---|---|
| Revenue | 380 | 517 | +36.1% |
| EBITDA | 46.2 | 43.1 | -6.7% |
| Operating profit | 30.7 | 25.3 | -17.4% |
| Net profit | 37.9 | 34.5 | -9.1% |
| EBITDA margin | 12.2% | 8.3% | -3.9 pp |
| Net margin | 10.0% | 6.7% | -3.3 pp |
Revenue +36.1% – record quarter, but EBITDA margin fell to 8.3% from 12.2% a year earlier
In the first quarter of fiscal 2026, Maruti Suzuki's revenue reached 517,082 million INR, up 36.1% from the same quarter a year earlier. This is the highest quarterly figure in the company's history, reflecting strong demand for cars.
However, sales growth did not translate into profit: EBITDA amounted to 43,133 million INR, down 6.7% from the previous year. EBITDA margin fell from 12.2% to 8.3% – indicating that the company faced rising costs, possibly for raw materials and logistics, which it could not offset with price increases.
Net profit down 9.1% despite revenue growth – operating leverage works negatively
Net profit for the reporting quarter amounted to 34,469 million INR, down 9.1% from a year earlier. With revenue growing by more than a third, this discrepancy indicates that sales growth is accompanied by a disproportionate increase in costs.
Net margin contracted from 10.0% to 6.7%. This means the company earns less on each rupee of sales, and if the trend continues, future quarters could show further declines in profitability.
LTM EBITDA 212,208 million INR – margin under pressure, but absolute figure remains high
Over the trailing twelve months (LTM), Maruti Suzuki's EBITDA amounted to 212,208 million INR on revenue of 1,908,100 million INR. These are significant absolute figures that provide the company with a solid operational base.
However, the dynamics of recent quarters show that margins are declining: in Q1 2026, EBITDA margin fell to 8.3% from 12.2% a year earlier. If margin pressure persists, LTM figures will begin to deteriorate, which could affect the company's valuation.
Leverage: net debt/EBITDA LTM at -0.0 – company is financially stable
As of the latest balance sheet date, Maruti Suzuki's net debt stood at -41 million INR, meaning the company has a net cash position. The net debt/EBITDA LTM ratio is at -0.0, indicating no debt burden.
Over the past 12 months, net debt increased by 1.2 billion RUB (in ruble equivalent), but in absolute terms the company remains financially stable. This allows it to finance investments and dividends without resorting to borrowed capital.
Dividend yield 1.11% – modest, but payments backed by strong cash flow
Over the trailing twelve months, Maruti Suzuki paid dividends providing a yield of 1.11% at the current market capitalization of 3,967,137 million INR. This is a low level, especially compared to the key rate, but payments are backed by LTM operating cash flow of 191,000 million INR.
Given the net cash position and stable cash flow, the company has the ability to maintain or even increase dividends. However, management's priority, judging by the dynamics, is reinvestment in growth, which limits dividend attractiveness.
Valuation: EV/EBITDA LTM 18.69 vs 3-year average 19.98 – shares slightly cheaper than their history
The current EV/EBITDA LTM multiple is 18.69, slightly below the three-year average (19.98). This suggests that shares trade at a small discount to their own history, but not cheap in absolute terms.
P/E LTM at 27.68 also indicates a high valuation. With declining margins, such a valuation seems justified only if the company can restore profitability in the coming quarters.
Portal model: 6% downside – fair value below current price
According to the portal's model, based on EBITDA growth and target multiple, the fair value of Maruti Suzuki shares is 6% below the current market price. This means that the market has already priced in expectations of further growth that may not materialize if margin pressure persists.
The portal's model is not a market consensus or a target price, but rather an internal estimate by our analysts. Nevertheless, it serves as a guide for investment decisions.
Valuation on the latest reported figures
| Metric | Value |
|---|---|
| Market cap | 3 967 bn INR |
| P/E (LTM) | 27.7 |
| EV/EBITDA (LTM) | 18.7 |
| P/B | 3.70 |
| Net debt / EBITDA (LTM) | -0.00 |
| Operating cash flow (LTM) | 191 bn |
| ROE | 12.9% |
| Dividend yield (12m) | 1.1% |
| EV/EBITDA, 3-year average | 20.0 |
Bottom line
Сильной стороной отчёта остаётся впечатляющий рост выручки на 36,1%, достигнутый благодаря высокому спросу. Однако снижение EBITDA и чистой прибыли, а также падение маржинальности вдвое – тревожный сигнал: компания не может полностью перенести рост издержек на потребителя. При текущей оценке, близкой к историческим средним, и негативной динамике рентабельности акции выглядят скорее непривлекательно. Для изменения вердикта необходимо восстановление маржинальности до двузначных уровней и подтверждение устойчивости роста прибыли.
Open the company's financial profile MARUTI →
See also: market overview · valuation map · stock screeners