Maruti Suzuki: revenue up a quarter, but profit down 26% as margin gives way
On 12 February Maruti Suzuki reported results for the third quarter of 2026. Revenue rose 24.0% year on year to INR 524,923 mn, EBITDA added 14.2% to INR 52,467 mn, while net profit fell 26.4% to INR 24,661 mn. Top-line growth decelerated from the previous quarter (+36.1%), and the EBITDA margin compressed from 10.9% to 10.0%. At an EV/EBITDA of 17.8 against its own three-year average of 20.0 the share trades below its history, but the weak margin and falling profit keep it from being attractive – the verdict is neutral.
Key takeaways
— Revenue rose 24.0% year on year, but growth decelerated from 36.1% a quarter earlier
— EBITDA added 14.2%, yet its margin compressed from 10.9% to 10.0%
— Net profit fell 26.4%, and the net margin dropped from 7.9% to 4.7%
— Leverage is negative: a net cash position of INR 8,483 mn with net debt/EBITDA at -0.04
— Dividend yield of 1.2% against a P/E LTM of 26.8 – the payout remains modest
— EV/EBITDA of 17.8 is 11% below its own three-year average of 20.0
— The portal model implies -16% to fair value
Attractiveness
Key figures, INR bn
| Metric | Q3 2025 | Q3 2026 | Change |
|---|---|---|---|
| Revenue | 423 | 525 | +24.0% |
| EBITDA | 45.9 | 52.5 | +14.2% |
| Operating profit | 33.8 | 28.0 | -17.1% |
| Net profit | 33.5 | 24.7 | -26.4% |
| EBITDA margin | 10.9% | 10.0% | -0.9 pp |
| Net margin | 7.9% | 4.7% | -3.2 pp |
Revenue rose 24.0% year on year, but growth decelerated from 36.1% a quarter earlier
In the third quarter of 2026 Maruti Suzuki's revenue reached INR 524,923 mn, up 24.0% from a year earlier. That is solid growth, but slower than in the previous quarter, when revenue added 36.1% year on year. The deceleration is visible in the quarterly dynamics, not in the cumulative total.
Over the trailing twelve months revenue amounted to INR 2,009,600 mn. That figure describes the annual scale of the business, not the growth rate of the reported quarter. For assessing sustainability, it matters that quarterly revenue has stayed above INR 500,000 mn for two consecutive quarters.
The slowdown in revenue growth is a key signal for investors. If growth drops below 20% in the next report, it would confirm cooling demand. For now the company retains double-digit growth, but no longer as fast as at the start of the year.
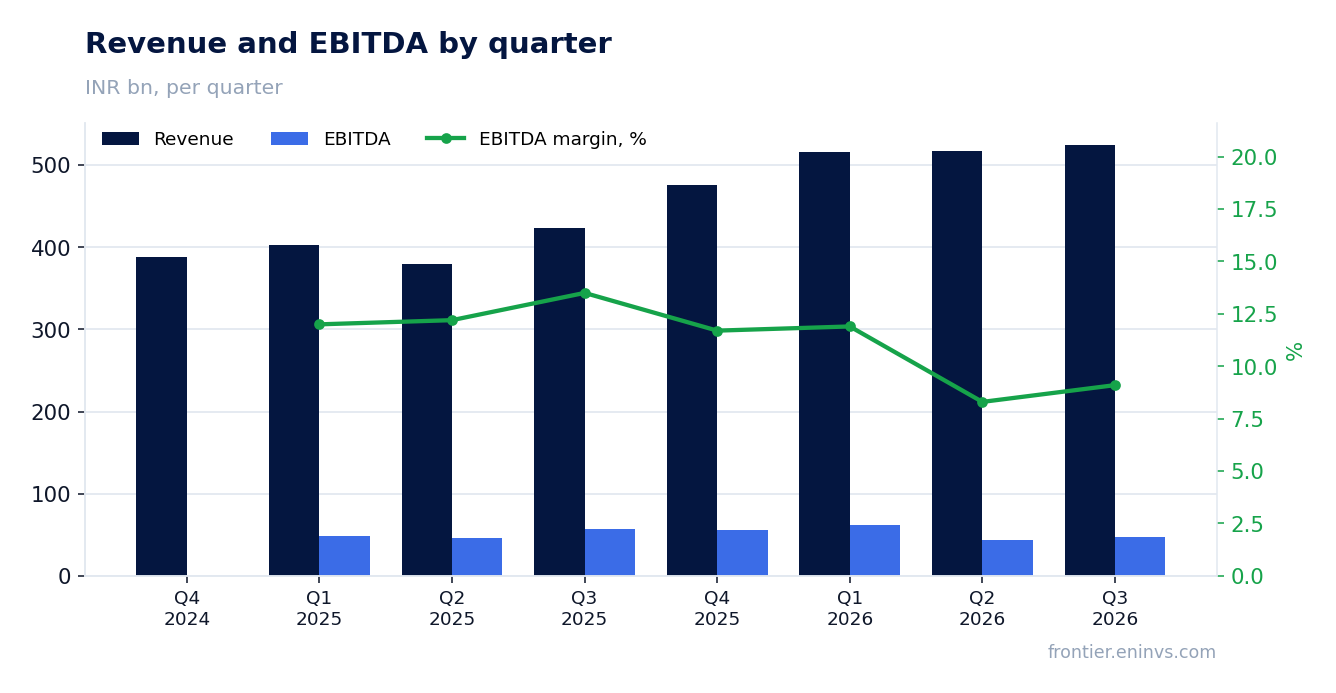
EBITDA added 14.2%, yet its margin compressed from 10.9% to 10.0%
EBITDA in the reported quarter came to INR 52,467 mn, up 14.2% year on year. Growth is there, but it lags revenue growth (+24.0%), which pulled the EBITDA margin down from 10.9% to 10.0%. That is a 0.9 percentage point compression – a direct result of costs rising faster than revenue.
Operating profit amounted to INR 28,042 mn. It also rose against the year-earlier level, but its growth rate is below that of revenue. The gap between revenue and EBITDA dynamics points to cost pressure that the company has not yet offset through pricing or sales mix.
A 10.0% margin is not a disaster, but it is a marked deterioration from 10.9% a year earlier. To restore profitability the company needs either faster revenue growth or slower cost growth. In the next report it is worth watching whether the margin returns above 10.5%.
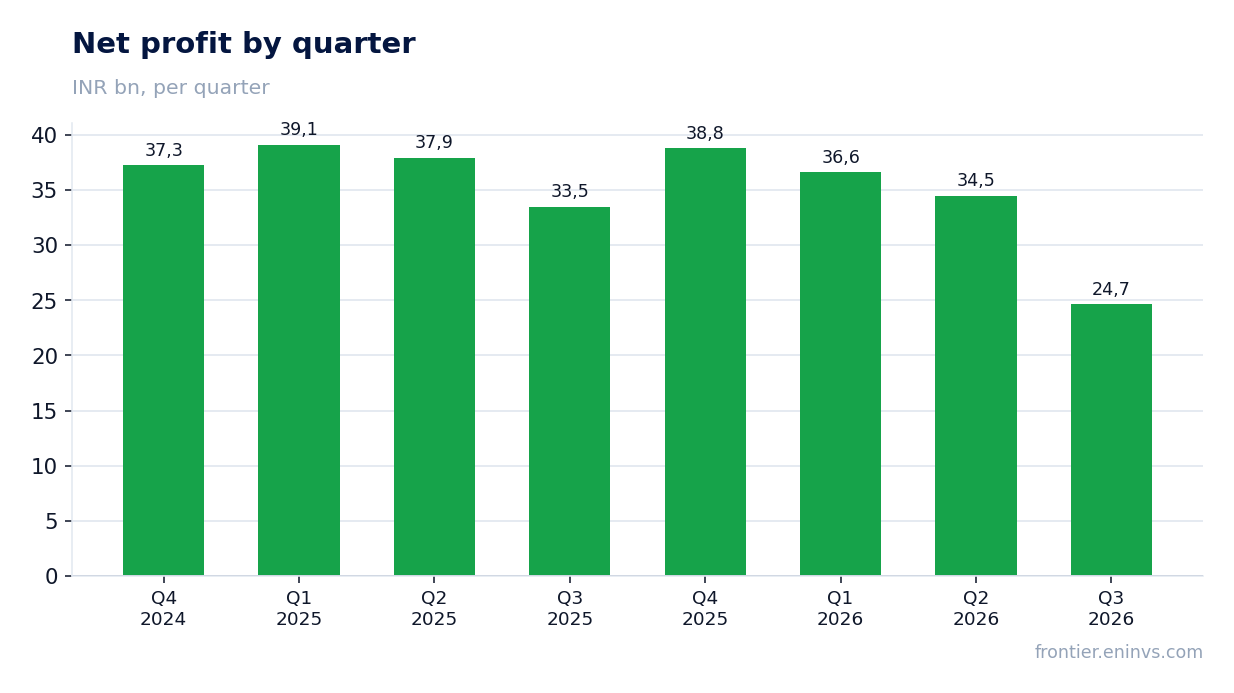
Net profit fell 26.4%, and the net margin dropped from 7.9% to 4.7%
Net profit in the third quarter of 2026 came to INR 24,661 mn, down 26.4% from a year earlier. The net margin compressed from 7.9% to 4.7% – a drop of 3.2 percentage points. This is a much sharper deterioration than in EBITDA, pointing to additional factors below the operating line.
Over the trailing twelve months net profit amounted to INR 134,511 mn. That figure is on an LTM basis and should not be mixed with the quarterly decline. The gap between annual profit and the weak quarter shows that earlier periods were stronger while the current quarter drags the result down.
Falling net profit alongside rising revenue is the main warning signal in the report. The company sells more but earns less. The causes may lie in the cost structure or one-off factors, but without confirmation from the report they cannot be named. For investors, what matters is that profitability is deteriorating faster than expected.
Leverage is negative: a net cash position of INR 8,483 mn with net debt/EBITDA at -0.04
As of 30 September 2026 Maruti Suzuki's net debt stood at -INR 8,483 mn, meaning the company holds a net cash position. The ratio of net debt to trailing-twelve-month EBITDA is -0.04. A negative value means cash exceeds debt obligations.
From 31 March 2026 net debt moved from -INR 0.0 bn to -INR 8.5 bn, so the cash cushion grew by INR 8.4 bn. This movement applies only to the stated interval and does not characterise the overall trend in leverage. The company faces no debt pressure, which provides a buffer if margins deteriorate.
Negative net debt is a strong point of the report. It allows the company to fund investment and dividends without borrowing. On its own, however, it does not offset the fall in profit: leverage creates no risk, but it does not solve the profitability problem either.
Dividend yield of 1.2% against a P/E LTM of 26.8 – the payout remains modest
The trailing-twelve-month dividend yield is 1.2%. With a market capitalisation of INR 3,607,146 mn and a P/E LTM of 26.8, this is a modest level for a company with a net cash position. The yield is lower than one might expect from a business with negative net debt.
Our estimate for the current year's dividend is 1.2–1.3% of the current price, corresponding to a payout of roughly INR 44,000–47,000 mn. The estimate relies on LTM profit of INR 134,511 mn and a payout ratio of about 33–35%. The forecast hinges on whether profit holds at the current level and whether the company needs funds for investment.
The dividend is not the main argument for the share. A 1.2% yield is below that of many stocks with comparable capitalisation and does not offset the fall in profit. If profit continues to decline, the dividend could be cut. For income-oriented investors this is a weak argument.
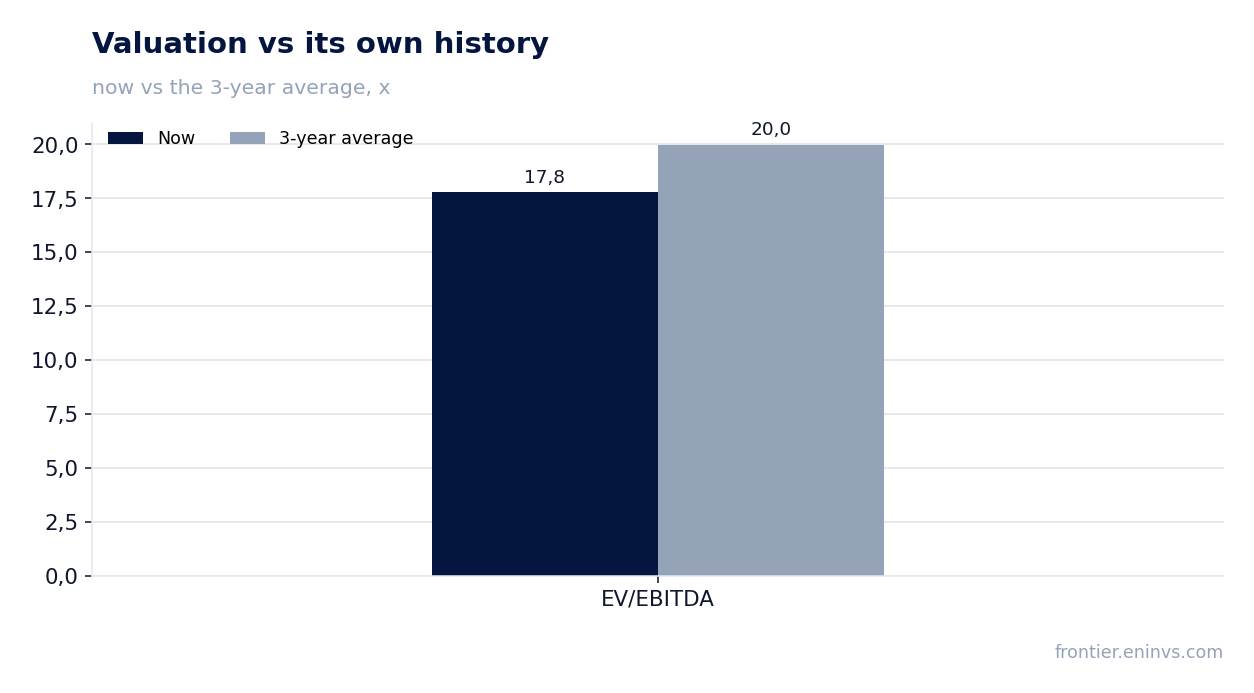
EV/EBITDA of 17.8 is 11% below its own three-year average of 20.0
The trailing-twelve-month EV/EBITDA multiple is 17.8. That is 11% below its own three-year average of 20.0. On this measure the share trades below its history, which may point to undervaluation relative to past levels.
A lower multiple does not necessarily mean attractiveness, however. It may reflect either market expectations or a deterioration in fundamentals. With profit and margin falling, a lower multiple may be justified. Comparison with its own history is useful but not a sufficient argument.
The portal model estimates fair value based on EBITDA growth and a target multiple. On this model the share's upside is -16% to the current price. This is our own estimate, not market consensus. It indicates that the current price is above the calculated fair value.
The portal model implies -16% to fair value
On the portal model Maruti Suzuki's fair value is 16% below the current price. The model incorporates EBITDA growth and a target multiple. Negative upside means the market values the company above what our fundamental model implies.
This result is consistent with the high P/E LTM of 26.8 and the modest 1.2% dividend yield. The market is paying for growth that decelerated in the reported quarter. If profit continues to fall, the current valuation may prove stretched.
The model is not a target price and does not capture all factors. It shows that at current metrics the share does not look cheap. A change in the assessment would require either profit growth or a lower price.
Valuation on the latest reported figures
| Metric | Value |
|---|---|
| Market cap | 3 607 bn INR |
| P/E (LTM) | 26.8 |
| EV/EBITDA (LTM) | 17.8 |
| P/B | 3.37 |
| Net debt / EBITDA (LTM) | -0.04 |
| ROE | 9.1% |
| Dividend yield (12m) | 1.2% |
| EV/EBITDA, 3-year average | 20.0 |
Bottom line
The strong point of the report remains revenue: it rose 24.0% year on year, and the net cash position of INR 8,483 mn provides a buffer. However, profit fell 26.4%, the margin compressed, and growth decelerated. The EV/EBITDA of 17.8 is below its own history, but the portal model implies -16% to fair value. The verdict is neutral: the share does not look attractive at current profitability, but it is not clearly overvalued given the cash cushion.
Open the company's financial profile MARUTI →
See also: market overview · valuation map · stock screeners