Reliance Industries: revenue up 29.8% but EBITDA down 28.1% – profit is not carried by operations
Reliance Industries reported results for the quarter ended 30 September 2026. Revenue reached INR 3,306.0 bn, up 29.8% year on year, net profit rose 40.6% to INR 255.5 bn, while EBITDA fell 28.1% to INR 470.9 bn and the margin dropped to 14.2% from 25.7%. With EV/EBITDA at 12.5, in line with its three-year average of 12.9, and the portal model pointing to a 44% downside to fair value, the share looks neutral: revenue and profit growth is not backed by operating profitability.
Key takeaways
— Revenue rose 29.8% year on year, an acceleration from 27.0% a quarter earlier
— EBITDA fell 28.1% and the margin dropped to 14.2% from 25.7% – revenue growth did not reach operating profit
— Net profit rose 40.6% while EBITDA fell, and the gap between them shows profit is not carried by operations
— Leverage at 1.29 LTM EBITDA is moderate, but over 12 months net debt rose from INR 1,479.6 bn to INR 2,032.3 bn
— Dividend yield of 0.46% is barely above zero and gives no support to the price
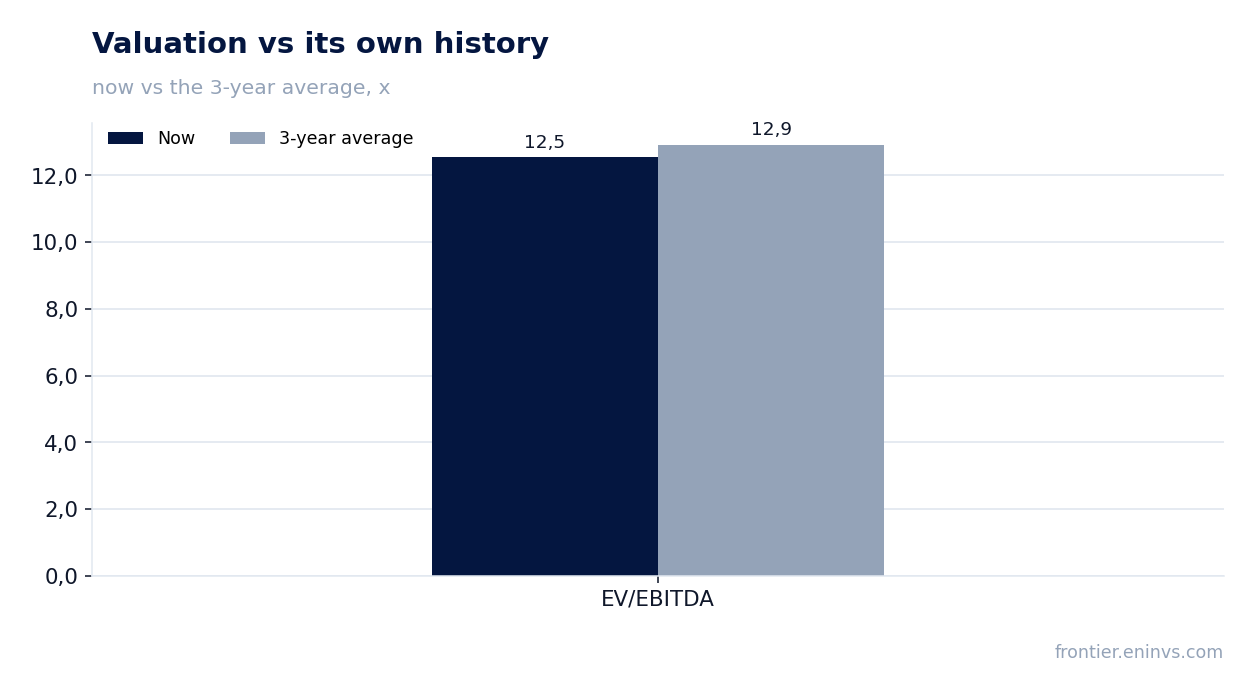
— EV/EBITDA of 12.5 matches the three-year average of 12.9, so the market values the company exactly as it is used to
— The portal model points to a 44% downside to fair value – EBITDA growth does not justify the current market cap
Attractiveness
Key figures, INR bn
| Metric | Q3 2025 | Q3 2026 | Change |
|---|---|---|---|
| Revenue | 2 546 | 3 306 | +29.8% |
| EBITDA | 655 | 471 | -28.1% |
| Operating profit | 315 | 413 | +31.2% |
| Net profit | 182 | 255 | +40.6% |
| EBITDA margin | 25.7% | 14.2% | -11.5 pp |
| Net margin | 7.1% | 7.7% | +0.6 pp |
Revenue rose 29.8% year on year, an acceleration from 27.0% a quarter earlier
Revenue for the quarter ended 30 September 2026 was INR 3,306.0 bn, up 29.8% from a year earlier. A quarter earlier growth was 27.0%, so the pace accelerated. This is the second consecutive quarter of around 30% growth after 12.5% at the end of 2025.
The acceleration is visible in absolute terms too: revenue rose from INR 3,094.7 bn in the previous quarter to INR 3,306.0 bn. Such a step in one quarter is a strong demand signal, but it is not accompanied by operating profit growth, and that is the main contradiction of the report.
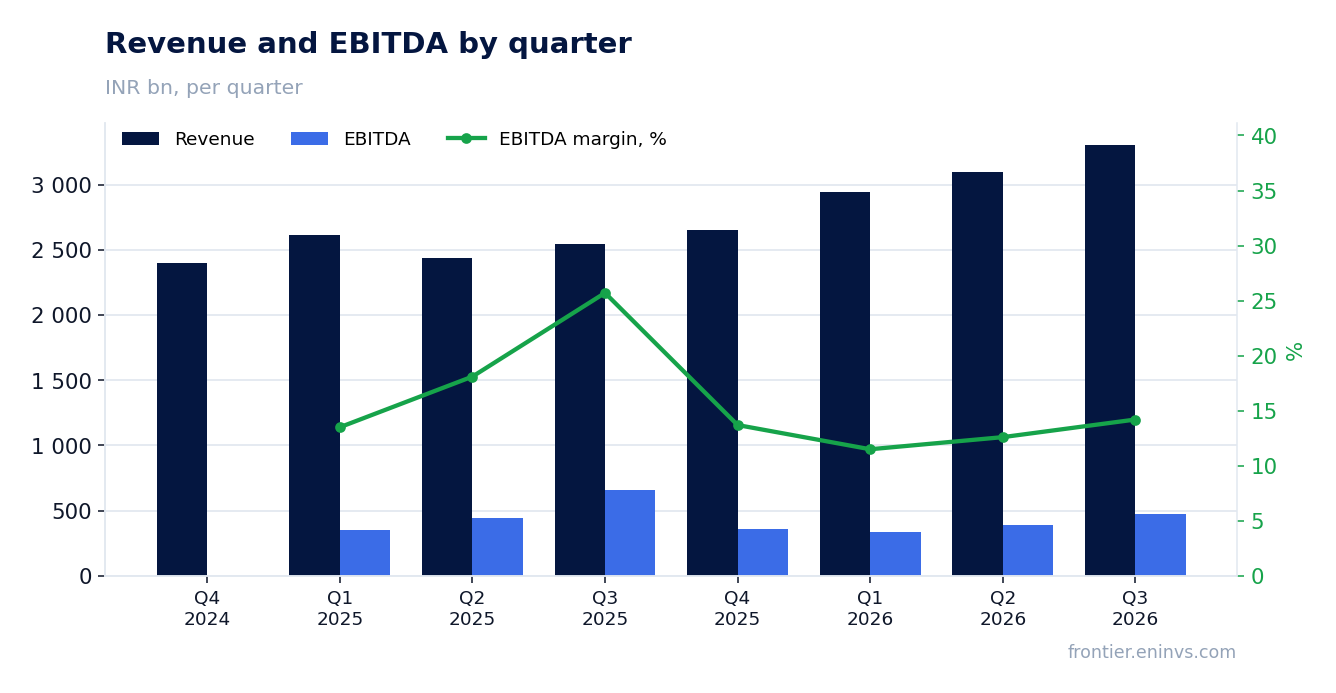
EBITDA fell 28.1% and the margin dropped to 14.2% from 25.7% – revenue growth did not reach operating profit
EBITDA for the reported quarter was INR 470.9 bn versus INR 655.2 bn a year earlier, a fall of 28.1%. The EBITDA margin compressed to 14.2% from 25.7% – more than 11 percentage points. Operating profit, meanwhile, rose to INR 413.0 bn, so the gap between EBITDA and operating profit narrowed.
This dynamic means revenue growth was accompanied by disproportionate growth in costs below operating profit – depreciation, interest or other items that are excluded from operating profit but included in EBITDA. They consumed almost all of the operating margin.
For a holder this is the key risk: the company is scaling up, but each unit of revenue brings less and less EBITDA. Until the margin stabilises, strong revenue growth does not translate into value.
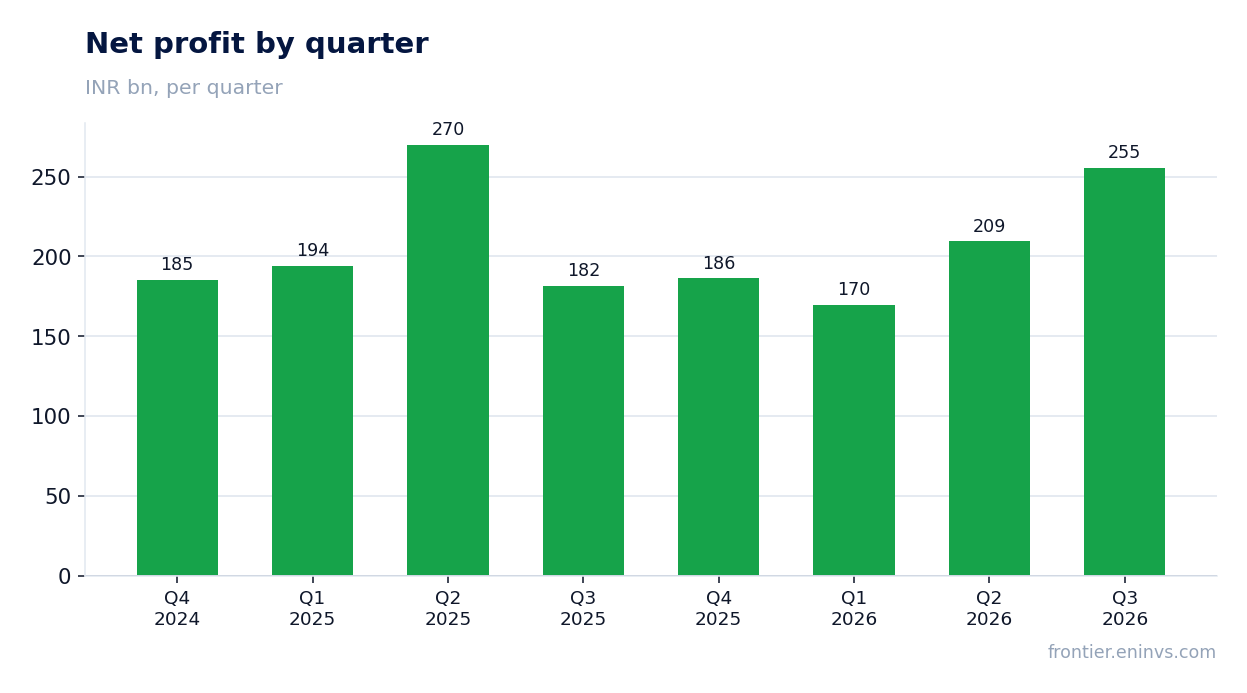
Net profit rose 40.6% while EBITDA fell, and the gap between them shows profit is not carried by operations
Net profit for the quarter was INR 255.5 bn, up 40.6% from a year earlier. Yet EBITDA fell 28.1% and operating profit rose only to INR 413.0 bn. Profit growth against falling EBITDA means the result was supported by items below the operating line – likely financial income or one-offs, though the facts do not disclose their composition.
The net margin rose to 7.7% from 7.1%, so profit grew faster than revenue. This divergence from EBITDA dynamics is the main question about earnings quality: operating margin is falling while net margin is rising, and a holder needs to understand how sustainable that gap is.
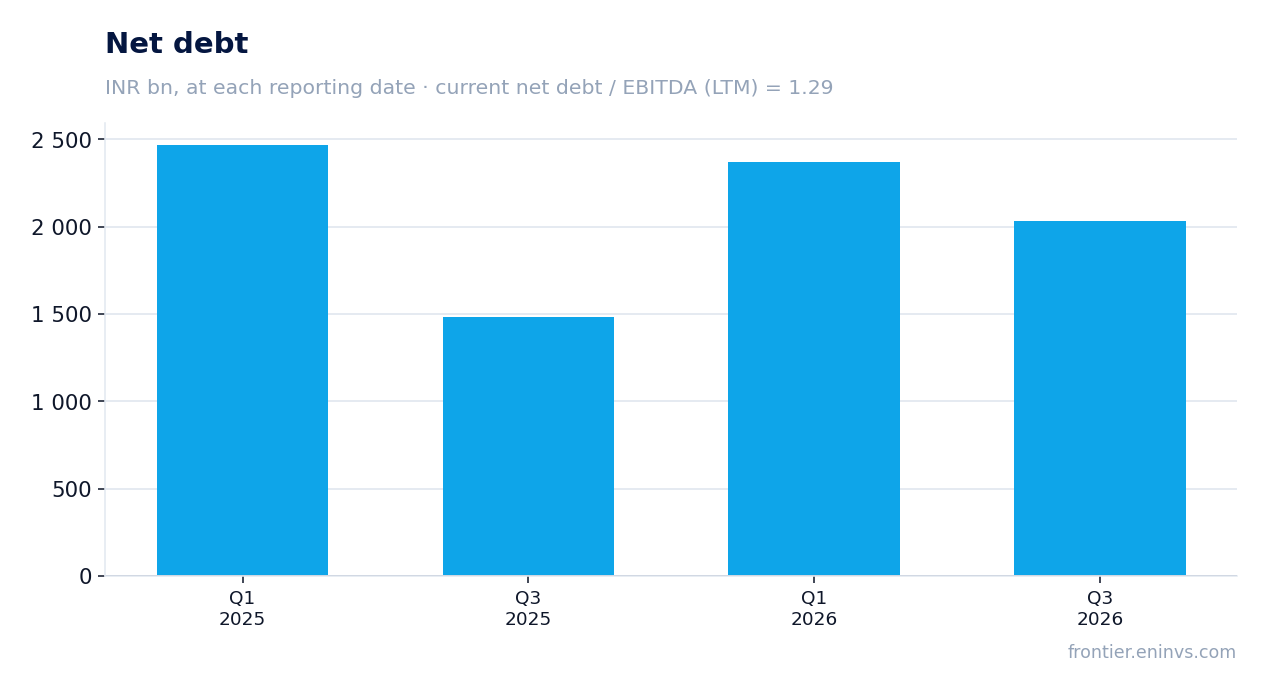
Leverage at 1.29 LTM EBITDA is moderate, but over 12 months net debt rose from INR 1,479.6 bn to INR 2,032.3 bn
Net debt at 30 September 2026 was INR 2,032.3 bn, equal to 1.29 LTM EBITDA. That is a moderate level: the company services its debt without strain, and there is headroom on leverage.
Over 12 months, however, net debt rose from INR 1,479.6 bn to INR 2,032.3 bn, an increase of INR 552.7 bn. Since the start of the year, from 31 March 2026, debt has instead fallen from INR 2,370.9 bn to INR 2,032.3 bn – a decrease of INR 338.6 bn. The mixed dynamics show active debt management, but the annual trend is upward.
Rising debt against falling EBITDA is a combination to watch: if the margin does not recover, leverage will grow faster than operating profit.
Dividend yield of 0.46% is barely above zero and gives no support to the price
The trailing 12-month dividend yield is 0.46% – almost zero. At the current price the dividend is not an argument for the share and gives no support to the quotes.
Our estimate for the current year's dividend is based on the actual payment over the last 12 months and the current price; it does not assume higher payouts, since profit rests on items below the operating line rather than on a sustainable operating result. If profit stays at the LTM level of INR 821.1 bn, the payout will remain insignificant relative to the market cap.
A yield of 0.46% is not comparable with the key rate and does not compensate for the risk of a falling margin. For a holder the dividend here is not a source of income but a symbolic payment.
EV/EBITDA of 12.5 matches the three-year average of 12.9, so the market values the company exactly as it is used to
EV/EBITDA for the last 12 months is 12.5, matching the three-year average of 12.9 – a deviation of minus 3%, within 5%. The market values the company exactly as it has for the past three years, with neither premium nor discount.
P/E LTM is 21.3 and ROE is 10.1%. Return on capital is modest for such a valuation: the investor pays 21 times earnings for a 10% return on capital. This does not create a margin of safety, but it does not look overheated either.
The portal model, based on EBITDA growth and a target multiple, points to a 44% downside to fair value. This is our own estimate, and it indicates that the current market cap is not justified by operating dynamics.
The portal model points to a 44% downside to fair value – EBITDA growth does not justify the current market cap
On the portal model, the fair value of the share is 44% below the current market price. The model accounts for EBITDA growth and a target multiple, and with falling EBITDA even a moderate multiple does not justify the market cap of INR 17,452.9 bn.
This is not a consensus or a target price but our own estimate. It is consistent with margin dynamics: if EBITDA keeps falling, the gap between price and value will only widen. For a holder this is an argument for caution, not a signal to act.
Valuation on the latest reported figures
| Metric | Value |
|---|---|
| Market cap | 17 453 bn INR |
| P/E (LTM) | 21.3 |
| EV/EBITDA (LTM) | 12.5 |
| P/B | 1.93 |
| Net debt / EBITDA (LTM) | 1.29 |
| ROE | 10.1% |
| Dividend yield (12m) | 0.5% |
| EV/EBITDA, 3-year average | 12.9 |
Bottom line
The strong side of the report remains revenue: growth of 29.8% year on year and an acceleration from 27.0% a quarter earlier. But EBITDA fell 28.1%, the margin compressed to 14.2% from 25.7%, and profit growth of 40.6% is not backed by operating dynamics. Leverage at 1.29 LTM EBITDA is moderate, yet over 12 months net debt rose from INR 1,479.6 bn to INR 2,032.3 bn. A dividend yield of 0.46% gives no support, and EV/EBITDA of 12.5 matches the three-year average of 12.9. The verdict is neutral: the share is valued as it historically has been, but a falling margin and a weak dividend give no reason for optimism.
Open the company's financial profile RELIANCE →
See also: market overview · valuation map · stock screeners