Tata Consultancy Services: profit up 15% but revenue growth decelerated to 11.2%

Tata Consultancy Services reported results for the quarter ended 30 September 2026. Revenue was 731,880 million rupees, EBITDA — 201,520 million rupees, net profit — 138,840 million rupees. Year-on-year revenue growth decelerated to 11.2% from 13.9% in the prior quarter, while the EBITDA margin improved to 27.5% and the net margin to 19.0%. The share looks attractive: the EV/EBITDA multiple of 12.3 is below its own three-year average of 17.5, leverage is minimal, and a dividend yield of 4.4% supports the valuation.
Key takeaways
— Revenue grew 11.2% year on year but the pace decelerated from 13.9% a quarter earlier
— The EBITDA margin rose to 27.5%, the net margin to 19.0%
— Net profit added 15.0% year on year to 138,840 million rupees
— Leverage remains minimal: net debt of 67,020 million rupees, or 0.09 LTM EBITDA
— Free cash flow for the quarter was 121,580 million rupees on capital expenditure of 14,720 million rupees
— A dividend yield of 4.4% supports the valuation at a P/E of 17.7
— EV/EBITDA of 12.3 is 30% below its own three-year average of 17.5
Attractiveness
Key figures, INR bn
| Metric | Q3 2025 | Q3 2026 | Change |
|---|---|---|---|
| Revenue | 658 | 732 | +11.2% |
| EBITDA | 180 | 202 | +12.1% |
| Operating profit | 166 | 176 | +5.9% |
| Net profit | 121 | 139 | +15.0% |
| Operating cash flow | 130 | 136 | +4.6% |
| Capex | 16.3 | 14.7 | -9.8% |
| EBITDA margin | 27.3% | 27.5% | +0.2 pp |
| Net margin | 18.4% | 19.0% | +0.6 pp |
Revenue grew 11.2% year on year but the pace decelerated from 13.9% a quarter earlier
Revenue for the quarter ended 30 September 2026 was 731,880 million rupees, 11.2% more than a year earlier. A quarter earlier growth was 13.9%, so the dynamics decelerated. The slowdown is also visible against the start of the year: in the first quarter of 2026 revenue grew 13.9%, in the second — 11.2%.
The absolute level of revenue is still a record for the company: 731,880 million rupees against 657,990 million rupees a year earlier. A slower pace does not mean a decline — the company continues to grow, but more slowly than in previous quarters.
The reason for the deceleration is not disclosed in the provided materials. One can only note that growth remains double-digit, and its sustainability will be determined by the next report.
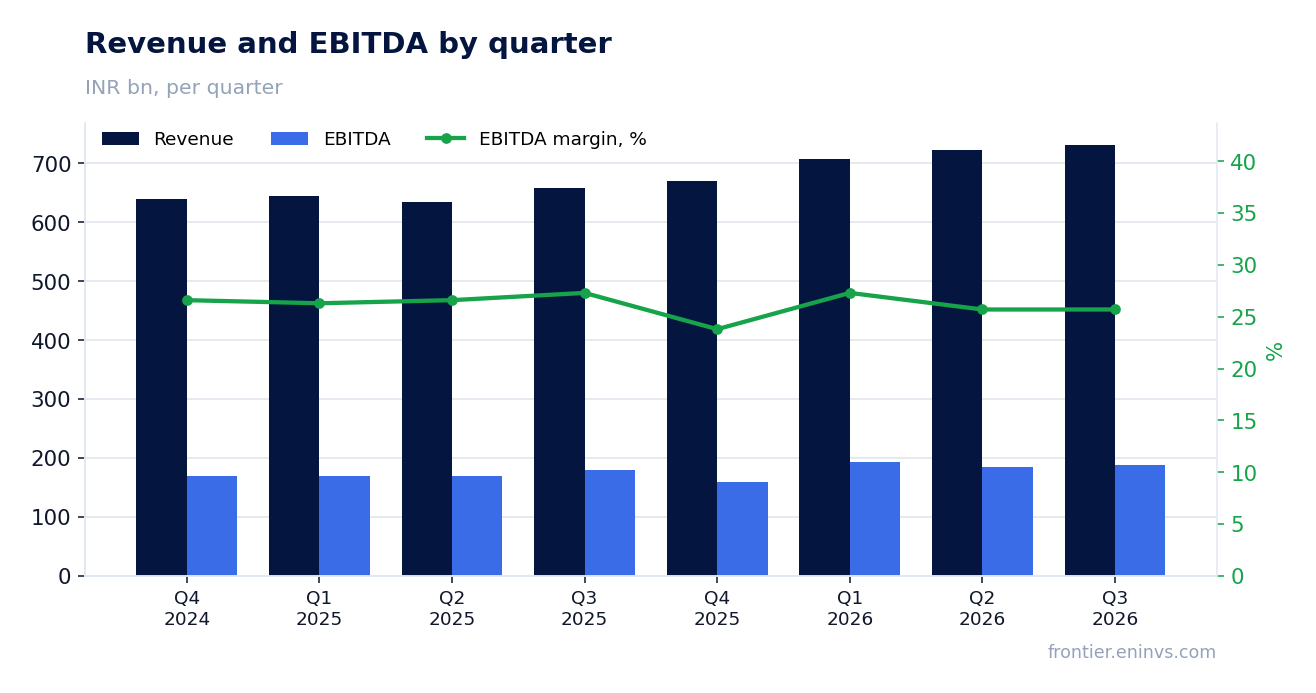
The EBITDA margin rose to 27.5%, the net margin to 19.0%
EBITDA for the quarter was 201,520 million rupees, the EBITDA margin — 27.5% against 27.3% a year earlier. A 0.2 percentage point margin increase amid decelerating revenue means the company kept costs under control.
Net profit reached 138,840 million rupees, the net margin — 19.0% against 18.4% a year earlier. Net profit growing faster than revenue (15.0% vs 11.2%) is partly explained by margin improvement, partly by the base effect.
The margin improvement of 0.2 pp on EBITDA and 0.6 pp on net profit is small but steady. It shows the company can maintain profitability even as growth decelerates.
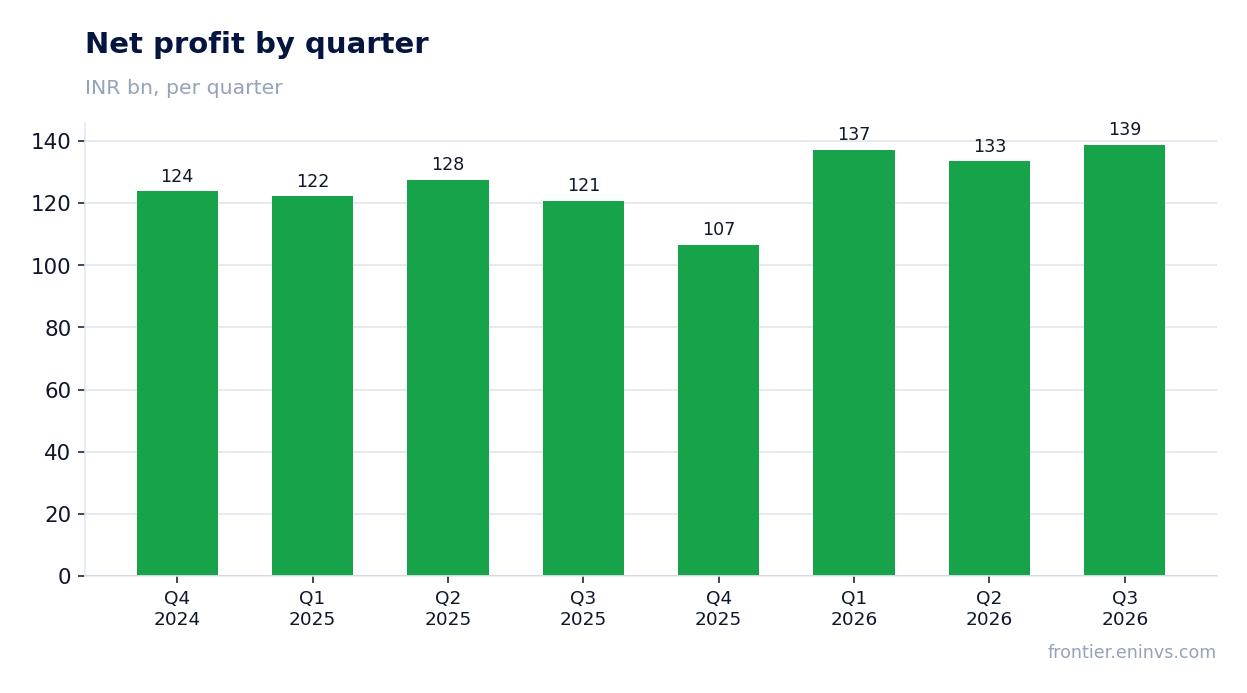
Net profit added 15.0% year on year to 138,840 million rupees
Net profit for the quarter ended 30 September 2026 was 138,840 million rupees, 15.0% more than a year earlier. Profit growth outpaces revenue growth by 3.8 percentage points.
The outperformance is mainly due to the net margin improving to 19.0% from 18.4%. The provided materials do not identify any one-off items in profit, so the growth looks organic.
For a holder, this gap matters: the company earns more from each rupee of revenue, and profit grows faster than turnover.
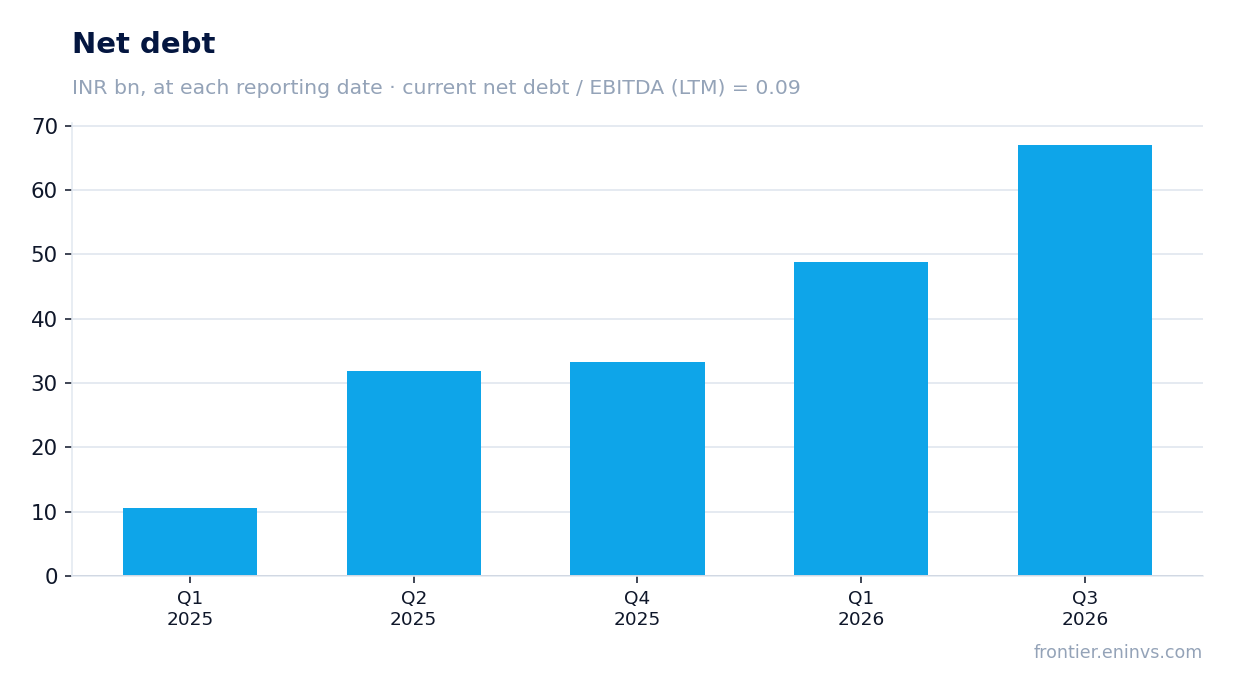
Leverage remains minimal: net debt of 67,020 million rupees, or 0.09 LTM EBITDA
Net debt as of 30 September 2026 was 67,020 million rupees, corresponding to 0.09 LTM EBITDA. This is a level at which debt has virtually no impact on the company's valuation.
From 31 March 2026 net debt rose from 48,780 million rupees to 67,020 million rupees (+18,240 million rupees). Over 12 months, from 30 June 2025, it increased from 31,780 million rupees to 67,020 million rupees (+35,240 million rupees).
The rise in absolute debt from such a low base creates no risk: the net debt to EBITDA ratio of 0.09 remains insignificant. The direction of the ratio's change is not disclosed in the materials, so we limit ourselves to the level.
Free cash flow for the quarter was 121,580 million rupees on capital expenditure of 14,720 million rupees
Operating cash flow for the quarter ended 30 September 2026 was 136,300 million rupees. Capital expenditure — 14,720 million rupees, so free cash flow reached 121,580 million rupees.
Free cash flow covers the quarter's net profit of 138,840 million rupees by 88%. The company converts profit into cash almost fully, which with low debt provides room for dividends.
Over the last 12 months operating cash flow was 529,510 million rupees — a stable base for shareholder payouts.
A dividend yield of 4.4% supports the valuation at a P/E of 17.7
The trailing 12-month dividend yield is 4.4%. With a P/E of 17.7 and trailing 12-month net profit of 516,080 million rupees, the dividend base looks stable.
The company pays dividends out of growing profit: net profit added 15.0% in the quarter. Free cash flow of 121,580 million rupees for the quarter covers the payouts.
A yield of 4.4% with low leverage and stable cash flow is a strong argument for the share. The risk of lower payouts is linked primarily to the revenue growth slowdown, should it continue.
EV/EBITDA of 12.3 is 30% below its own three-year average of 17.5
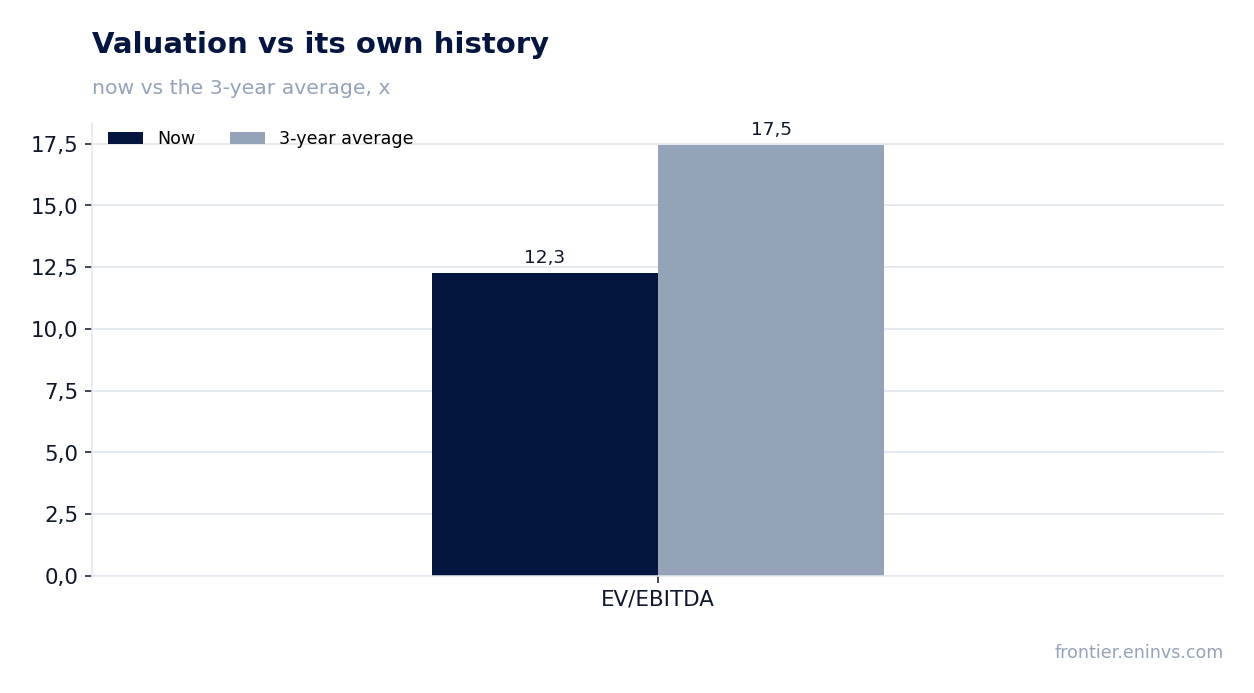
The trailing 12-month EV/EBITDA multiple is 12.3 against its own three-year average of 17.5. The share trades 30% below its historical valuation on this multiple.
The trailing 12-month P/E is 17.7. With an ROE of 48.3% and a dividend yield of 4.4%, the current valuation looks modest relative to the quality of the business.
On the portal's model, the upside of the share to fair value is estimated at +4%. This is our own model's estimate, not a market consensus.
Valuation on the latest reported figures
| Metric | Value |
|---|---|
| Market cap | 9 154 bn INR |
| P/E (LTM) | 17.7 |
| EV/EBITDA (LTM) | 12.3 |
| P/B | 8.54 |
| Net debt / EBITDA (LTM) | 0.09 |
| Operating cash flow (LTM) | 530 bn |
| ROE | 48.3% |
| Dividend yield (12m) | 4.4% |
| EV/EBITDA, 3-year average | 17.5 |
Bottom line
The strong point of the report was profit growth of 15.0% on revenue up 11.2%: the company improved its net margin to 19.0% and held the EBITDA margin at 27.5%. Free cash flow of 121,580 million rupees almost fully covers profit, and net debt at 0.09 EBITDA creates no risk. The question for a holder is the revenue slowdown: if the growth rate continues to decline, profit and the dividend will come under pressure. The EV/EBITDA valuation of 12.3 against a three-year average of 17.5 leaves room, and the 4.4% dividend yield supports the share.
Open the company's financial profile TCS →
See also: market overview · valuation map · stock screeners