Evolution: revenue falls for a third straight quarter, yet profit and margin hold steady
On 25 August Evolution reported results for the second quarter of 2026. Revenue fell 1.2% year on year to EUR 517.8 million, EBITDA declined 1.2% to EUR 341.0 million, while net profit rose 1.3% to EUR 251.4 million. The EBITDA margin held at 65.9%, and the net margin improved to 48.6%. At 12.4 times LTM earnings and 8.9 times LTM EBITDA, the stock looks neutral: the revenue decline is offset by a stable margin and a net cash position, but there is no driver for multiple expansion.
Key takeaways
— Revenue falls for a third straight quarter, but the pace of decline is barely changing
— EBITDA slipped just 1.2%, and the margin held at 65.9%
— Net profit rose 1.3% even as operating profit fell
— The company sits on a net cash cushion of EUR 1.1 billion
— Free cash flow remains solid, but capital expenditure is creeping up
— Valuation is below its own three-year history, but above the sector average
— The portal model sees no upside: fair value is just 1% above the market
Attractiveness
Key figures, EUR bn
| Metric | Q2 2025 | Q2 2026 | Change |
|---|---|---|---|
| Revenue | 0.52 | 0.52 | -1.2% |
| EBITDA | 0.35 | 0.34 | -1.2% |
| Operating profit | 0.31 | 0.30 | -2.8% |
| Net profit | 0.25 | 0.25 | +1.3% |
| Operating cash flow | 0.23 | 0.29 | +30.0% |
| Capex | -0.03 | -0.03 | — |
| EBITDA margin | 65.9% | 65.9% | +0.0 pp |
| Net margin | 47.4% | 48.6% | +1.2 pp |
Revenue falls for a third straight quarter, but the pace of decline is barely changing
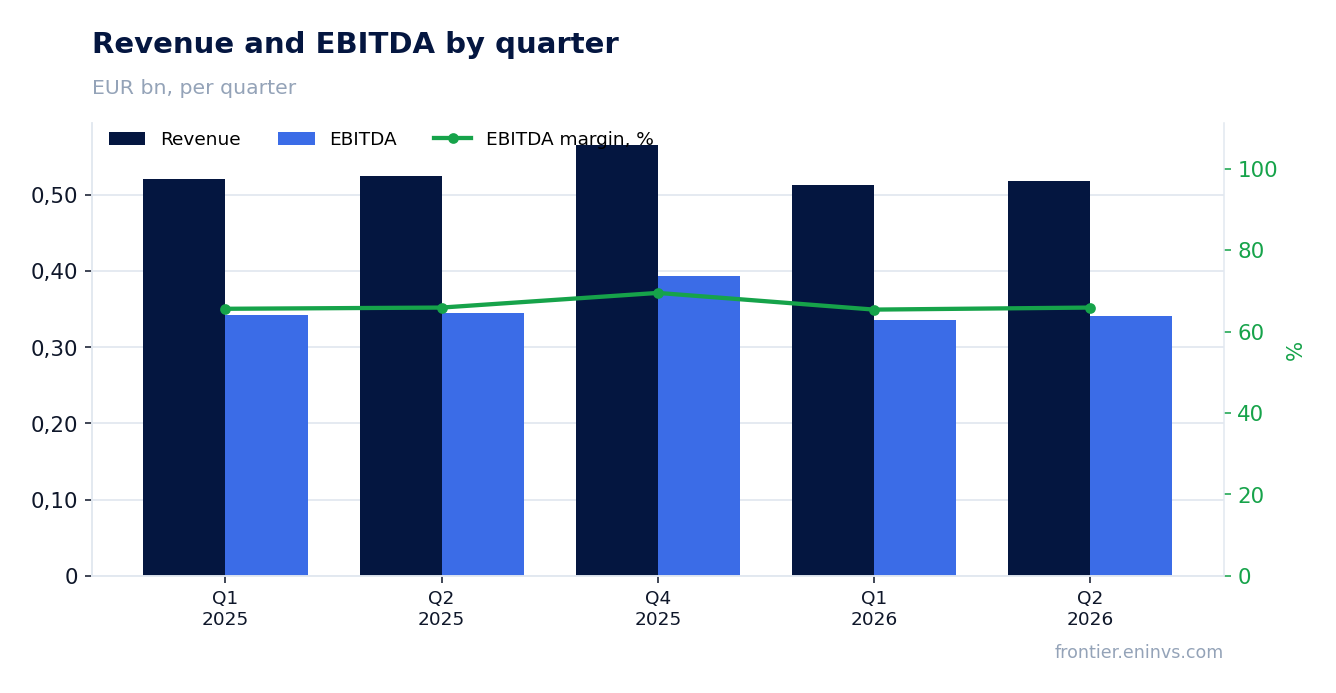
In the second quarter of 2026, revenue came in at EUR 517.8 million, down 1.2% from a year earlier. This is the third consecutive quarterly decline: in the first quarter the drop was 1.5%, and the fourth quarter of 2025 was also negative. The pace of decline is roughly the same as in the first quarter, meaning the company has not yet broken out of this trend.
The main reason is the high base effect from last year, when revenue reached EUR 524.3 million in the second quarter of 2025. Since then, quarterly revenue has fluctuated in a narrow range of EUR 513–518 million. This suggests the business has stabilised at a new level, but there are no visible drivers for a return to growth.
EBITDA slipped just 1.2%, and the margin held at 65.9%
EBITDA in the second quarter of 2026 was EUR 341.0 million, down 1.2% year on year. This exactly matches the revenue dynamics, so the EBITDA margin remained at 65.9%, the same as a year earlier. The company lost no margin points despite the revenue decline.
Such margin resilience points to tight cost control. Operating profit fell 2.8% to EUR 297.8 million, but that decline is smaller than one might expect given the revenue drop. It appears the company is cutting variable costs or benefiting from its cost structure.
Net profit rose 1.3% even as operating profit fell
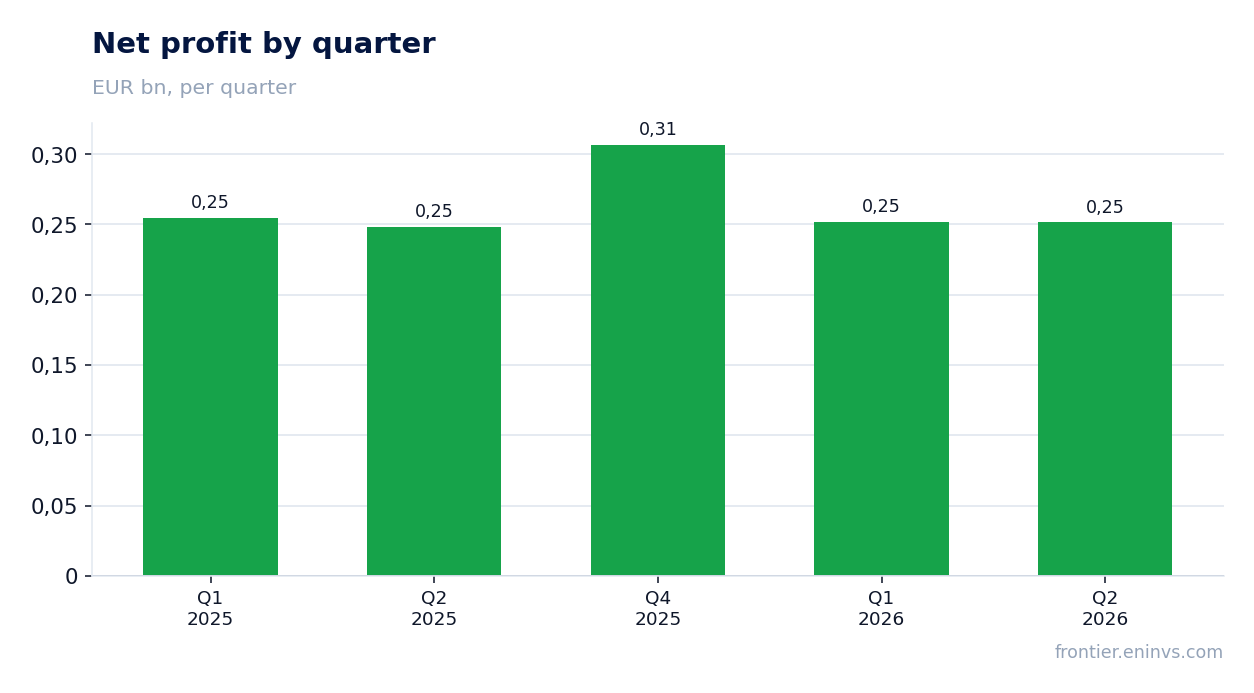
Net profit in the second quarter of 2026 was EUR 251.4 million, up 1.3% from a year earlier. This came despite a 2.8% decline in operating profit to EUR 297.8 million. The difference is explained by changes in items below the operating line – likely lower interest expenses or a reduced tax burden.
The net margin rose to 48.6% from 47.4% a year earlier. This is the highest level in several quarters. However, profit growth against falling revenue suggests the improvement is more financial than operational.
The company sits on a net cash cushion of EUR 1.1 billion
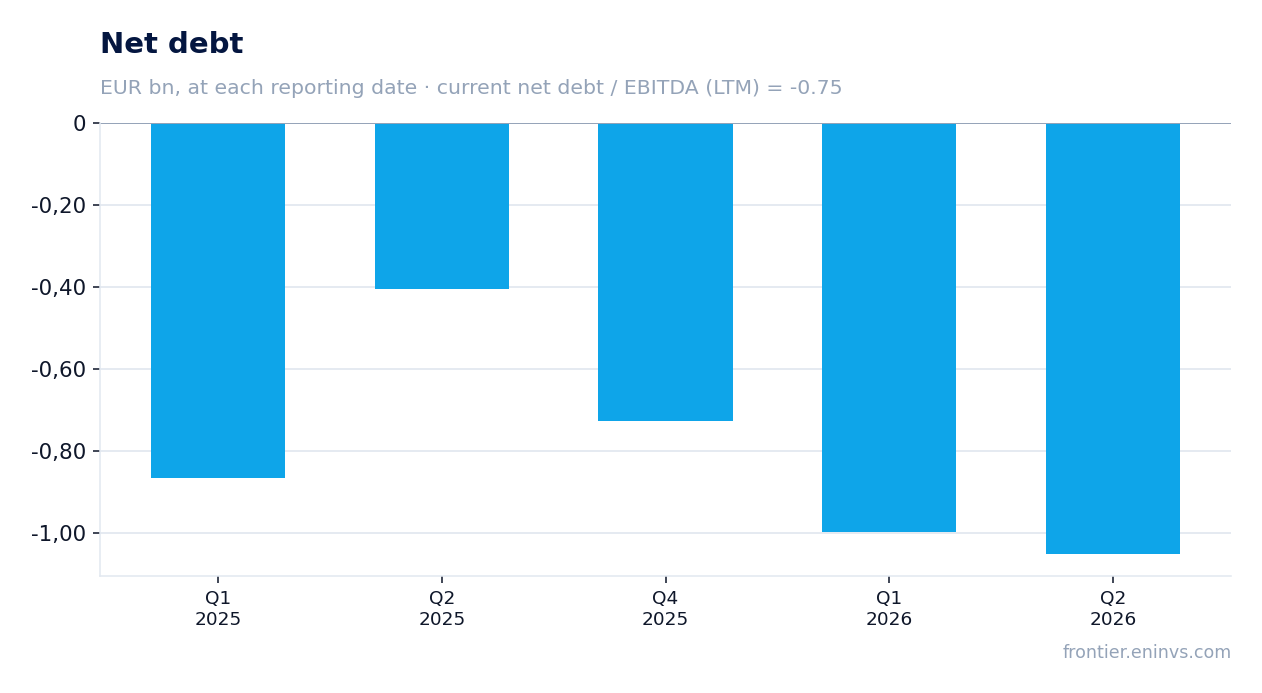
Net debt as of 30 June 2026 stood at minus EUR 1.1 billion, meaning the company has a net cash position. It increased by EUR 0.1 billion over the quarter: from minus EUR 1.0 billion on 31 March 2026 to minus EUR 1.1 billion on 30 June. Over the year, the cushion grew by EUR 0.6 billion – from minus EUR 0.4 billion on 30 June 2025.
The net debt to LTM EBITDA ratio is minus 0.75. This is a very comfortable level, giving the company room to fund investments and dividends without borrowing. However, the direction of change in this ratio is not given in the FACTS, so its dynamics cannot be discussed.
Free cash flow remains solid, but capital expenditure is creeping up
Operating cash flow in the second quarter of 2026 was EUR 293.0 million, up 30% from EUR 225.3 million a year earlier. This is a strong result, significantly exceeding net profit. Capital expenditure rose to EUR 34.7 million from EUR 33.0 million a year earlier. Free cash flow therefore amounted to about EUR 258 million.
The rise in operating cash flow against falling revenue points to better working capital management. The company is collecting cash faster than it spends. This confirms its ability to generate cash even amid stagnant revenue.
Valuation is below its own three-year history, but above the sector average
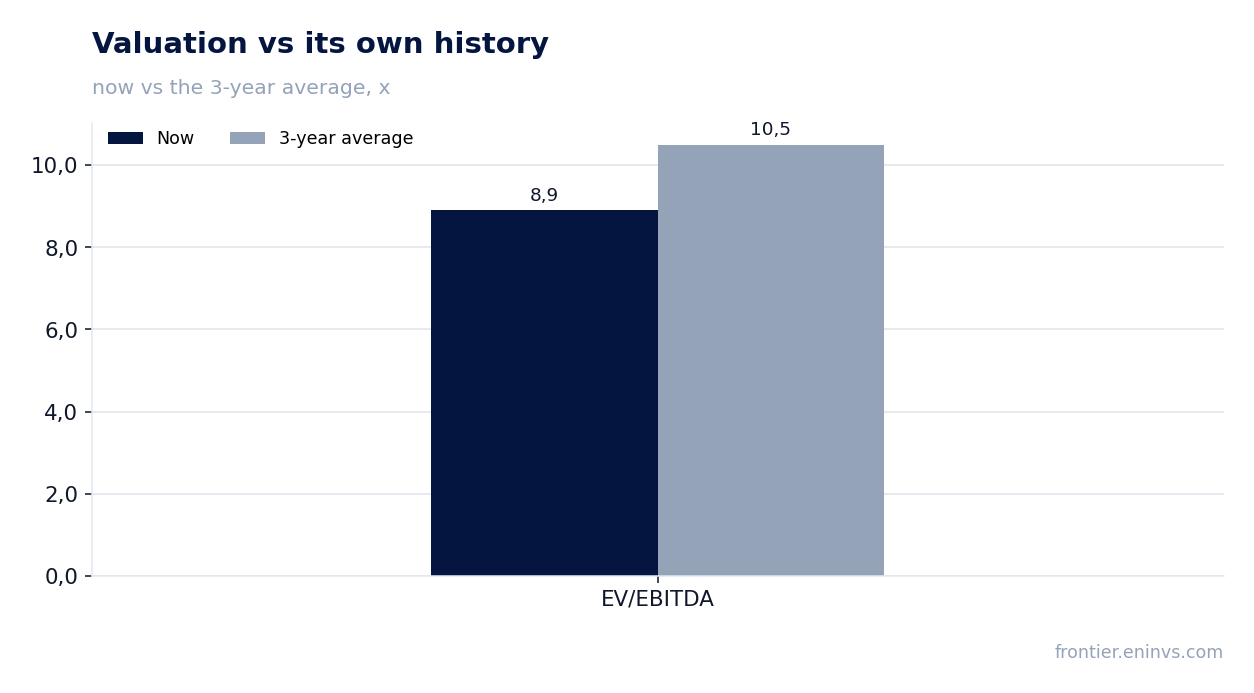
The LTM EV/EBITDA multiple is 8.9. The three-year average for this multiple is 10.5. So the stock is currently trading below its historical norm. This could indicate undervaluation if the company returns to growth, or that the market is pricing in further deceleration.
The LTM P/E ratio is 12.4. With a return on equity of 23.6%, this does not look expensive. However, for a company with falling revenue, even this multiple may not offer upside without a turnaround.
The portal model sees no upside: fair value is just 1% above the market
According to the portal model, which compares EBITDA growth with a target multiple and market capitalisation, the fair value of the share is only 1% above the current price. This means the market is already pricing in the current growth and margin trends.
For meaningful upside, the company needs either to resume revenue growth or to substantially improve its margin. Neither is currently evident. The portal model is our own tool and is not a consensus forecast.
Valuation on the latest reported figures
| Metric | Value |
|---|---|
| Market cap | 13.2 bn EUR |
| P/E (LTM) | 12.4 |
| EV/EBITDA (LTM) | 8.9 |
| P/B | 3.23 |
| Net debt / EBITDA (LTM) | -0.75 |
| Operating cash flow (LTM) | 1.32 bn |
| ROE | 23.6% |
| EV/EBITDA, 3-year average | 10.5 |
Bottom line
Evolution remains a highly profitable business with a net cash position of EUR 1.1 billion and strong operating cash flow. However, revenue has been falling for three consecutive quarters, and the pace of decline is not slowing. Net profit grew only due to items below the operating line, not from core operations. The valuation is below its own three-year history, but the portal model sees no upside. A change in verdict would require either a turnaround in revenue or a more aggressive dividend policy.
Open the company's financial profile EVO →
See also: market overview · valuation map · stock screeners