Evolution: revenue accelerated to +3.7%, but margin and profit slipped back
On 25 November Evolution reported results for the third quarter of 2026. Revenue came in at EUR 526.1 million, up 3.7% year on year after a 1.2% decline a quarter earlier; EBITDA was EUR 333.8 million (down 0.9%) and net profit EUR 243.3 million (down 3.6%). Top-line growth resumed, but the EBITDA margin fell from 66.4% to 63.5% and the net margin from 49.8% to 46.2%. At an EV/EBITDA of 8.2 against its own three-year average of 9.7 and a portal-model upside of +6%, the share looks rather attractive, though the weakness in margin and profit keeps the rating from going higher.
Key takeaways
— Revenue accelerated to +3.7% year on year after -1.2% a quarter earlier
— EBITDA fell 0.9% despite revenue growth, and the margin dropped from 66.4% to 63.5%
— Net profit declined 3.6%, and its margin from 49.8% to 46.2%
— Operating cash flow of EUR 366.1 million exceeded quarterly EBITDA
— Net debt remains negative, and the ratio to LTM EBITDA is -0.5
— EV/EBITDA of 8.2 is 15% below its own three-year average of 9.7
— The portal model implies +6% upside to fair value
Attractiveness
Key figures, EUR bn
| Metric | Q3 2025 | Q3 2026 | Change |
|---|---|---|---|
| Revenue | 0.51 | 0.53 | +3.7% |
| EBITDA | 0.34 | 0.33 | -0.9% |
| Operating profit | 0.30 | 0.29 | -2.1% |
| Net profit | 0.25 | 0.24 | -3.6% |
| Operating cash flow | 0.37 | 0.37 | -1.6% |
| EBITDA margin | 66.4% | 63.5% | -2.9 pp |
| Net margin | 49.8% | 46.2% | -3.6 pp |
Revenue accelerated to +3.7% year on year after -1.2% a quarter earlier
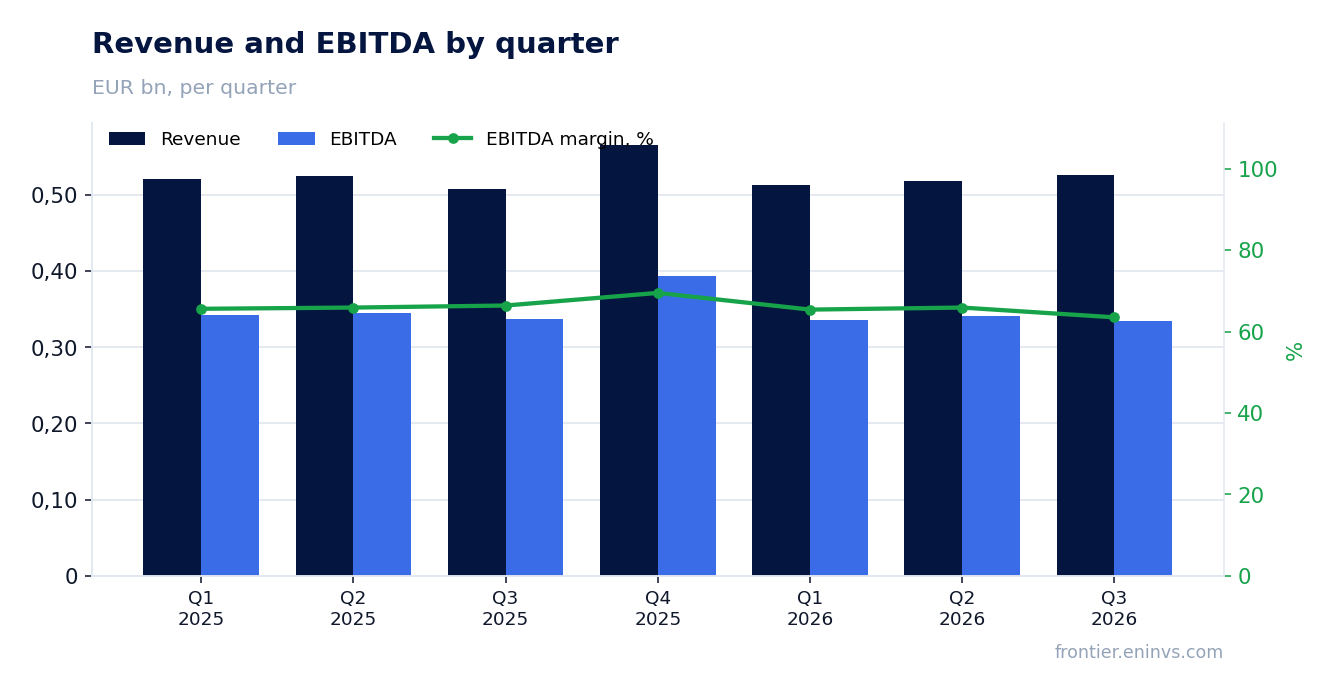
In the third quarter of 2026 revenue reached EUR 526.1 million, up 3.7% year on year. A quarter earlier the dynamics were negative at -1.2%, and in the first quarter at -1.5%. Growth has therefore resumed and accelerated relative to the second quarter.
The quarterly sequence shows the decline was short-lived: after EUR 513.0 million in the first quarter and EUR 517.8 million in the second, revenue returned above EUR 520 million. For a company with a high profitability base, even such a modest revenue increase means a substantial absolute contribution to EBITDA, provided costs do not grow faster.
The acceleration in revenue is the main positive fact of the report. However, growth of 3.7% alone did not offset the margin decline, so EBITDA and profit came in lower year on year.
EBITDA fell 0.9% despite revenue growth, and the margin dropped from 66.4% to 63.5%
EBITDA for the third quarter of 2026 was EUR 333.8 million, down 0.9% year on year. With revenue up 3.7%, this means costs grew faster than income. The EBITDA margin fell from 66.4% to 63.5%, a decline of 2.9 percentage points.
Operating profit was EUR 290.3 million, also below the prior-year level. The gap between EBITDA and operating profit is small, typical of a business with a low depreciation burden. Judging by the revenue-to-EBITDA relationship, the pressure on margin came through operating costs rather than depreciation.
A 2.9 pp margin decline on revenue of EUR 526.1 million corresponds to roughly EUR 15 million of EBITDA foregone relative to maintaining last year's profitability. That is a substantial sum, which more than offset the entire absolute increase in revenue.
Net profit declined 3.6%, and its margin from 49.8% to 46.2%
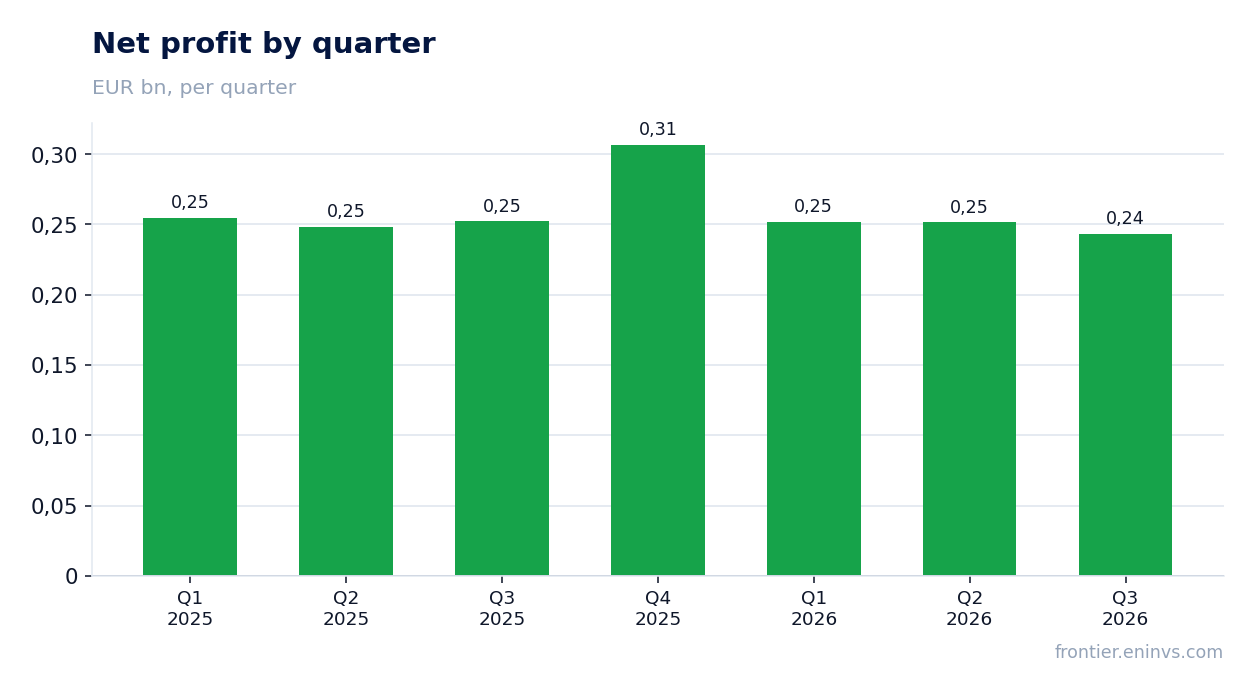
Net profit for the third quarter of 2026 was EUR 243.3 million, down 3.6% year on year. The net margin fell from 49.8% to 46.2%. The decline in profit is slightly deeper than that in EBITDA, pointing to higher below-the-line charges, likely financial or tax items.
The absolute level of profit remains very high: EUR 243.3 million per quarter is about 46 euro cents per euro of revenue. For a company that has long operated at a margin near 50%, the current level does not look anomalous, but it is below its usual level.
Over the trailing twelve months net profit was EUR 1,053.4 million. This figure is used for the LTM P/E of 12.0. The 3.6% quarterly decline does not change the picture dramatically, but it confirms that the pressure on profitability is not a one-off.
Operating cash flow of EUR 366.1 million exceeded quarterly EBITDA
Operating cash flow for the third quarter of 2026 was EUR 366.1 million, above quarterly EBITDA of EUR 333.8 million. The excess is explained by a positive working-capital change or non-cash items not disclosed in the facts. Importantly, the flow remains strong and fully covers capital expenditure needs.
Capital expenditure for the third quarter is not disclosed, but in the first and second quarters it was EUR 34.6 million and EUR 34.7 million respectively. On that basis, free cash flow for the quarter exceeds EUR 300 million, more than double the coverage of net debt reduction or dividend payments.
Over the trailing twelve months operating cash flow was EUR 1,301.6 million against LTM EBITDA of EUR 1,442.8 million. The ratio below one is normal for a company with a high share of non-cash charges, but the quarterly flow shows that cash generation has not suffered from the margin decline.
Net debt remains negative, and the ratio to LTM EBITDA is -0.5
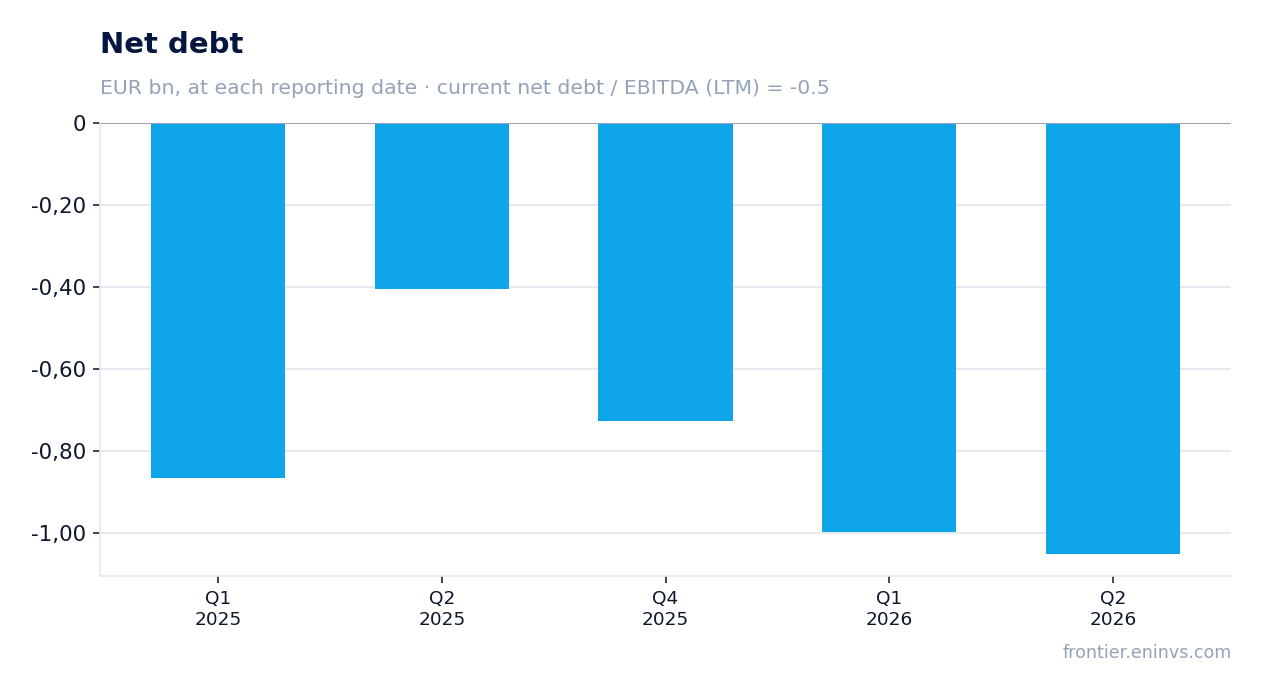
Net debt at the latest balance-sheet date is minus EUR 726.9 million, meaning the company has a net cash position. The ratio of net debt to LTM EBITDA is -0.5. This means cash and equivalents exceed debt obligations, and the company does not depend on borrowed funding.
Negative net debt against LTM EBITDA of EUR 1,442.8 million provides a substantial cushion. Even if the cash position shrinks, the company would retain the ability to service obligations and fund investment from its own resources.
Interest on debt is not disclosed in the facts, but with a negative net position interest expense is likely small or offset by interest income. This supports net profit and explains why a 0.9% decline in EBITDA led to a 3.6% decline in profit: the below-the-line effect may be tax-related rather than debt-related.
EV/EBITDA of 8.2 is 15% below its own three-year average of 9.7
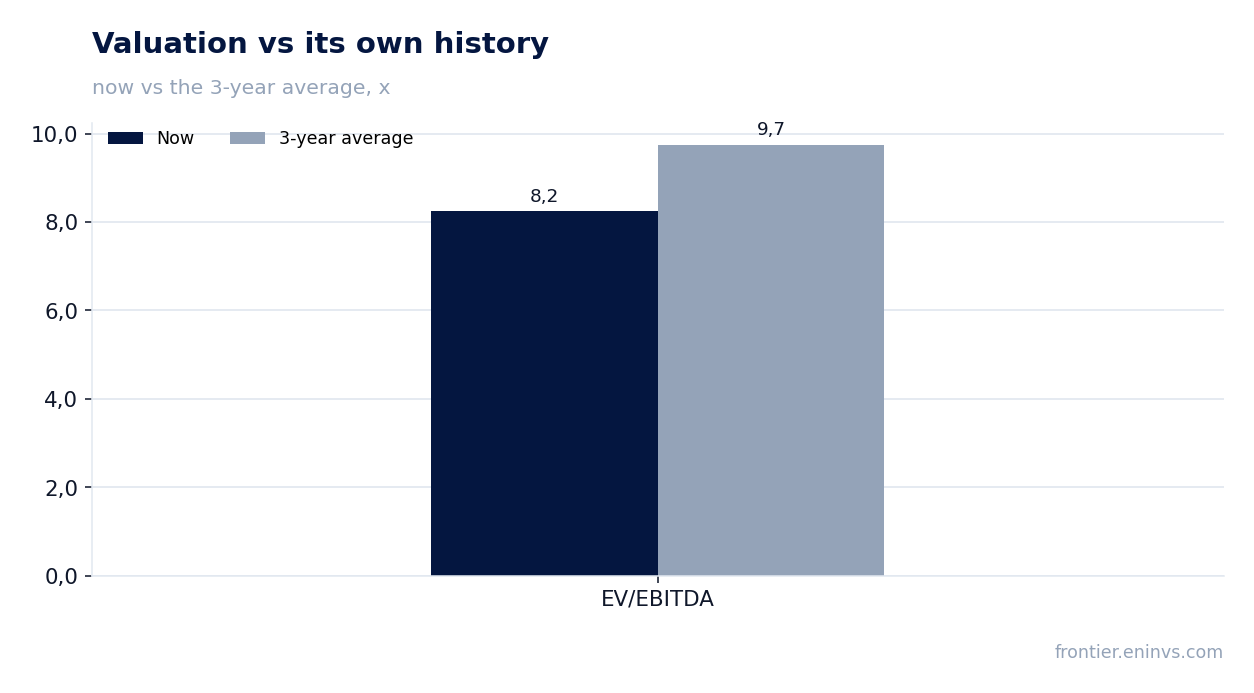
The LTM EV/EBITDA multiple is 8.2 against its own three-year average of 9.7. The share trades 15% below its historical valuation on this multiple. This means the market values current EBITDA more cheaply than it did on average over the past three years.
The LTM P/E is 12.0 on a market capitalisation of EUR 12,618.5 million. For a company with a net margin near 46% and negative net debt, that level looks low. However, the decline in margin and profit in the reported quarter may explain why the market is not willing to pay more.
The company's own three-year average is the only valid comparison base, since no sector or peer data is in the facts. On that basis the share is cheaper than usual, and this is the main argument in favour of attractiveness.
The portal model implies +6% upside to fair value
On the portal's model, which values EBITDA growth at a target multiple against market capitalisation, the upside to fair value is +6%. This is the portal's own estimate, not a market consensus or a target price.
Upside of +6% is modest but positive, and it is consistent with the conclusion that the share trades below its historical valuation. If EBITDA returns to growth and the margin stabilises, the upside could increase.
The portal-model estimate does not account for a possible further decline in margin. If pressure on profitability persists, actual fair value would be lower, and the current discount to history could prove justified.
Valuation on the latest reported figures
| Metric | Value |
|---|---|
| Market cap | 12.6 bn EUR |
| P/E (LTM) | 12.0 |
| EV/EBITDA (LTM) | 8.2 |
| P/B | 3.10 |
| Net debt / EBITDA (LTM) | -0.50 |
| Operating cash flow (LTM) | 1.30 bn |
| ROE | 8.3% |
| EV/EBITDA, 3-year average | 9.7 |
Bottom line
The strong side of the report is the resumption of revenue growth to +3.7% year on year after two quarters of decline, along with operating cash flow of EUR 366.1 million exceeding EBITDA. The weak side is the 0.9% decline in EBITDA and 3.6% decline in net profit due to margin compression. Negative net debt and an EV/EBITDA of 8.2 against a three-year average of 9.7 support the valuation. The portal model implies +6% upside. The verdict is rather attractive: the discount to its own history and the net cash position outweigh the current margin decline, but a stabilisation in profitability is needed for a higher rating.
Open the company's financial profile EVO →
See also: market overview · valuation map · stock screeners