Aeroflot: Q1 2026 loss amid EBITDA decline and rising maintenance costs
On June 19, 2026, Aeroflot reported Q1 2026 results: revenue grew 5.7% to RUB 201.1 billion, but EBITDA fell 39.6% to RUB 29.6 billion, and the company posted a net loss of RUB 11.9 billion versus a profit a year earlier. This review examines what drove the reversal, how debt changed, and what it means for shareholders.
Key takeaways
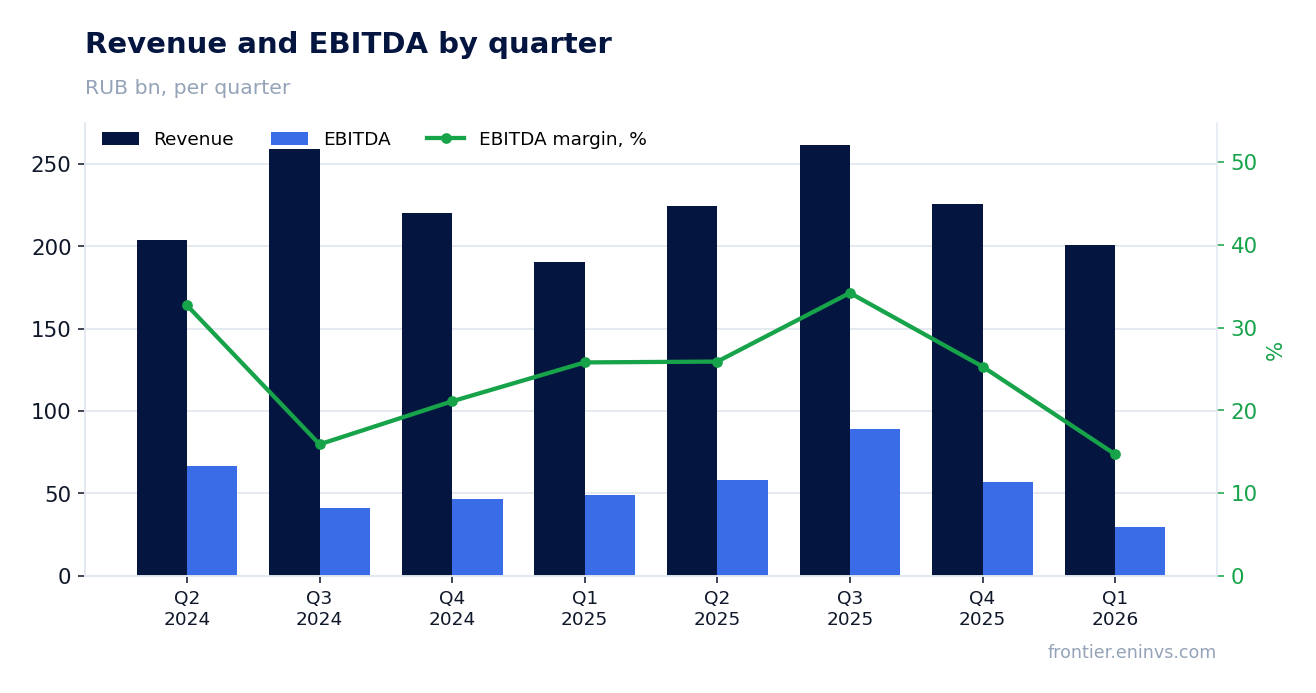
— Revenue grew 5.7%, but EBITDA plunged 39.6% due to higher maintenance and personnel costs
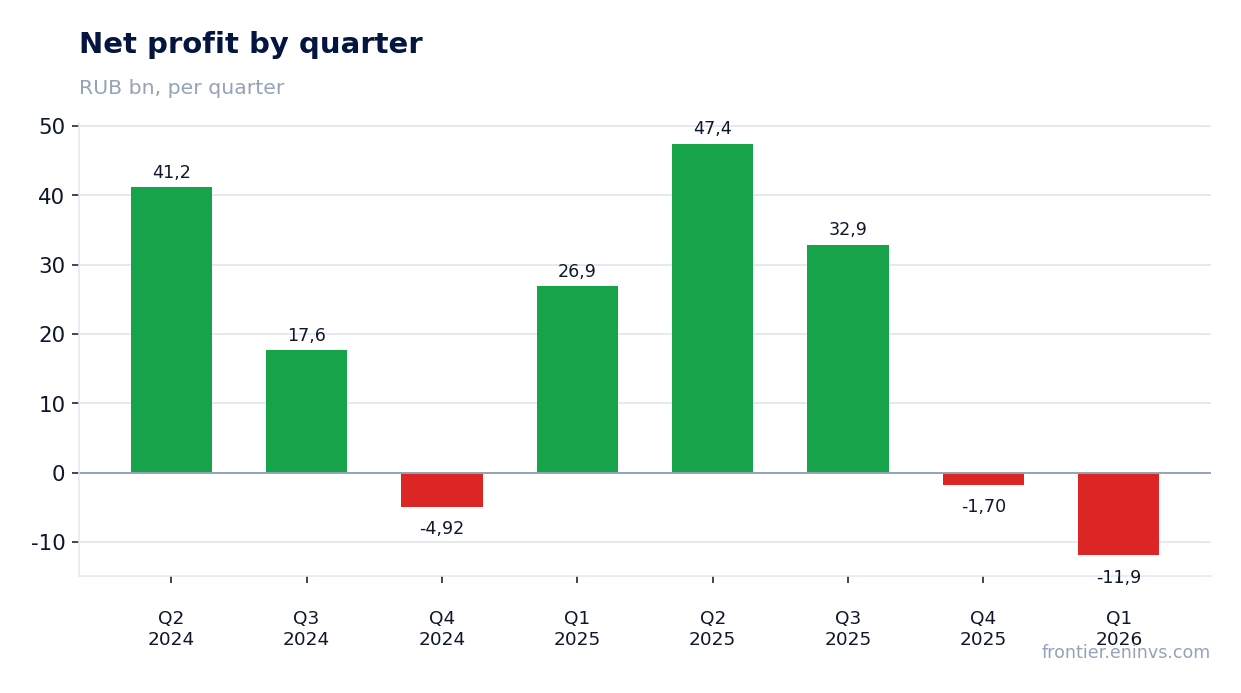
— Net loss of RUB 11.9 billion driven by finance costs and FX differences, with operating profit of just RUB 1.7 billion
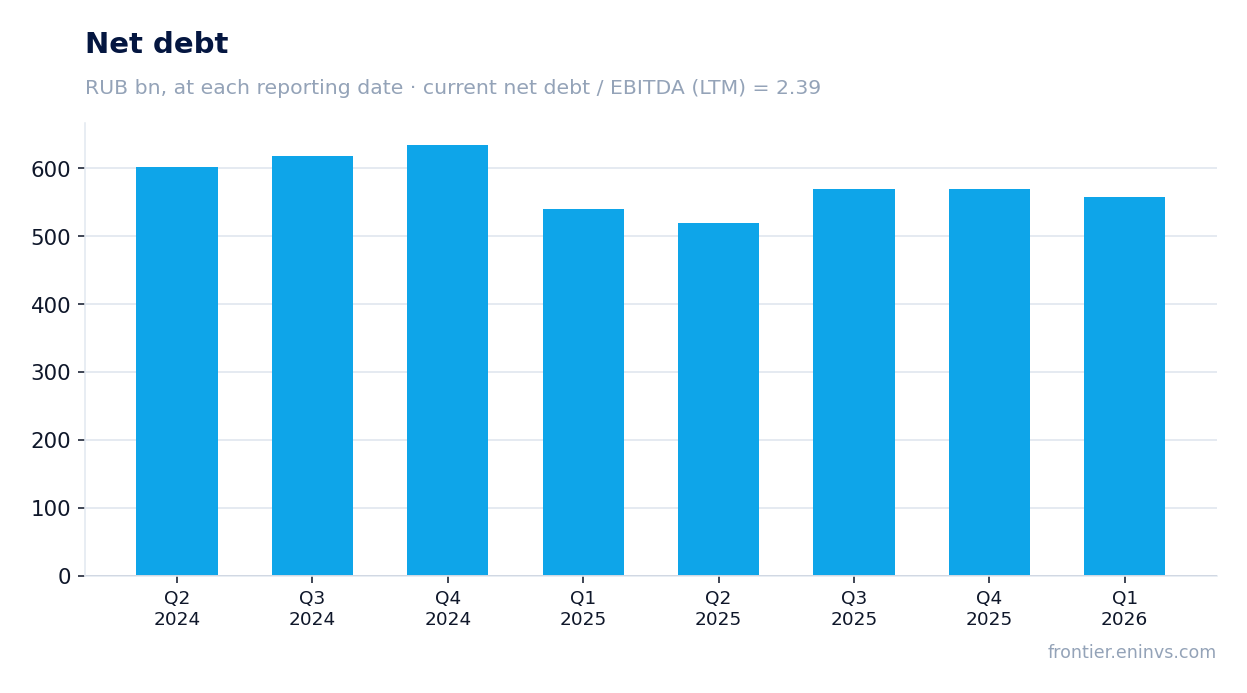
— Debt rose by RUB 6.8 billion in the quarter to RUB 557.9 billion, while operating cash flow halved
— Capex halved, but free cash flow remained positive
— Dividend yield of 17.2% looks attractive, but the payout may not be covered by earnings
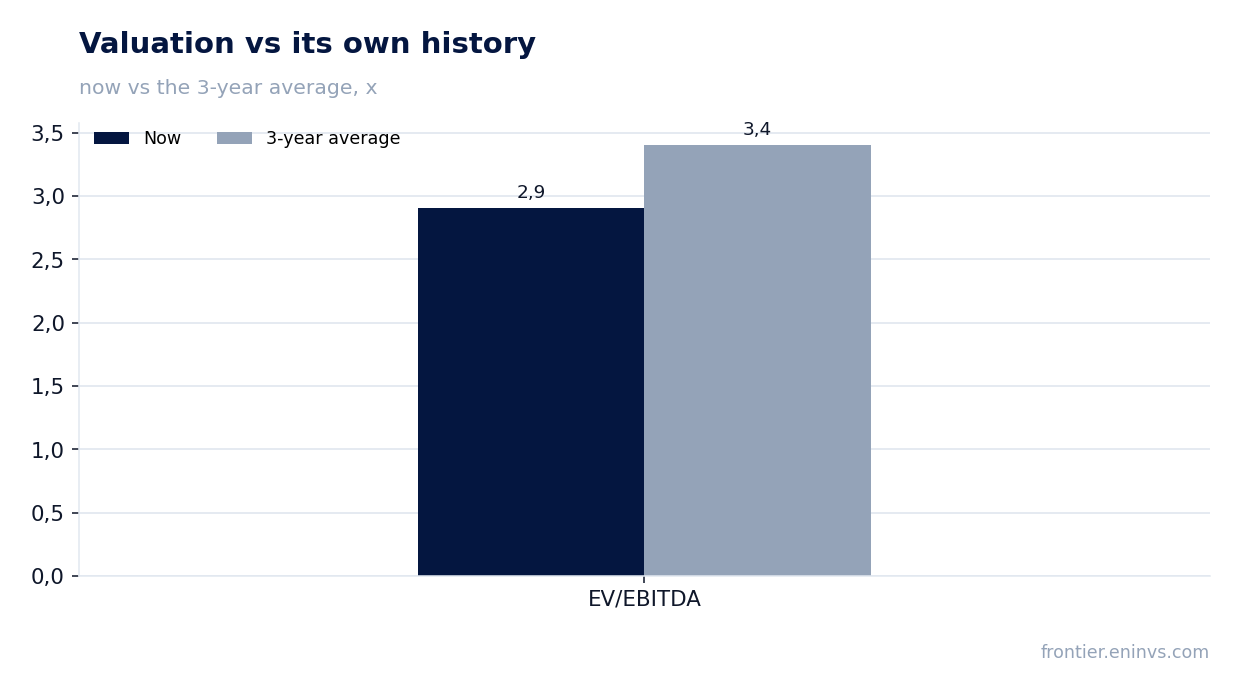
— EV/EBITDA multiple of 2.9x is below the three-year average of 3.4x
Key figures, RUB bn
| Metric | Q1 2025 | Q1 2026 | Change |
|---|---|---|---|
| Revenue | 190 | 201 | +5.7% |
| EBITDA | 49.0 | 29.6 | -39.6% |
| Operating profit | 19.1 | 1.70 | -91.1% |
| Net profit | 26.9 | -11.9 | -144.3% |
| Operating cash flow | 52.0 | 24.6 | -52.6% |
| Capex | 29.9 | 14.3 | -52.3% |
| EBITDA margin | 25.8% | 14.7% | -11.1 pp |
| Net margin | 14.1% | -5.9% | -20.0 pp |
Revenue grew 5.7%, but EBITDA plunged 39.6% due to higher maintenance and personnel costs
In Q1 2026, Aeroflot's revenue reached RUB 201.1 billion, up 5.7% year-on-year. Scheduled passenger traffic contributed the most – RUB 188.2 billion, cargo – RUB 7.0 billion, charter – RUB 1.2 billion. Revenue growth continued but slowed compared with previous quarters.
EBITDA for the reporting period fell 39.6% to RUB 29.6 billion, with margin contracting from 25.8% to 14.7%. The main reason is a sharp increase in operating expenses: aircraft maintenance costs rose 34% to RUB 17.7 billion, personnel costs – 13% to RUB 32.2 billion. Fuel costs remained almost flat at RUB 70.4 billion, but that was not enough to offset pressure from other items.
Net loss of RUB 11.9 billion driven by finance costs and FX differences, with operating profit of just RUB 1.7 billion
Operating profit in Q1 was just RUB 1.7 billion – 11 times lower than a year earlier (RUB 19.1 billion). Finance costs rose to RUB 19.5 billion, including RUB 3.3 billion of FX losses (a year earlier there was a gain of RUB 27.3 billion). As a result, net loss reached RUB 11.9 billion versus a profit of RUB 26.9 billion in Q1 2025.
Operating profit was not enough to cover finance costs. Income tax was positive – RUB 1.4 billion – thanks to deferred taxes.
Debt rose by RUB 6.8 billion in the quarter to RUB 557.9 billion, while operating cash flow halved
Net debt as of March 31, 2026 stood at RUB 557.9 billion, up RUB 6.8 billion in the quarter and RUB 29.8 billion over the last 12 months. Net debt to EBITDA for the trailing twelve months is 2.39x. The debt increase was accompanied by a decline in operating cash flow: RUB 24.6 billion in the quarter versus RUB 52.0 billion a year earlier.
The decline in operating cash flow is due to lower profitability and higher working capital. The company raised RUB 18.7 billion in new loans but repaid only RUB 1.0 billion, increasing leverage. Interest expenses rose to RUB 7.7 billion on loans and RUB 4.5 billion on leases.
Capex halved, but free cash flow remained positive
Capital expenditures in Q1 2026 were RUB 14.3 billion – almost half of the RUB 29.9 billion a year earlier. The bulk is purchases of spare parts and aircraft engines (RUB 9.8 billion and RUB 5.6 billion, respectively). Lower capex partially offset the decline in operating cash flow.
Free cash flow (operating cash flow minus capex) remained positive – RUB 10.4 billion versus RUB 22.1 billion a year earlier. This allows the company to finance current operations without additional debt, but the safety margin has narrowed.
Dividend yield of 17.2% looks attractive, but the payout may not be covered by earnings
Over the last 12 months, Aeroflot paid RUB 5.29 per share, implying a dividend yield of 17.2%. Our model estimates the next payout also at RUB 5.29 per share, while the fair yield for this stock is 7.9%. The implied payout ratio is 0.28 of profit.
However, trailing twelve-month net profit was RUB 66.7 billion, but in Q1 2026 the company posted a loss. If losses persist, maintaining the dividend at the same level may be in question. The current yield is significantly above fair, which may indicate market expectations of lower payouts.
EV/EBITDA multiple of 2.9x is below the three-year average of 3.4x
EV/EBITDA for the trailing twelve months is 2.9x – below the three-year average of 3.4x. This means the market values the company cheaper than its historical average. P/E LTM is 1.85x, reflecting high past profitability but not the current loss.
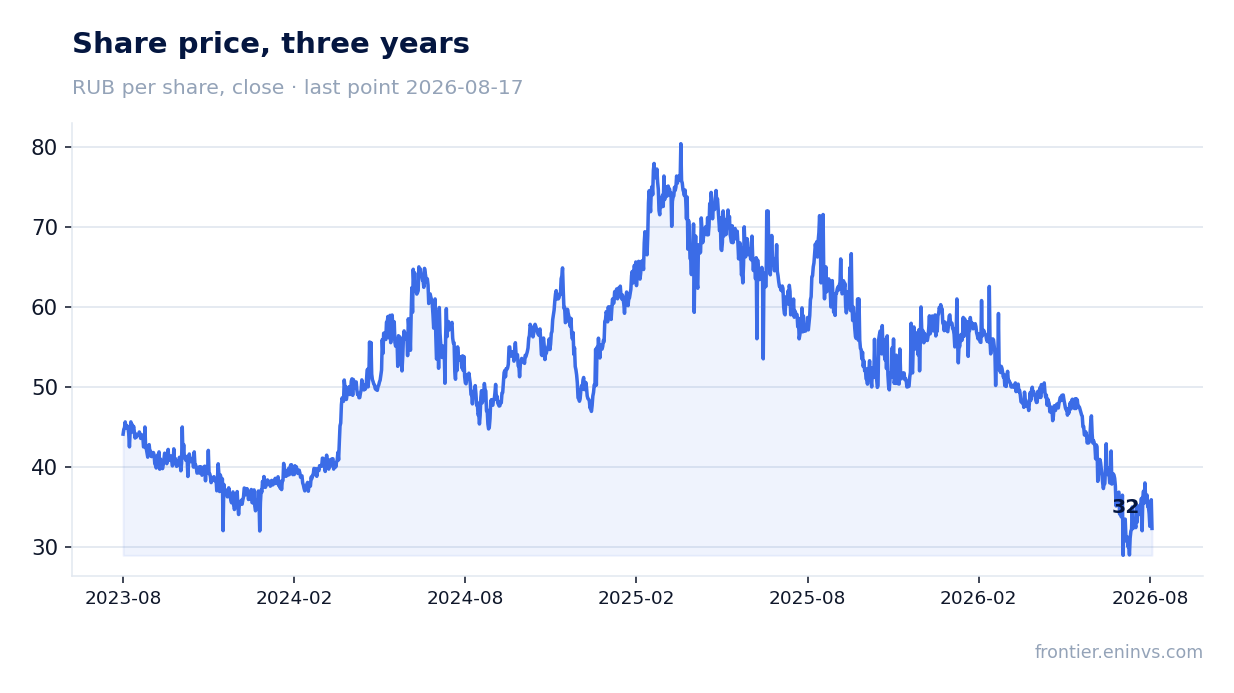
Shares fell 3.7% on the release day and 24.1% by August 17, 2026. Market capitalization is RUB 123.2 billion. The low multiple may be justified by deteriorating operating performance and dividend uncertainty.
Valuation on the latest reported figures
| Metric | Value |
|---|---|
| Market cap | 123 bn ₽ |
| P/E (LTM) | 1.8 |
| EV/EBITDA (LTM) | 2.9 |
| P/B | 2.43 |
| Net debt / EBITDA (LTM) | 2.39 |
| Operating cash flow (LTM) | 137 bn |
| ROE | -112.2% |
| Dividend yield (12m) | 10.9% |
| EV/EBITDA, 3-year average | 3.4 |
Bottom line
Q1 2026 was weak for Aeroflot: revenue grew, but EBITDA fell 39.6% on higher maintenance and personnel costs, and net profit turned negative on finance costs and FX losses. Debt increased, operating cash flow halved, but capex declined, keeping free cash flow positive. The 17.2% dividend yield looks attractive, but with a loss in the reporting period, the payout may be in question. The EV/EBITDA multiple is below its three-year average, reflecting deteriorating operating performance. The key question for shareholders is whether the company can return to profitability in Q2, when demand is traditionally high.
Open the company's financial profile AFLT →
See also: market overview · valuation map · stock screeners