Beluga: profit down 38%, but an 11.7% dividend holds the share

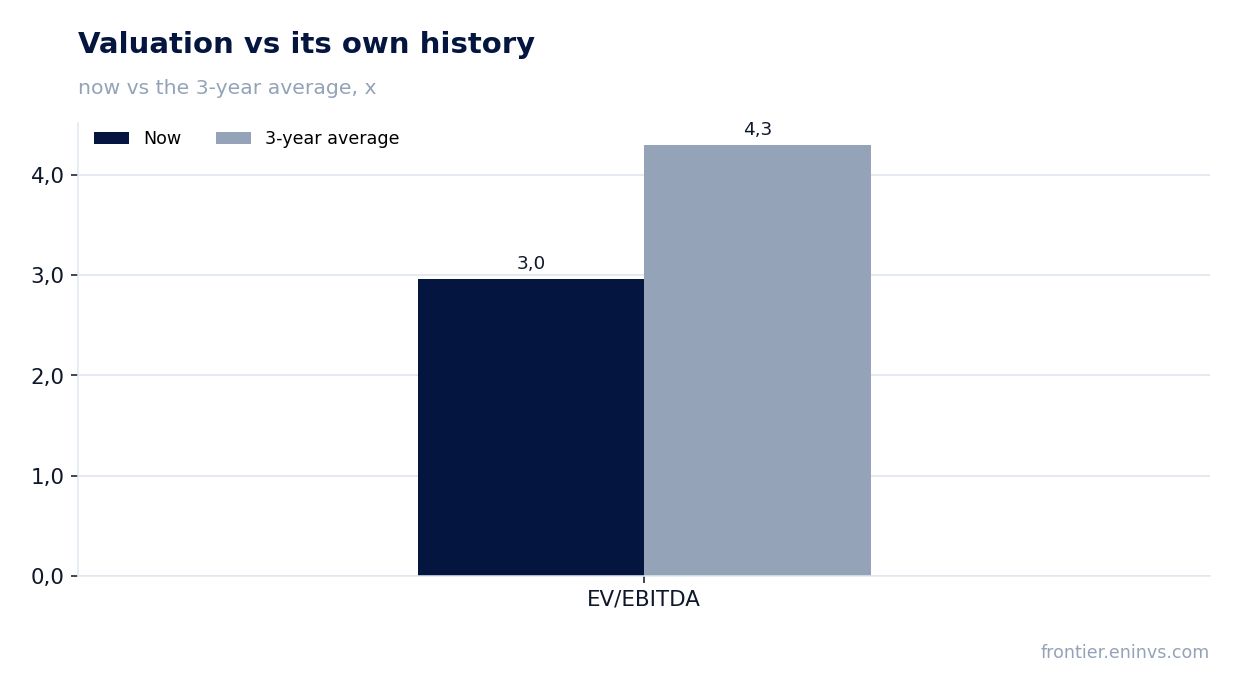
25 августа Белуга раскрыла результаты за первое полугодие 2026 года: выручка выросла на 7,6%, EBITDA – на 9,0%, а чистая прибыль упала на 38,3%. При этом компания платит дивиденды с доходностью 11,7%, что заметно выше наших ожиданий в 8,7%, и торгуется с мультипликатором EV/EBITDA 2,96 против среднего за три года 4,30. На текущей цене акция выглядит привлекательно: модель портала даёт upside 32%.
Key takeaways
— Revenue grew 7.6% in H1, but profit fell 38.3% due to one-offs
— EBITDA margin edged up to 13.5% from 13.3% a year earlier
— Net margin halved to 1.7% from 3.0%
— Leverage stands at 1.9x EBITDA, debt up RUB 4.7bn over the year
— Dividend for the last 12 months is RUB 30 per share, yield 11.7%
— The share trades at a discount to its own history: EV/EBITDA 2.96 vs 4.30 three-year average
Attractiveness
Key figures, RUB bn
| Metric | H1 2025 | H1 2026 | Change |
|---|---|---|---|
| Revenue | 69.2 | 74.4 | +7.6% |
| EBITDA | 9.22 | 10.0 | +9.0% |
| Operating profit | 5.79 | 6.32 | +9.3% |
| Net profit | 2.10 | 1.30 | -38.3% |
| Operating cash flow | 8.74 | 7.13 | -18.4% |
| Capex | 1.47 | 1.96 | +33.6% |
| EBITDA margin | 13.3% | 13.5% | +0.2 pp |
| Net margin | 3.0% | 1.7% | -1.3 pp |
Revenue grew 7.6% in H1, but profit fell 38.3% due to one-offs
In H1 2026, Beluga's revenue reached RUB 154.5bn, up 7.6% year-on-year. EBITDA grew 9.0% to RUB 21.9bn, indicating sustained operational efficiency.
However, net profit fell 38.3% to RUB 4.4bn for the half-year. The gap between EBITDA growth and profit decline points to significant one-off or non-operating items not disclosed in the available data.
For investors, this means the operating business remains stable, but bottom-line profit is subject to volatility from factors unrelated to core activities.
EBITDA margin edged up to 13.5% from 13.3% a year earlier
EBITDA margin for H1 2026 stood at 13.5% versus 13.3% in the same period last year. The improvement is modest but shows that revenue growth is accompanied by cost control.
In absolute terms, EBITDA reached RUB 21.9bn for the half-year, up 9.0% year-on-year. This provides a cushion for debt service and dividend payments.
Net margin halved to 1.7% from 3.0%
Net margin for H1 2026 fell to 1.7% from 3.0% a year earlier. On revenue of RUB 154.5bn, this yielded net profit of just RUB 4.4bn.
Such a sharp margin compression despite stable operating profit points to higher financial expenses, taxes, or losses from non-operating activities. The exact reason is not disclosed, but this pressure on profit explains the 38.3% decline.
Leverage stands at 1.9x EBITDA, debt up RUB 4.7bn over the year
As of the latest balance sheet, Beluga's net debt stood at RUB 41.6bn, corresponding to 1.9x EBITDA for the trailing twelve months. Over the year, debt increased by RUB 4.7bn – a moderate rise that does not create critical strain.
Operating cash flow for the last 12 months reached RUB 12.3bn, covering interest expenses and part of capital expenditures. The debt level remains comfortable for dividend payments.
Dividend for the last 12 months is RUB 30 per share, yield 11.7%
Over the last 12 months, Beluga paid RUB 30 per share, providing a yield of 11.7% at the current price. Our model estimates a fair yield for this name at 8.7%, meaning the share offers significantly more than we consider adequate.
The projected dividend for the next 12 months is also RUB 30 per share, implying a forward yield of 11.7%. The payout ratio is around 0.5 of profit, leaving the company resources for investment and debt repayment.
The share trades at a discount to its own history: EV/EBITDA 2.96 vs 4.30 three-year average
The current EV/EBITDA multiple is 2.96 versus the three-year average of 4.30. This means the market values the company significantly cheaper than usual, despite revenue and EBITDA growth.
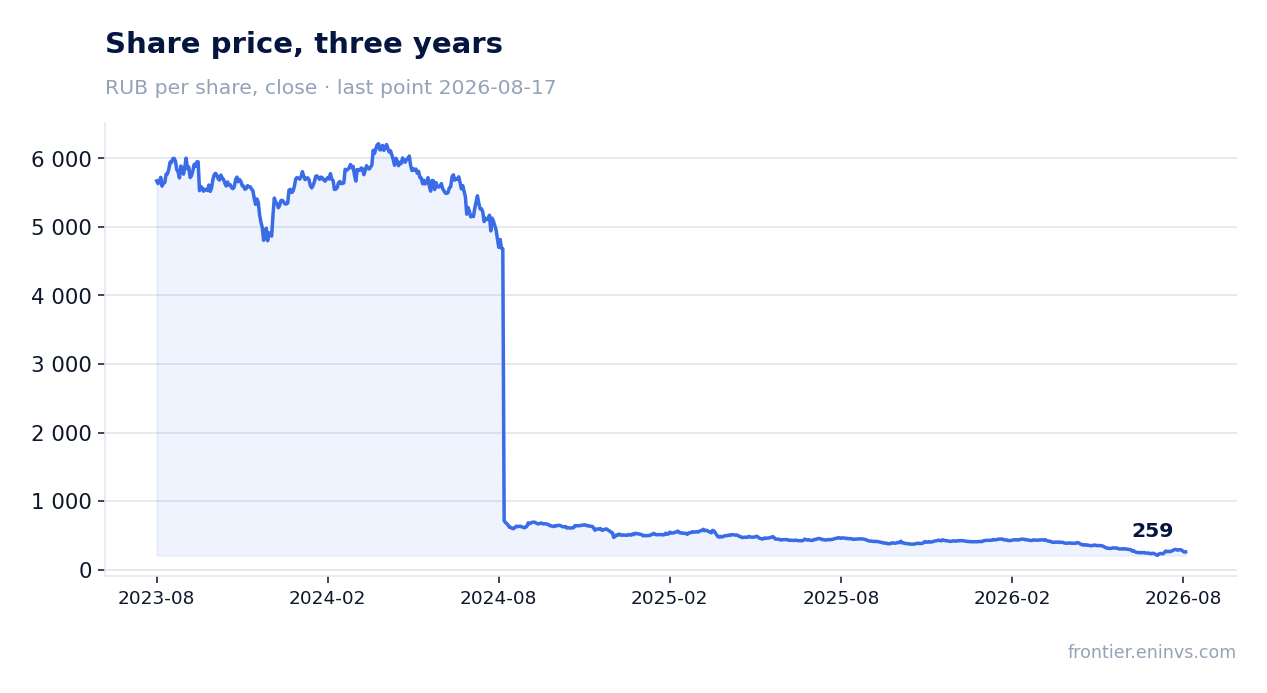
P/E for the trailing twelve months is 5.32, also indicating undervaluation. According to the portal's model, the share's upside potential is +32% – a calculation based on EBITDA growth and a target multiple.
The share is held in our strategies 'Dividend growers' and 'Growth potential', reflecting its attractiveness on fundamental criteria.
Valuation on the latest reported figures
| Metric | Value |
|---|---|
| Market cap | 23.2 bn ₽ |
| P/E (LTM) | 5.3 |
| EV/EBITDA (LTM) | 3.0 |
| P/B | 1.04 |
| Net debt / EBITDA (LTM) | 1.90 |
| Operating cash flow (LTM) | 12.3 bn |
| ROE | 11.1% |
| Dividend yield (12m) | 11.8% |
| EV/EBITDA, 3-year average | 4.3 |
Bottom line
Beluga reported H1 with revenue and EBITDA growth, but net profit fell 38.3% – the main negative in the report. However, the operating business remains stable, and the dividend yield of 11.7% significantly exceeds our fair level of 8.7%. With an EV/EBITDA multiple of 2.96 versus the three-year average of 4.30, the share looks undervalued. The portal's model implies 32% upside. The key question is the sustainability of net profit: if the decline is due to one-offs, the current price is attractive; if not, dividends are at risk.
Open the company's financial profile BELU →
See also: market overview · valuation map · stock screeners