Beluga: revenue up 7.6%, but only a third of profit reaches the dividend

On 4 November Beluga reported results for the second quarter of 2026. Revenue rose 7.6% year on year to RUB 37,195.0 mn, EBITDA by 9.0% to RUB 5,023.0 mn, while net profit fell 38.3% to RUB 648.5 mn. At a price of RUB 269.0 the share trades at 3.0x EV/EBITDA against its own three-year average of 4.3, and the dividend yield on our estimate of RUB 21.49 per share is 8.0% – the stock looks rather attractive, but weak conversion of profit into dividend and net debt at 1.92x EBITDA keep the rating in check.
Key takeaways
— Revenue grew 7.6% year on year, enough to lift EBITDA by 9.0%
— EBITDA margin rose to 13.5%, while net margin fell to 1.7% – costs below the operating line ate the profit
— Net profit fell 38.3% to RUB 648.5 mn in the quarter even as operating profit rose to RUB 3,161.0 mn
— Operating cash flow of RUB 3,565.5 mn covered capital expenditure of RUB 979.5 mn with room to spare
— Net debt rose from RUB 37.7 bn on 30 June 2025 to RUB 42.1 bn on 30 June 2026
— Our dividend estimate of RUB 21.49 per share gives an 8.0% yield – below the 9.1% we consider fair for the name
— On the portal's model the share is 10% below fair value
Attractiveness
Key figures, RUB bn
| Metric | Q2 2025 | Q2 2026 | Change |
|---|---|---|---|
| Revenue | 34.6 | 37.2 | +7.6% |
| EBITDA | 4.61 | 5.02 | +9.0% |
| Operating profit | 2.89 | 3.16 | +9.3% |
| Net profit | 1.05 | 0.65 | -38.3% |
| Operating cash flow | 4.37 | 3.57 | -18.4% |
| Capex | 0.73 | 0.98 | +33.6% |
| EBITDA margin | 13.3% | 13.5% | +0.2 pp |
| Net margin | 3.0% | 1.7% | -1.3 pp |
Revenue grew 7.6% year on year, enough to lift EBITDA by 9.0%
In the second quarter of 2026 revenue came to RUB 37,195.0 mn, 7.6% more than a year earlier. The growth is more modest than in prior reporting periods, but it is growth on a high base.
EBITDA grew faster than revenue – by 9.0% to RUB 5,023.0 mn. That means part of the cost base grew more slowly than sales, and operating leverage worked in the company's favour.
Operating profit added less, reaching RUB 3,161.0 mn. The gap between EBITDA and operating profit shows that depreciation is rising along with capital expenditure and eats part of the improvement at the EBITDA level.
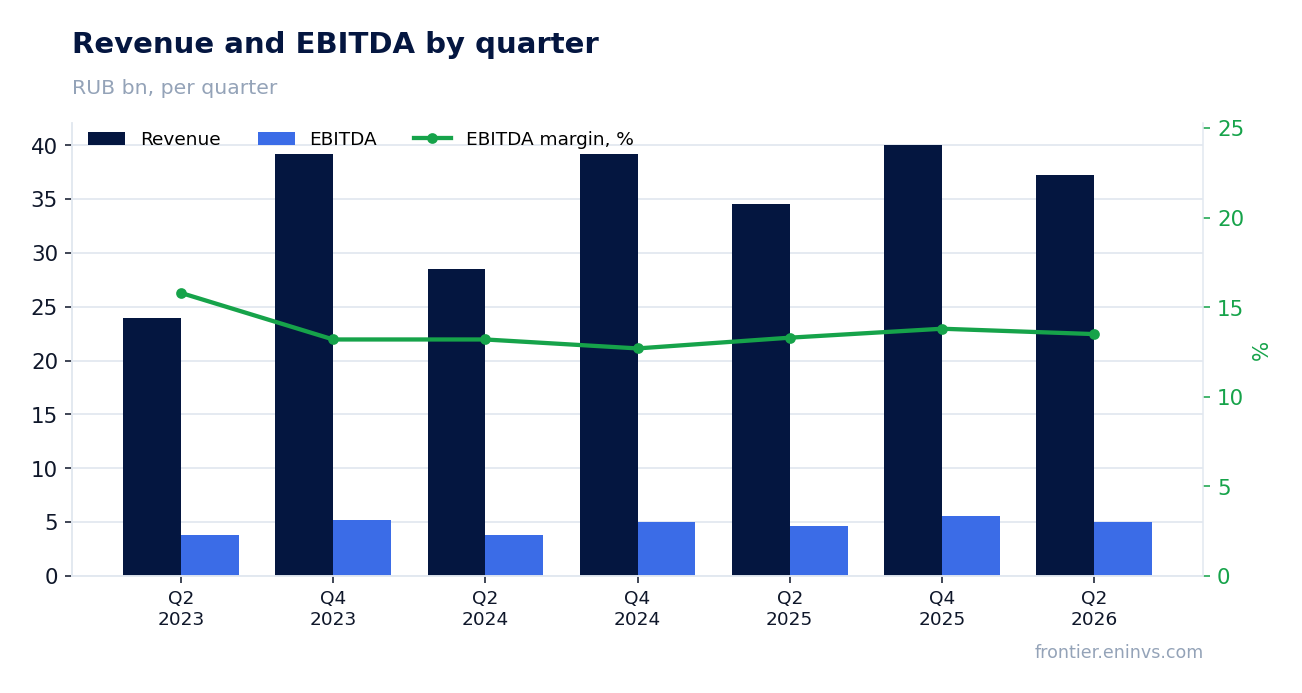
EBITDA margin rose to 13.5%, while net margin fell to 1.7% – costs below the operating line ate the profit
EBITDA margin in the second quarter of 2026 was 13.5% against 13.3% a year earlier. The improvement is small, but it confirms that revenue growth is not diluting profitability at the operating level.
Net margin over the same period fell to 1.7% from 3.0%. With operating profit of RUB 3,161.0 mn, net profit was only RUB 648.5 mn – the difference went to interest on debt and other items below the operating line.
That is why profit and EBITDA move in opposite directions: the operating business is holding up, while debt and the cost of servicing it weigh on the bottom line.
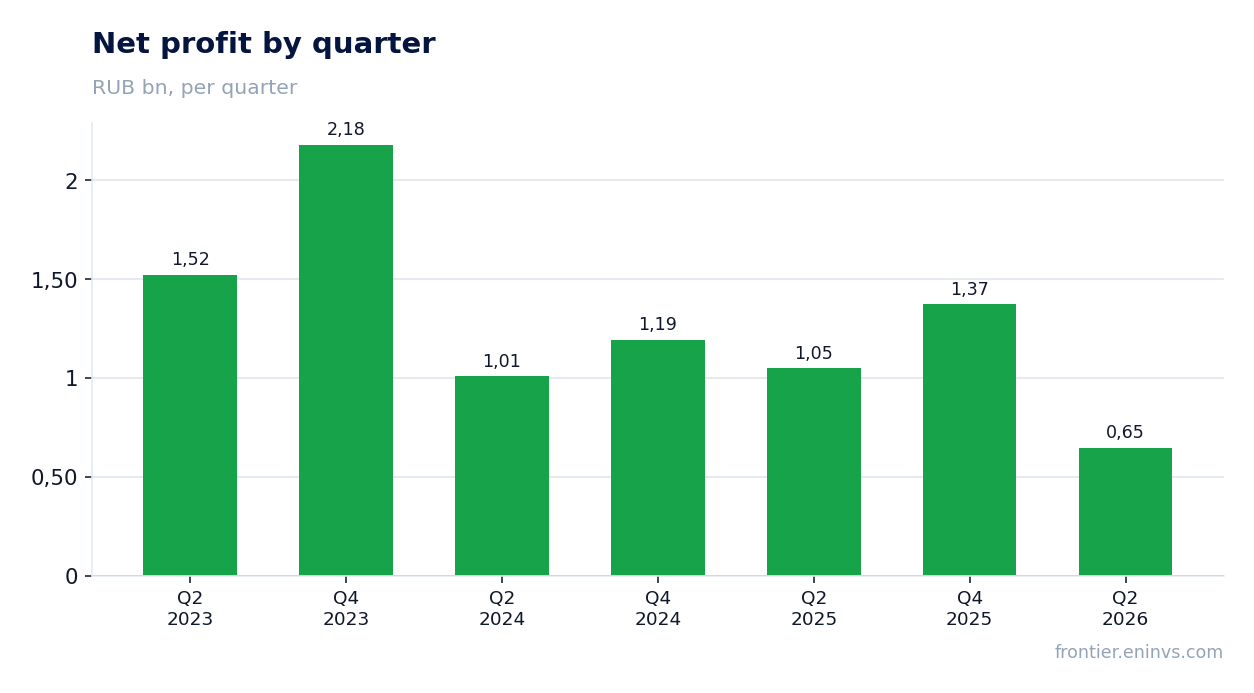
Net profit fell 38.3% to RUB 648.5 mn in the quarter even as operating profit rose to RUB 3,161.0 mn
The gap between operating and net profit is the main story of the report. Operating profit rose, while net profit fell 38.3% to RUB 648.5 mn. That means the pressure came not from the business but from financial lines.
With net debt of RUB 42,089.0 mn on 30 June 2026, interest expense is a material share of operating profit. The more expensive debt service is, the less is left for shareholders.
For a holder this matters: the profit from which the dividend is calculated was low in this quarter, even though operationally the company earned more than a year earlier.
Operating cash flow of RUB 3,565.5 mn covered capital expenditure of RUB 979.5 mn with room to spare
In the second quarter of 2026 operating cash flow was RUB 3,565.5 mn and capital expenditure RUB 979.5 mn. Free cash flow after investment remains positive, and that matters more than the weak net profit.
Capital expenditure rose relative to last year but remains moderate against revenue. The company is not spending more on investment than it earns operationally.
It is cash flow, not accounting profit, that determines the ability to pay dividends. By that measure the quarter looks stronger than by net profit.
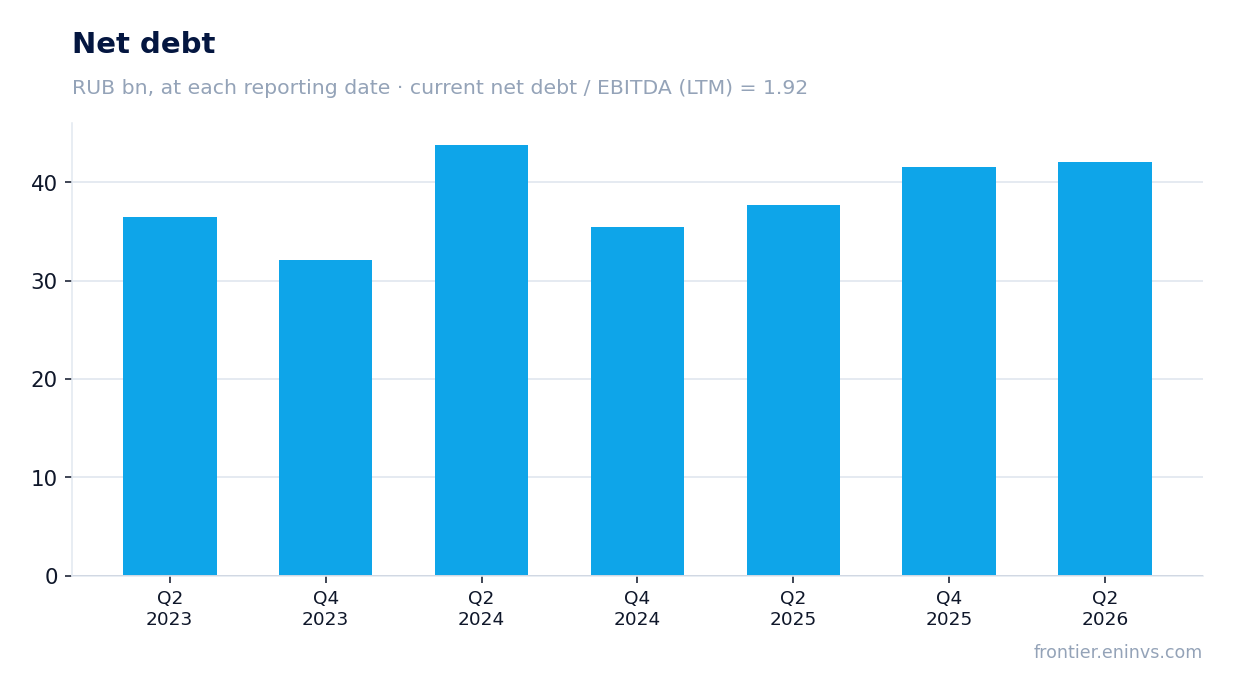
Net debt rose from RUB 37.7 bn on 30 June 2025 to RUB 42.1 bn on 30 June 2026
Net debt on 30 June 2026 was RUB 42,089.0 mn against RUB 37,735.0 mn a year earlier – an increase of RUB 4.4 bn over the year. Since the start of the year debt added RUB 0.5 bn, from RUB 41.6 bn on 31 December 2025.
The ratio of net debt to EBITDA over the last twelve months is 1.92. That is a moderate level, which leaves the company room to manoeuvre but does not free it from interest pressure.
Rising debt against falling net profit is the main risk for the dividend: the more goes to debt service, the less is left for payouts.
Our dividend estimate of RUB 21.49 per share gives an 8.0% yield – below the 9.1% we consider fair for the name
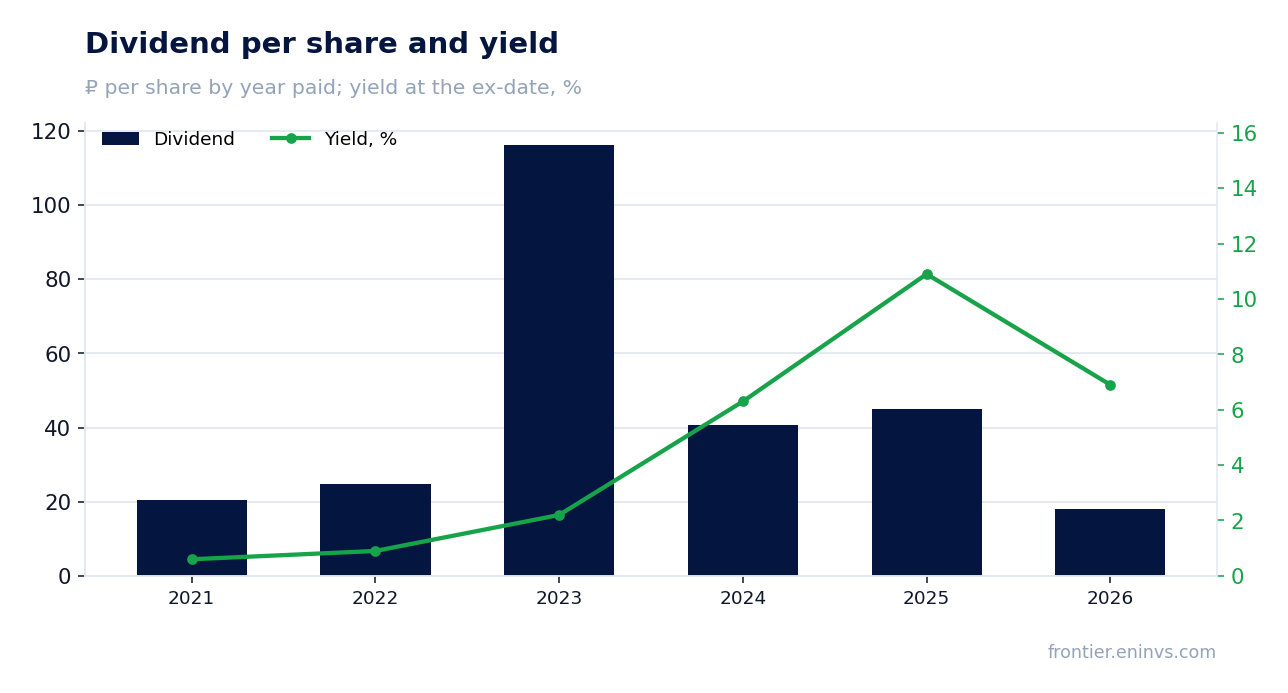
Over the last twelve months the company paid RUB 18.0 per share, which at a price of RUB 269.0 gives a 6.7% yield. On our model the annual dividend is estimated at RUB 21.49 per share – 8.0% to the current price.
The estimate rests on trailing twelve-month profit of RUB 4,364.0 mn and a payout ratio of 0.45. The dividend is not capped by free cash flow – the cap does not bind – but it depends on how much profit the company reports for the year.
A yield of 8.0% is below what we consider fair for this name, 9.1%. With the key rate at 14.0% the dividend does not look exceptionally generous, although the payment history supports interest in the share.
The dividend could be smaller if net profit stays under pressure from interest expense or if debt requires more cash than currently assumed.
On the portal's model the share is 10% below fair value
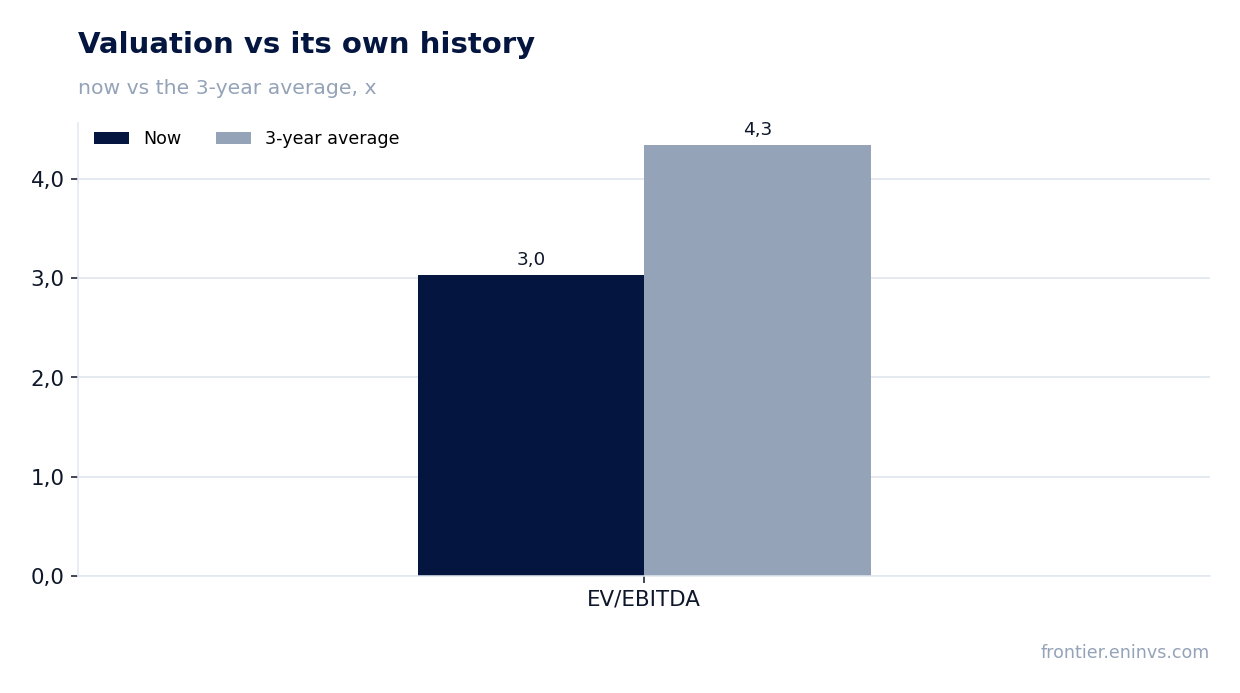
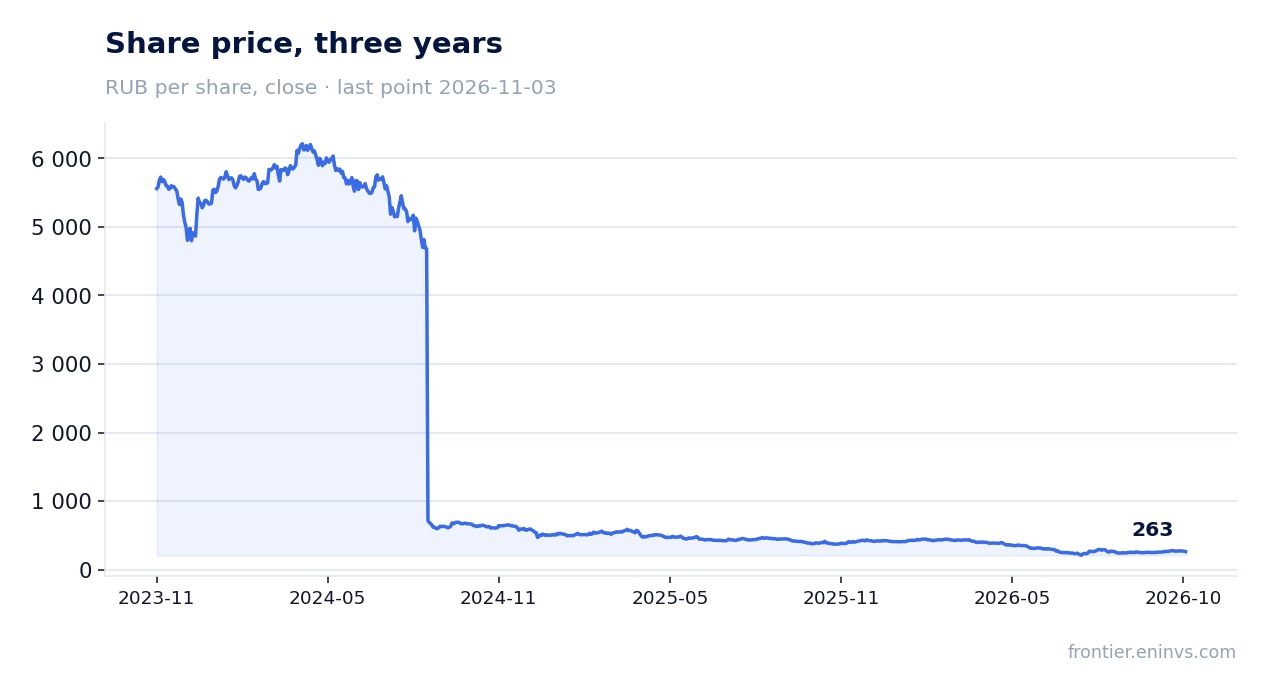
EV/EBITDA over the last twelve months is 3.0, which is 30% below its own three-year average of 4.3. On this multiple the share is cheaper than it was on average over three years.
P/E over the last twelve months is 5.7. With net profit of RUB 4,364.0 mn and a market capitalisation of RUB 24,821.2 mn, the market values the company inexpensively relative to its earning power.
On the portal's model, which sets EBITDA growth against the target multiple, the upside of the share to fair value is plus 10%. This is our own estimate, not a market consensus.
Valuation on the latest reported figures
| Metric | Value |
|---|---|
| Market cap | 24.8 bn ₽ |
| P/E (LTM) | 5.7 |
| EV/EBITDA (LTM) | 3.0 |
| P/B | 1.11 |
| Net debt / EBITDA (LTM) | 1.92 |
| Operating cash flow (LTM) | 10.7 bn |
| ROE | 10.7% |
| Dividend yield (12m) | 6.8% |
| EV/EBITDA, 3-year average | 4.3 |
Dividend per share, ₽, and yield at the ex-date
| Year paid | Dividend | Yield |
|---|---|---|
| 2021 | 20.34 | 0.6% |
| 2022 | 24.66 | 0.9% |
| 2023 | 116.25 | 2.2% |
| 2024 | 40.62 | 6.3% |
| 2025 | 45.00 | 10.9% |
| 2026 | 18.00 | 6.9% |
Bottom line
The strong side of the report is operational: revenue rose 7.6%, EBITDA 9.0%, the margin climbed to 13.5%, and cash flow covered investment. The weak spot is net profit, down 38.3% on costs below the operating line, and net debt that rose to RUB 42.1 bn. Our dividend estimate of RUB 21.49 per share gives 8.0% – below the fair 9.1% – but the payment history and a multiple of 3.0 against the three-year average of 4.3 support the share. The verdict is rather attractive: valuation is cheap, but the dividend yield falls short of fair, and everything hinges on whether net profit recovers.
Open the company's financial profile BELU →
See also: market overview · valuation map · stock screeners