Severstal: revenue is falling more slowly, but profit in Q2 almost vanished

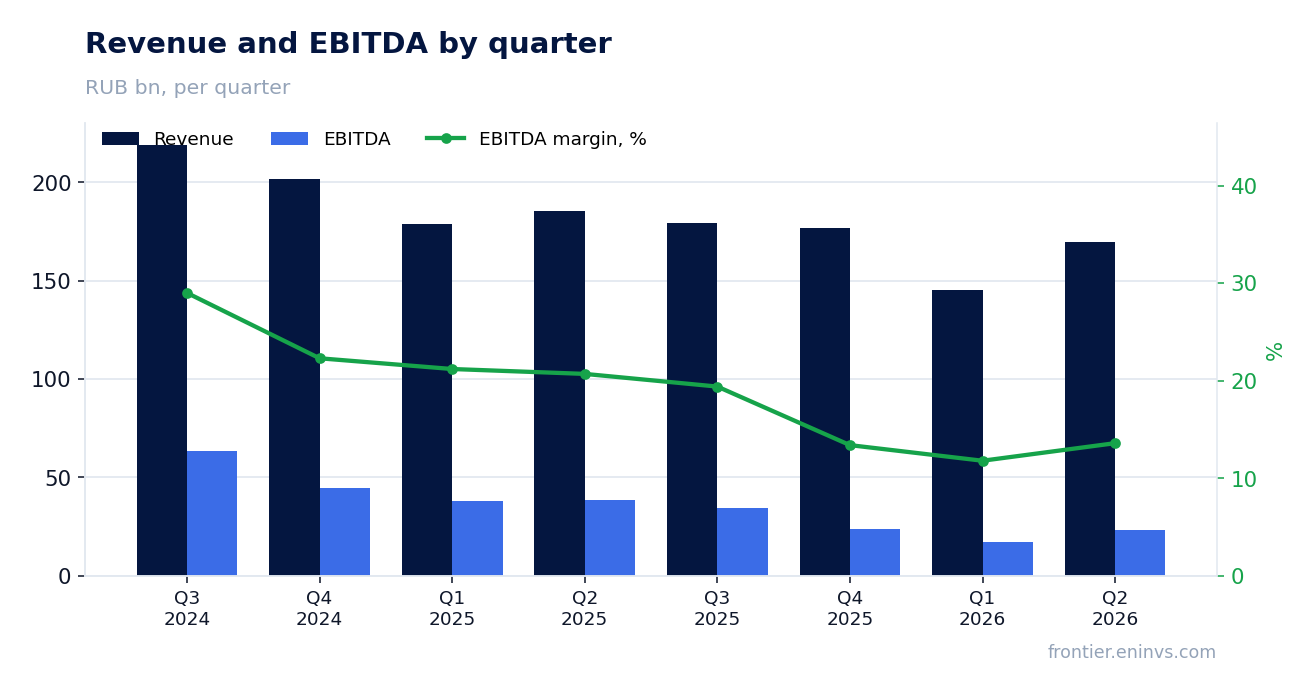
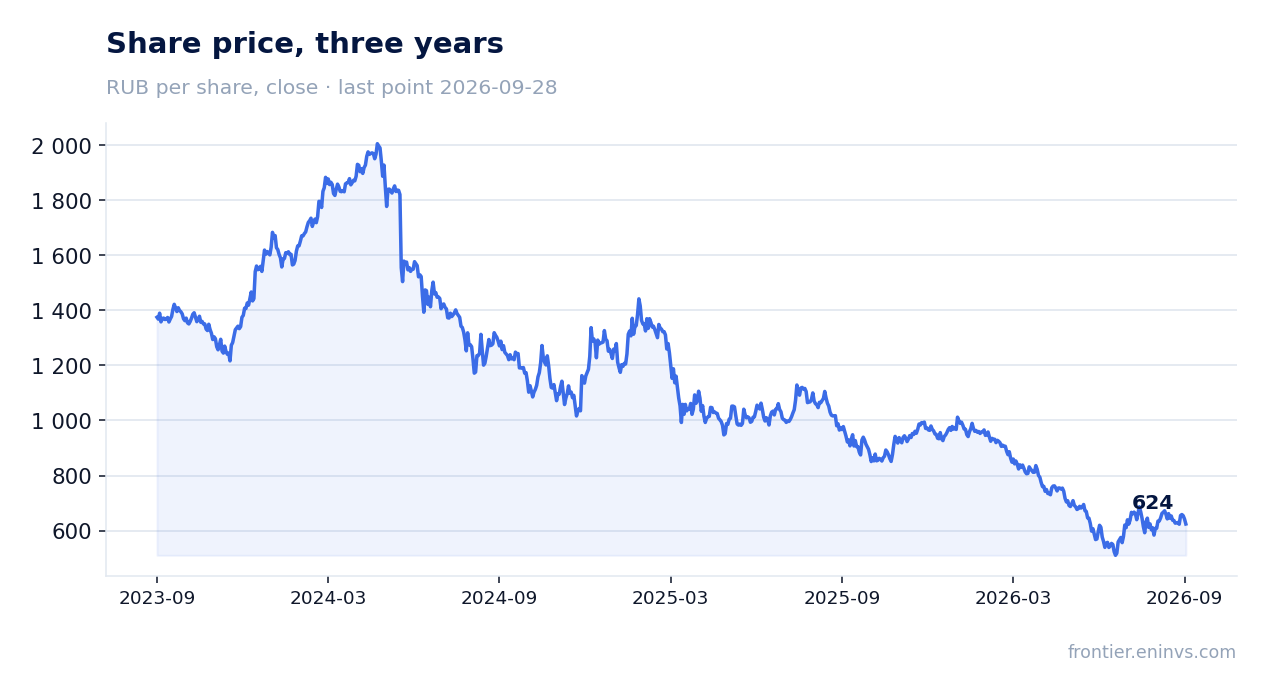
On 20 July, Severstal released its financial statements for the six months ended 30 June 2026. Second-quarter revenue was RUB 169.6 bn, down 8.6% year on year, EBITDA – RUB 23.1 bn (–39.7%), net profit – RUB 4.1 bn (–74.1%). The revenue decline slowed compared with the first quarter, but the EBITDA margin compressed to 13.6% from 20.7% a year earlier, and operating cash flow turned negative. At a price of RUB 517.8 and an EV/EBITDA of 6.15 versus its own three-year average of 4.62, the share looks rather unattractive despite the expected dividend yield.
Key takeaways
— Revenue is falling more slowly but remains below last year's level
— EBITDA margin compressed to 13.6% from 20.7% a year earlier
— Net profit almost vanished due to FX losses and rising depreciation
— Operating cash flow turned negative, while capital expenditures remain high
— Net debt rose to RUB 77.3 bn, but leverage remains moderate
— No dividends paid over the last 12 months, but expected yield is high
— EV/EBITDA multiple is above its own three-year average
Attractiveness
Key figures, RUB bn
| Metric | Q2 2025 | Q2 2026 | Change |
|---|---|---|---|
| Revenue | 185 | 170 | -8.6% |
| EBITDA | 38.4 | 23.1 | -39.7% |
| Operating profit | 27.7 | 10.2 | -63.3% |
| Net profit | 15.7 | 4.06 | -74.1% |
| Operating cash flow | 42.5 | -5.05 | -111.9% |
| Capex | 20.4 | 14.1 | -30.9% |
| EBITDA margin | 20.7% | 13.6% | -7.1 pp |
| Net margin | 8.5% | 2.4% | -6.1 pp |
Revenue is falling more slowly but remains below last year's level
Second-quarter 2026 revenue was RUB 169.6 bn, down 8.6% year on year. This is noticeably smaller than the 18.7% decline in the first quarter. The slowdown in the decline is linked to a gradual recovery in demand for steel products in the domestic market, although the company notes that reduced business activity in consumer industries persists.
Metal products remain the main revenue driver: over the six months they brought in RUB 277.5 bn versus RUB 325.5 bn a year earlier. Transport and warehousing services were almost flat at RUB 20.7 bn for the half-year. Other segments contracted to RUB 16.6 bn from RUB 18.4 bn.
Despite the slower decline, revenue remains below the levels of previous quarters. For a sustainable reversal, the company needs not only to maintain current volumes but also to see an improvement in pricing, which remains under pressure from the strong ruble.
EBITDA margin compressed to 13.6% from 20.7% a year earlier
Second-quarter EBITDA was RUB 23.1 bn, down 39.7% year on year. The EBITDA margin fell to 13.6% from 20.7% in the same period last year. The main pressure on the margin came from higher cost of sales, including depreciation, which rose to RUB 12.9 bn for the quarter versus RUB 10.7 bn a year earlier.
The Severstal Resources segment reported quarterly EBITDA of RUB 10.2 bn, significantly below RUB 15.8 bn a year earlier. The Severstal Russian Steel segment saw EBITDA decline to RUB 15.5 bn from RUB 25.0 bn. Intra-group operations made a negative contribution of RUB 1.3 bn.
The margin compression is explained not only by lower revenue but also by faster cost growth. The company notes that high interest rates affect working capital management decisions, leading to a temporary increase in receivables. This also weighs on the financial result.
Net profit almost vanished due to FX losses and rising depreciation
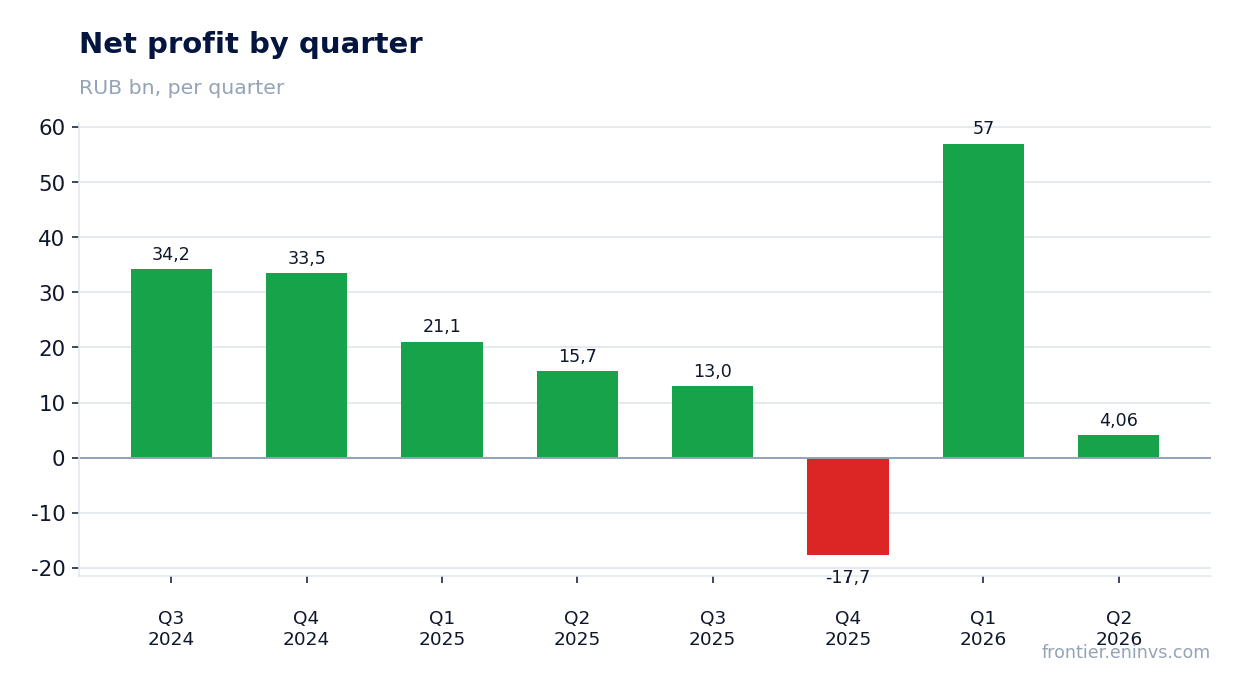
Second-quarter net profit was only RUB 4.1 bn, down 74.1% year on year. The net margin fell to 2.4% from 8.5%. In addition to lower operating efficiency, the result was hit by FX losses: RUB 1.8 bn for the quarter, including RUB 3.4 bn loss on derivative financial instruments.
A significant contribution to the profit decline also came from higher depreciation and a loss on disposal of fixed assets of RUB 1.0 bn for the quarter. These factors are largely one-off in nature but reflect ongoing investment processes.
For the six months, net profit was RUB 4.1 bn versus RUB 15.7 bn a year earlier. The difference between quarterly and half-year profit is minimal, indicating a weak first quarter when profit was close to zero.
Operating cash flow turned negative, while capital expenditures remain high
Second-quarter operating cash flow was negative at minus RUB 5.0 bn versus plus RUB 42.5 bn a year earlier. The main reason is a sharp increase in receivables: over the six months they rose by RUB 47.6 bn. The company attributes this to a temporary increase in the receivables balance due to working capital management amid high interest rates.
Quarterly capital expenditures were RUB 14.1 bn, down from RUB 20.4 bn a year earlier but still significant. Over the six months, capital investments reached RUB 50.7 bn versus RUB 83.5 bn a year earlier. The company continues to invest in maintaining and developing capacity, which limits free cash flow.
Free cash flow for the quarter was negative at minus RUB 29.8 bn, significantly worse than the positive RUB 3.6 bn a year earlier. This puts pressure on liquidity and could limit dividend payments in the future.
Net debt rose to RUB 77.3 bn, but leverage remains moderate
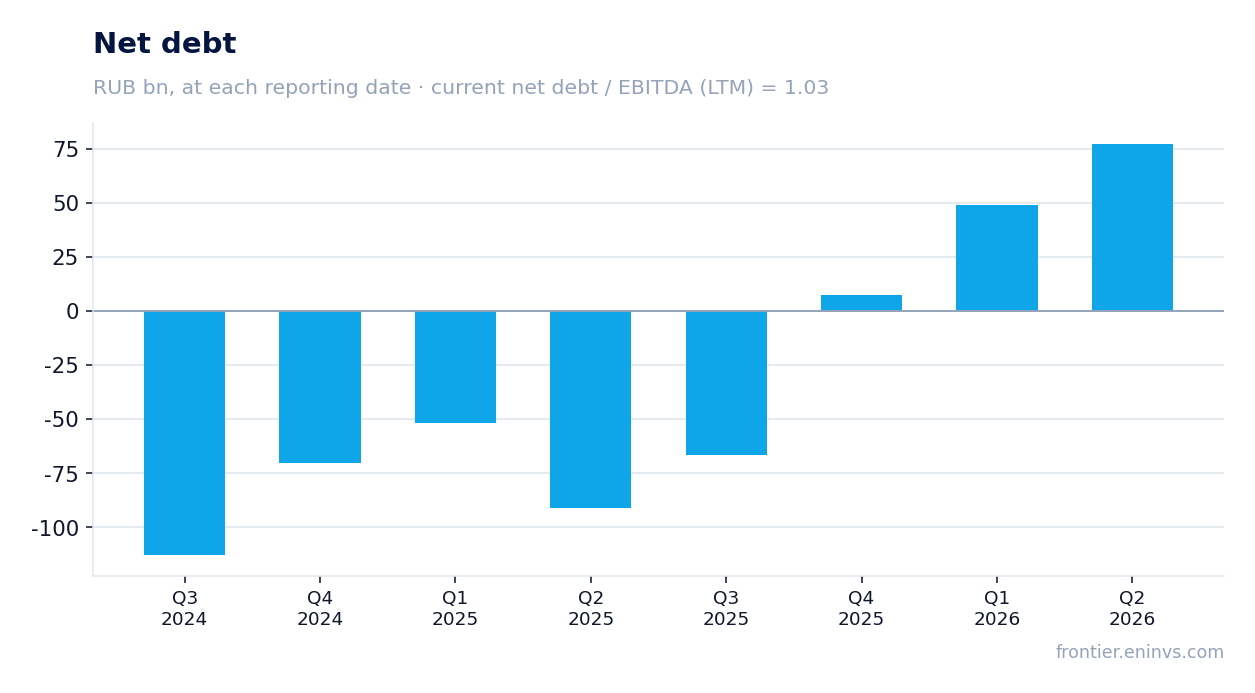
Net debt as of 30 June 2026 was RUB 77.3 bn, up from RUB 49.1 bn on 31 March 2026 (an increase of RUB 28.2 bn). Over the year, the figure rose from minus RUB 91.2 bn on 30 June 2025, a change of RUB 168.6 bn. This reflects a shift from a net cash position to debt.
The net debt to EBITDA ratio for the last 12 months is 1.03. This is a moderate level that does not raise concerns but requires monitoring. Total debt increased by RUB 35.6 bn compared with 31 December 2025, mainly due to an increase in floating-rate bank loans.
In March 2026, the company redeemed exchange-traded bonds of series BO-06 and BO-07 for a total of RUB 15.4 bn. In July 2026, after the reporting date, a new bond issue of RUB 25 bn was placed with a floating rate tied to the Bank of Russia key rate. This indicates active management of the debt portfolio.
No dividends paid over the last 12 months, but expected yield is high
No dividends were paid over the last 12 months – RUB 0.0 per share. No payments have been made in the current calendar year either, and no further payouts are planned. This is due to the need to finance capital expenditures and manage debt levels.
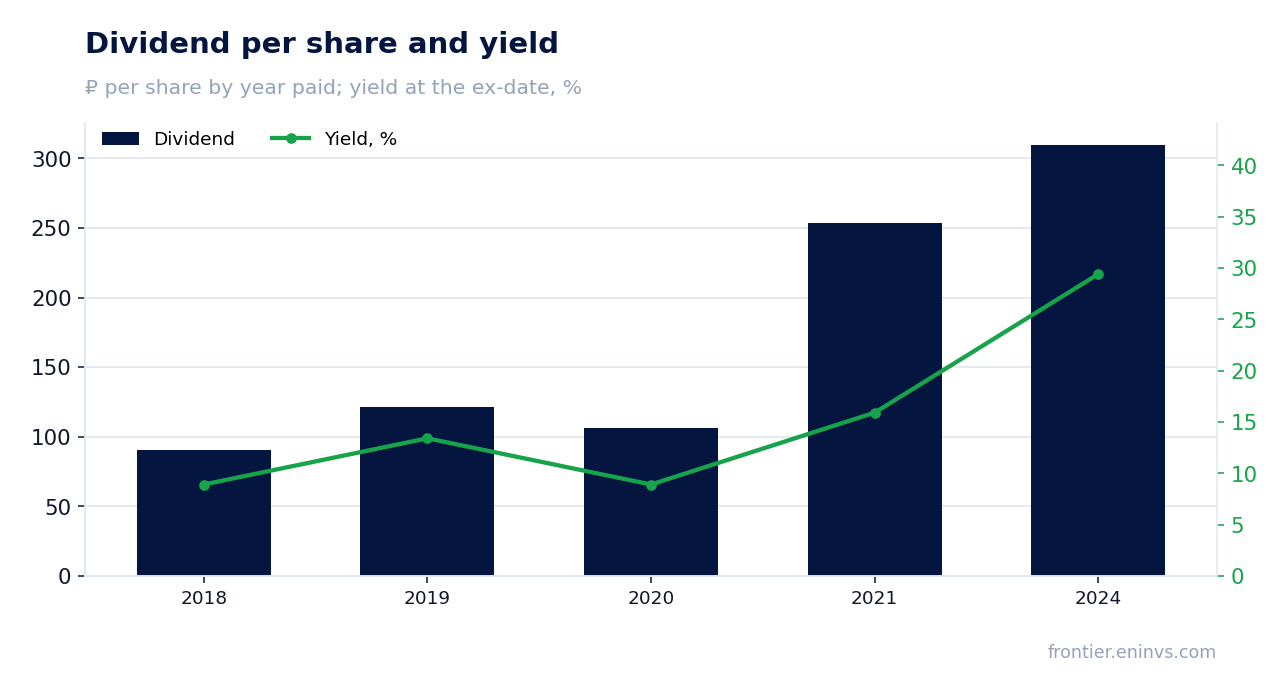
Our estimate of the fair dividend yield for this stock is 15.3%, corresponding to a payout ratio of 0.72 of profit. With the key rate at 14.0%, such a yield looks attractive but is not guaranteed. The payout history shows that in 2021 the yield reached 15.9%, and in 2024 – 29.4%, but there were no payments in 2022–2023.
To resume dividends, the company needs to improve free cash flow, which is currently negative. If operating cash flow remains under pressure and capital expenditures stay high, the likelihood of payouts in the near future decreases. The dividend history remains an important factor for valuation, but the current situation does not allow for expectations of imminent payments.
EV/EBITDA multiple is above its own three-year average
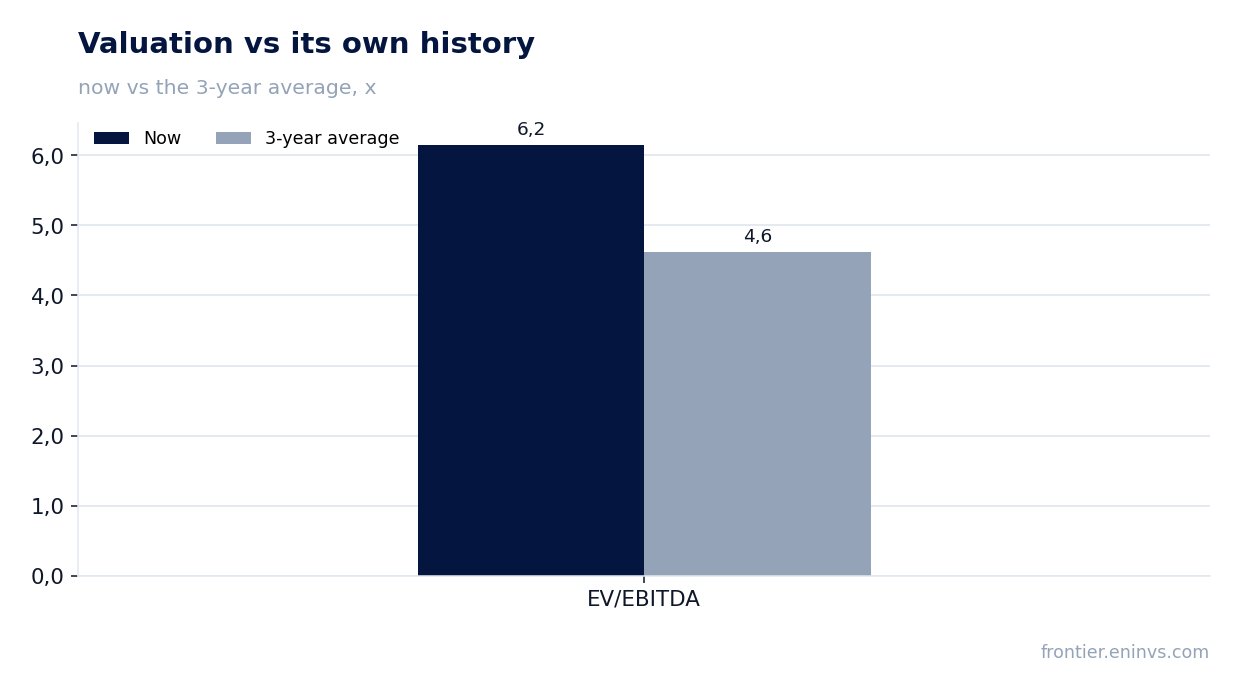
The current EV/EBITDA multiple is 6.15, above its own three-year average of 4.62. This means the market values the company more expensively than on average over the last three years, despite weak financial results. The trailing twelve-month P/E is 9.41.
According to our model, the fair value of the share, taking into account current commodity prices and the target EV/EBITDA, implies a downside of 22% from the current price. This points to the stock being overvalued relative to fundamental indicators.
A comparison with history shows that the current multiple level is not extreme, but it is above average. To justify such a valuation, the company needs to demonstrate a sustainable recovery in profit and cash flow. Until that happens, the share may remain under pressure.
Valuation on the latest reported figures
| Metric | Value |
|---|---|
| Market cap | 530 bn ₽ |
| P/E (LTM) | 9.4 |
| EV/EBITDA (LTM) | 6.2 |
| P/B | 1.07 |
| Net debt / EBITDA (LTM) | 1.03 |
| Operating cash flow (LTM) | 59.1 bn |
| ROE | 3.1% |
| EV/EBITDA, 3-year average | 4.6 |
Dividend per share, ₽, and yield at the ex-date
| Year paid | Dividend | Yield |
|---|---|---|
| 2018 | 90.33 | 8.9% |
| 2019 | 121.70 | 13.4% |
| 2020 | 106.39 | 8.9% |
| 2021 | 253.42 | 15.9% |
| 2024 | 309.93 | 29.4% |
Bottom line
Bottom line: in the second quarter, Severstal showed a slower decline in revenue, but profit almost vanished due to FX losses and rising depreciation. Operating cash flow turned negative, and capital expenditures remain high, weighing on free cash flow and dividend prospects. Net debt rose to RUB 77.3 bn, but leverage at 1.03x EBITDA remains moderate. The EV/EBITDA multiple is above its own three-year average, and the portal model indicates a 22% downside. Given these factors, the share looks rather unattractive at current levels.
Open the company's financial profile CHMF →
See also: market overview · valuation map · stock screeners