Severstal: margin adds nearly four points while revenue is still shrinking

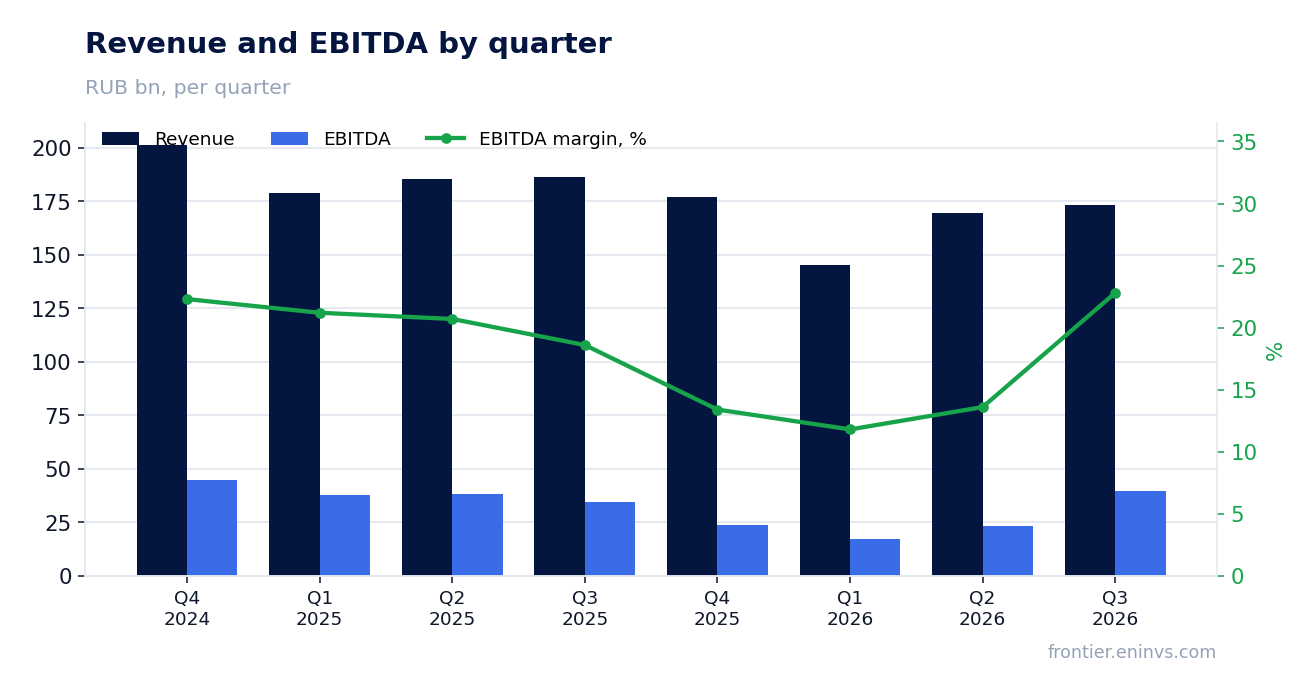
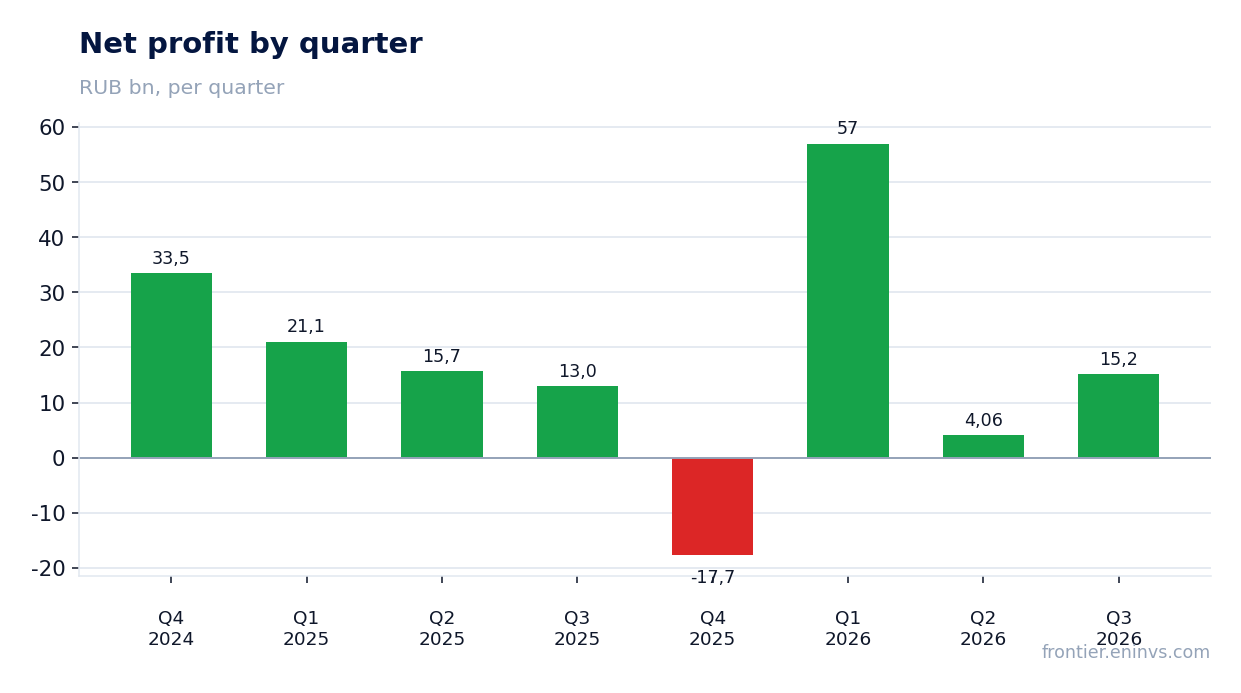
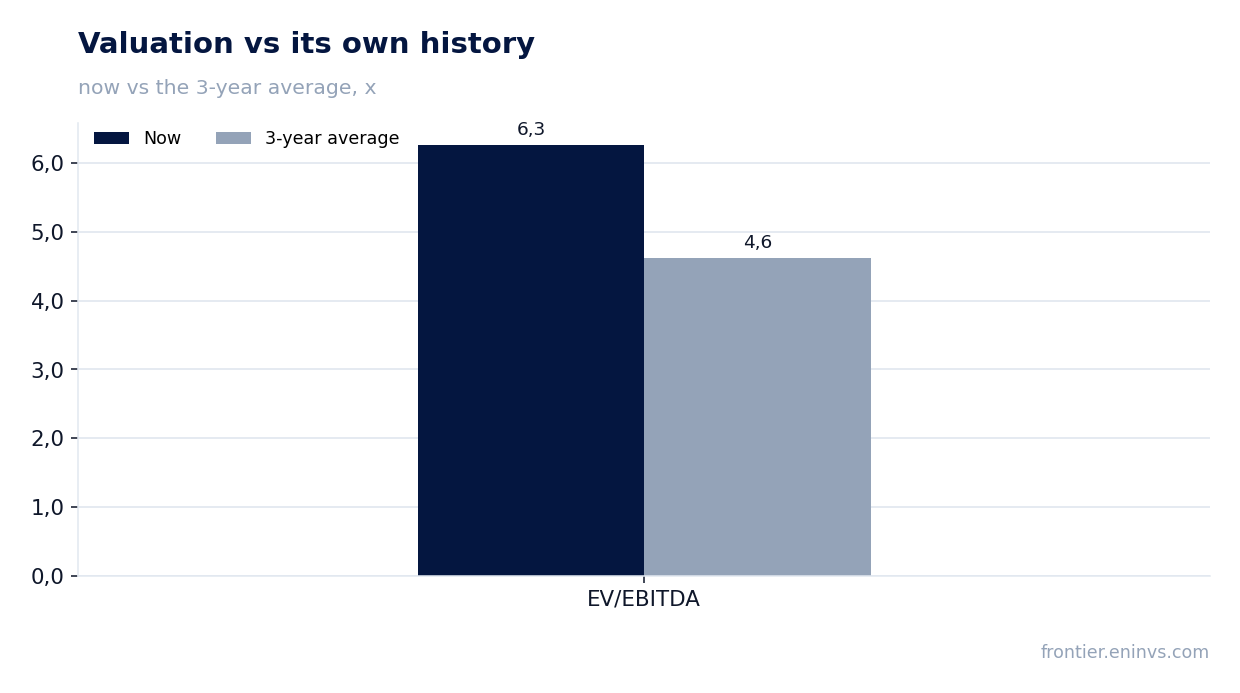
On 20 October Severstal published its results for the nine months and the third quarter of 2026. Quarterly revenue was RUB 173.5 bn (–7.0% year on year), EBITDA RUB 39.6 bn (+14.1%), net profit RUB 15.2 bn (+16.8%), and the EBITDA margin rose to 22.8% from 18.6% a year earlier. Yet the share trades above its own history: EV/EBITDA LTM 6.3 against a three-year average of 4.6, and the portal's model puts the upside to fair value at –39%. The verdict is neutral: the margin and cash flow are strong, but valuation and the absence of a dividend outweigh them.
Key takeaways
— Revenue fell 7.0%, but the decline is shallower than in the second quarter (–8.6%)
— EBITDA added 14.1% on falling revenue – the margin rose to 22.8% from 18.6%
— Quarterly net profit of RUB 15.2 bn rests on FX differences, not only on operating results
— Operating cash flow of RUB 64.5 bn for the quarter – cash arrived ahead of profit
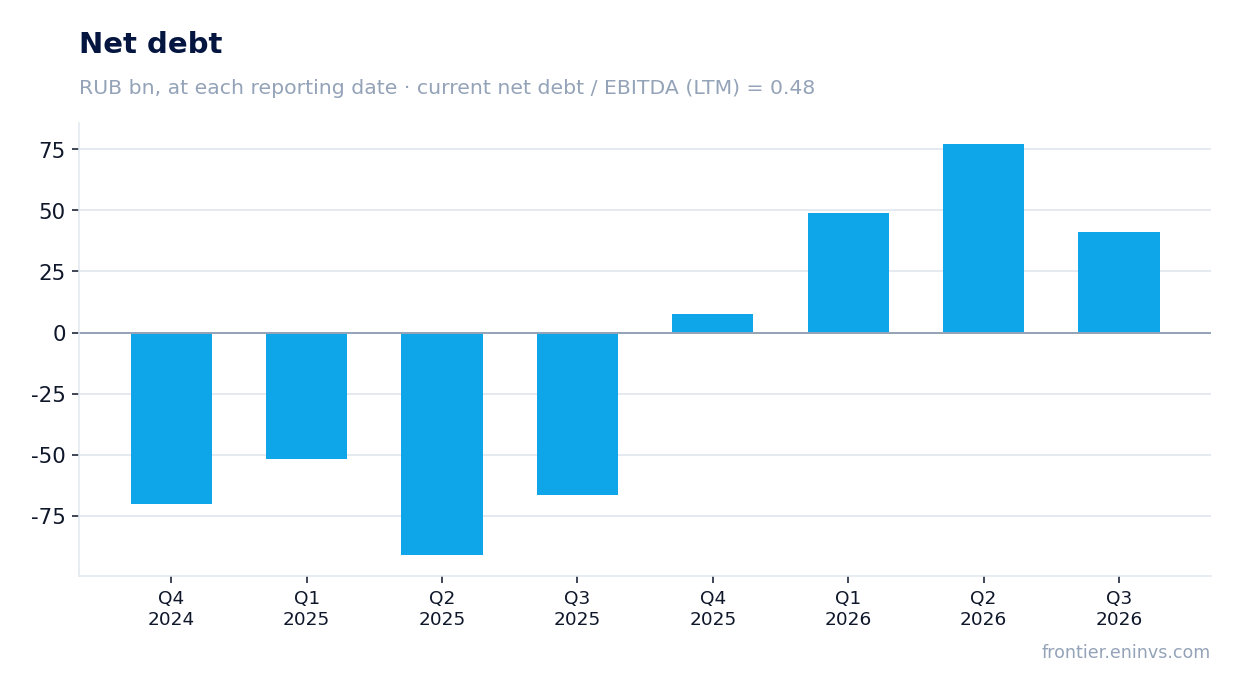
— Net debt fell to RUB 41.3 bn from RUB 77.3 bn at end-June, leverage at 0.48 EBITDA
— No dividends were paid over the last 12 months, and none is pencilled in for this year
— EV/EBITDA of 6.3 is above its own three-year average of 4.6 – the share is dearer than its history
Attractiveness
Key figures, RUB bn
| Metric | Q3 2025 | Q3 2026 | Change |
|---|---|---|---|
| Revenue | 187 | 174 | -7.0% |
| EBITDA | 34.7 | 39.6 | +14.1% |
| Operating profit | 23.3 | 27.3 | +17.5% |
| Net profit | 13.0 | 15.2 | +16.8% |
| Operating cash flow | 42.4 | 64.5 | +52.1% |
| Capex | 4.22 | — | — |
| EBITDA margin | 18.6% | 22.8% | +4.2 pp |
| Net margin | 7.0% | 8.7% | +1.7 pp |
Revenue fell 7.0%, but the decline is shallower than in the second quarter (–8.6%)
Third-quarter revenue was RUB 173.5 bn against RUB 186.5 bn a year earlier. The 7.0% decline was smaller than the 8.6% in the second quarter – the pace of contraction slowed rather than accelerated. This is the first improvement in quarterly dynamics after four consecutive quarters of deepening decline.
By product, metal products brought RUB 152.5 bn for the quarter against RUB 159.6 bn a year earlier, transport and warehousing services RUB 10.9 bn against RUB 9.7 bn, and other RUB 10.1 bn against RUB 9.8 bn. The decline is concentrated in the core steel segment, while service lines grew.
In the report management attributes weak demand to the high key rate: end consumers of steel products are not restoring purchases in 2026. While that factor persists, revenue will stay under pressure, and the better quarterly pace is stabilisation rather than a reversal.
EBITDA added 14.1% on falling revenue – the margin rose to 22.8% from 18.6%
Quarterly EBITDA was RUB 39.6 bn against RUB 34.7 bn a year earlier, up 14.1%. The EBITDA margin rose to 22.8% from 18.6%, a gain of 4.2 percentage points. Operating profit increased to RUB 27.3 bn from RUB 23.3 bn.
That gap between revenue and EBITDA means cost of sales shrank faster than sales. Other taxes and levies within cost of sales fell to RUB 4.3 bn for the quarter from RUB 4.9 bn a year earlier, while depreciation of production assets rose to RUB 12.3 bn from RUB 11.4 bn – the savings came through cash cost lines, not accounting adjustments.
By segment, Severstal Resources EBITDA was RUB 9.2 bn against RUB 14.1 bn a year earlier, while Severstal Russian Steel was RUB 31.8 bn against RUB 19.4 bn. The mining division weakened and the steel division doubled its result – the margin was pulled by the processing stage, not by raw materials.
Quarterly net profit of RUB 15.2 bn rests on FX differences, not only on operating results
Third-quarter net profit was RUB 15.2 bn against RUB 13.0 bn a year earlier, up 16.8%. The net margin rose to 8.7% from 7.0%. Yet profit before tax and financial items for the nine months was RUB 38.9 bn against RUB 73.5 bn a year earlier – the operating base over three quarters is markedly weaker than last year's.
The gap is explained by FX differences. For the quarter the net FX loss was RUB 3.7 bn against RUB 5.7 bn a year earlier, so currency revaluation weighed less on profit. For the nine months the FX loss was RUB 9.2 bn against RUB 10.1 bn. That is not operating income, and the sign may flip next quarter.
For the nine months net profit was RUB 19.3 bn against RUB 49.7 bn a year earlier. Quarterly profit growth against a weak nine-month result is a recovery from the collapse at the start of the year, not a durable trend.
Operating cash flow of RUB 64.5 bn for the quarter – cash arrived ahead of profit
Quarterly operating cash flow was RUB 64.5 bn – more than four times net profit. For the nine months it came to RUB 46.8 bn after interest and tax, against RUB 89.9 bn a year earlier. The quarterly surge partly reflects working-capital release: over nine months trade payables rose by RUB 20.6 bn while inventories added RUB 8.7 bn.
Capital expenditure for the nine months was RUB 72.3 bn against RUB 122.2 bn a year earlier, so the investment programme has been almost halved. Free cash flow for the nine months was negative at minus RUB 27.6 bn, but in the third quarter it turned positive at RUB 42.6 bn.
The combination of a strong quarterly flow and a trimmed construction programme produced the cash that was missing in the first half. Unrecognised capital commitments at 30 September were RUB 41.7 bn against RUB 72.5 bn at end-2025, so pressure on investment is easing.
Net debt fell to RUB 41.3 bn from RUB 77.3 bn at end-June, leverage at 0.48 EBITDA
Net debt at 30 September was RUB 41.3 bn against RUB 77.3 bn at 30 June – a reduction of RUB 36.0 bn over the quarter. The ratio of net debt to trailing twelve-month EBITDA is 0.48, so leverage is moderate. A year earlier, at 30 September 2025, net debt was negative at minus RUB 66.6 bn, so over twelve months it rose by RUB 107.9 bn.
The debt portfolio is being restructured: in March the BO-06 and BO-07 exchange bonds were repaid for RUB 15.4 bn, and in July two-year 002Р-01 bonds were issued for RUB 25 bn with a floating rate and a 110 basis point spread to the key rate. Short-term debt fell to RUB 41.2 bn from RUB 56.3 bn at end-2025, while long-term debt rose to RUB 29.9 bn from RUB 3.8 bn.
Interest paid over nine months was RUB 15.3 bn against RUB 24.0 bn a year earlier. With the key rate at 14.0% and a floating coupon, the new issue means debt servicing will follow the rate: a cut eases the interest burden, a rise does not.
No dividends were paid over the last 12 months, and none is pencilled in for this year
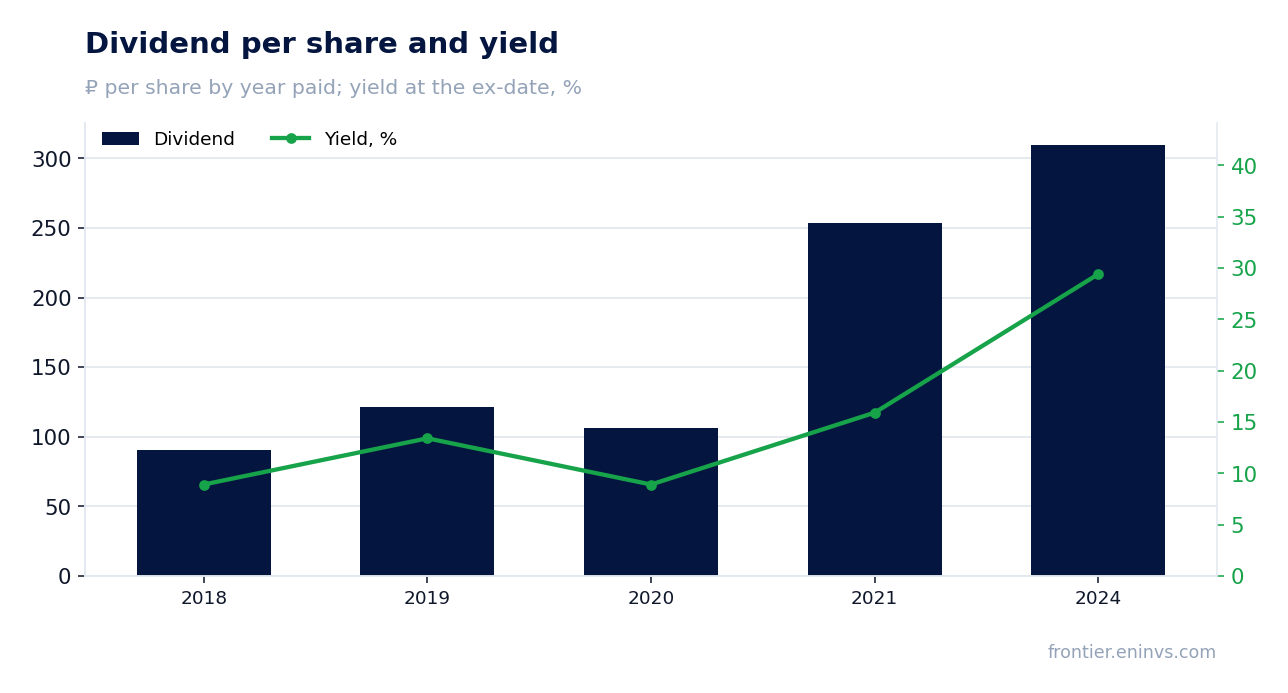
Over the last 12 months Severstal paid no dividends – RUB 0.0 per share – and no further payout is pencilled in for the current calendar year. The last payment in the history is for 2024: RUB 309.93 per share at a 29.4% yield to the ex-date price. The yield history is uneven: 8.9% in 2018, 13.4% in 2019, 8.9% in 2020, 15.9% in 2021.
Our estimate of a fair yield for this name is 15.0%, corresponding to a payout ratio of 0.72 of profit. With the key rate at 14.0%, that yield offers only a small premium to the risk-free alternative, and only if profit recovers. The base is weak: trailing twelve-month net profit is RUB 58.5 bn, but nine-month 2026 profit is only RUB 19.3 bn.
The payout could be reduced by anything that hits profit: a further fall in revenue, a weak rouble through FX differences, higher interest costs on the floating coupon. While the company directs cash to debt reduction and investment, the dividend is a question for next year, not this one.
EV/EBITDA of 6.3 is above its own three-year average of 4.6 – the share is dearer than its history
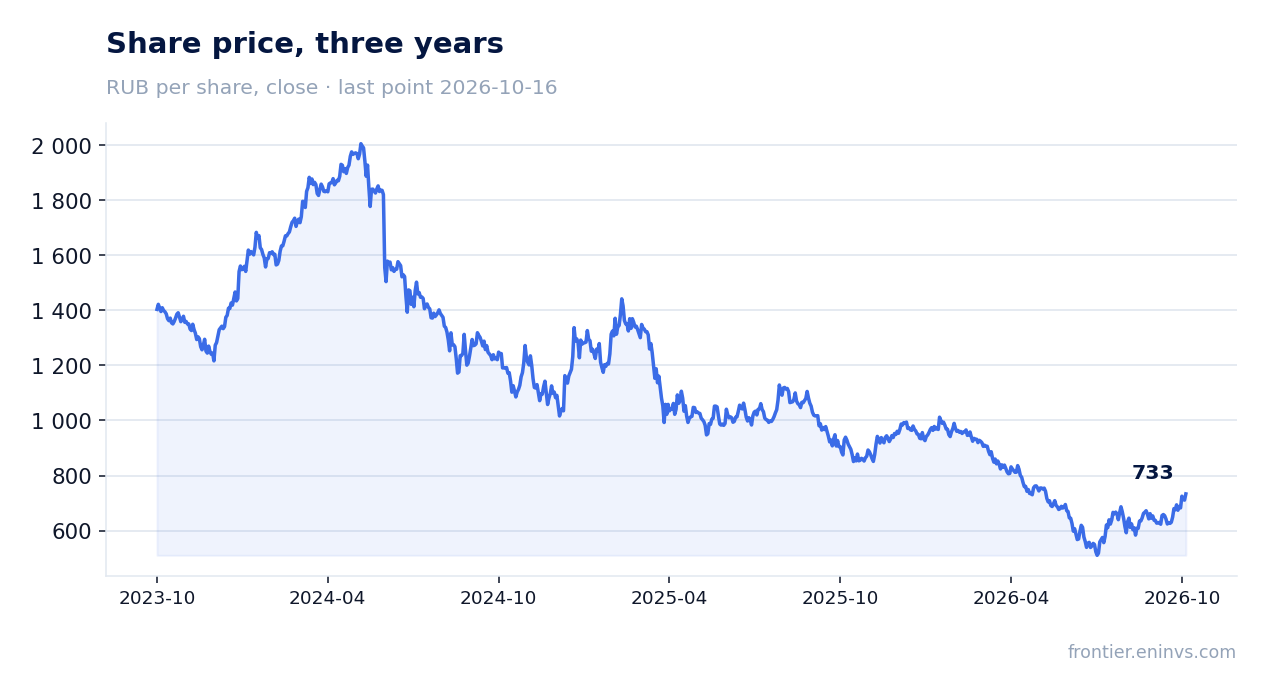
On the trailing twelve-month EV/EBITDA the share trades at 6.3 against a three-year average of 4.6 – 35% above its own history. The trailing P/E is 10.4 and ROE is 3.7%. The market is paying for a margin recovery more than it is worth by historical standards.
On the portal's model, where EBITDA is re-priced at current commodity prices at the target EV/EBITDA, the upside of the share to fair value is negative at –39%. This is our own estimate, not a market consensus, and it rests on current commodity prices.
Only a durable EBITDA recovery can justify the premium to history. A quarterly margin of 22.8% is a step in that direction, but revenue is still falling and nine-month profit is a third of last year's. Until both conditions are met, the valuation looks stretched.
Valuation on the latest reported figures
| Metric | Value |
|---|---|
| Market cap | 608 bn ₽ |
| P/E (LTM) | 10.4 |
| EV/EBITDA (LTM) | 6.3 |
| P/B | 1.22 |
| Net debt / EBITDA (LTM) | 0.48 |
| Operating cash flow (LTM) | 81.2 bn |
| ROE | 3.7% |
| EV/EBITDA, 3-year average | 4.6 |
Dividend per share, ₽, and yield at the ex-date
| Year paid | Dividend | Yield |
|---|---|---|
| 2018 | 90.33 | 8.9% |
| 2019 | 121.70 | 13.4% |
| 2020 | 106.39 | 8.9% |
| 2021 | 253.42 | 15.9% |
| 2024 | 309.93 | 29.4% |
Bottom line
What came out strong in the report was the margin and the cash: EBITDA added 14.1%, the margin rose to 22.8%, quarterly operating cash flow was RUB 64.5 bn, and net debt fell to RUB 41.3 bn at 0.48 EBITDA. But part of the quarterly profit came from smaller FX losses rather than from operations, and nine-month net profit is a third of last year's. No dividends were paid over the last 12 months, and none is pencilled in for this year. The key question for a holder is whether a durable margin recovery justifies a multiple of 6.3 against its own 4.6 average; with no answer yet, the verdict is neutral.
Open the company's financial profile CHMF →
See also: market overview · valuation map · stock screeners