Buying exporters after a devaluation: what 48 currency crashes since 1997 actually show
A country index bought right after a real devaluation has beaten other emerging markets by about 9 points over the following year, and the winners inside that market were factories, not mines. That is the short version of a study we ran across 16 emerging markets and 164 stocks. The longer version has several surprises, and the biggest one is that the obvious trade, buying commodity exporters because their costs just got cheaper, does not work.
The signal is the real exchange rate, not the nominal one. A currency that falls 30% against the dollar while local prices rise 30% has not become cheaper for anyone. The trigger used here is a drop of 12% or more in the BIS real effective exchange rate over six months.
The edge lives in the first year and fades by the second. Median excess return over other emerging markets is +9.3 points at 12 months and +7.0 at 24, with the hit rate falling from 61% to 57%.
Only manufacturing exporters beat domestic stocks after the event. Exporters in Turkey, Korea, India, Mexico, Thailand and Poland led domestic names by 19% over a year. Exporters in Brazil, South Africa, Chile, Indonesia and Malaysia led by 3%, which is noise.
Russia confirms it from the other side. Across five ruble devaluations, gold, fertilizer and oil producers lagged the domestic market. Steel and agriculture were the only exporters that paid.
Today the trigger has not fired anywhere, but the map is unusually lopsided. Indonesia, India and Korea sit at the bottom of their ten-year real-rate ranges. Colombia, Mexico, Russia, Argentina and most of Eastern Europe sit at the top. Turkey has re-appreciated 46% in real terms in three years.
The data, the method and every caveat follow. The ideas at the end are cross-checked against two sources, and the multiples will have moved by the time this is read.
The test: real devaluation of 12% in six months, then hold the country index for a year
The panel covers 16 emerging markets with monthly data from the mid-1990s where it exists. The country index is the MSCI country ETF in dollars with dividends reinvested (Russia uses the RTS index, price only). The real exchange rate is the BIS broad real effective index, published monthly on FRED with a lag of about six weeks.
An event is any month in which the real rate is at least 12% below its level six months earlier. Events in the same country closer than 12 months apart are merged, so a long slide counts once. That gives 48 events between Malaysia in September 1997 and Argentina in July 2025.
The benchmark is every country-month in the panel, 3,844 of them, and separately the median return of all other emerging markets starting in the same month. The second benchmark matters because nine of the 48 events cluster in the autumn of 2008, when everything bounced together.
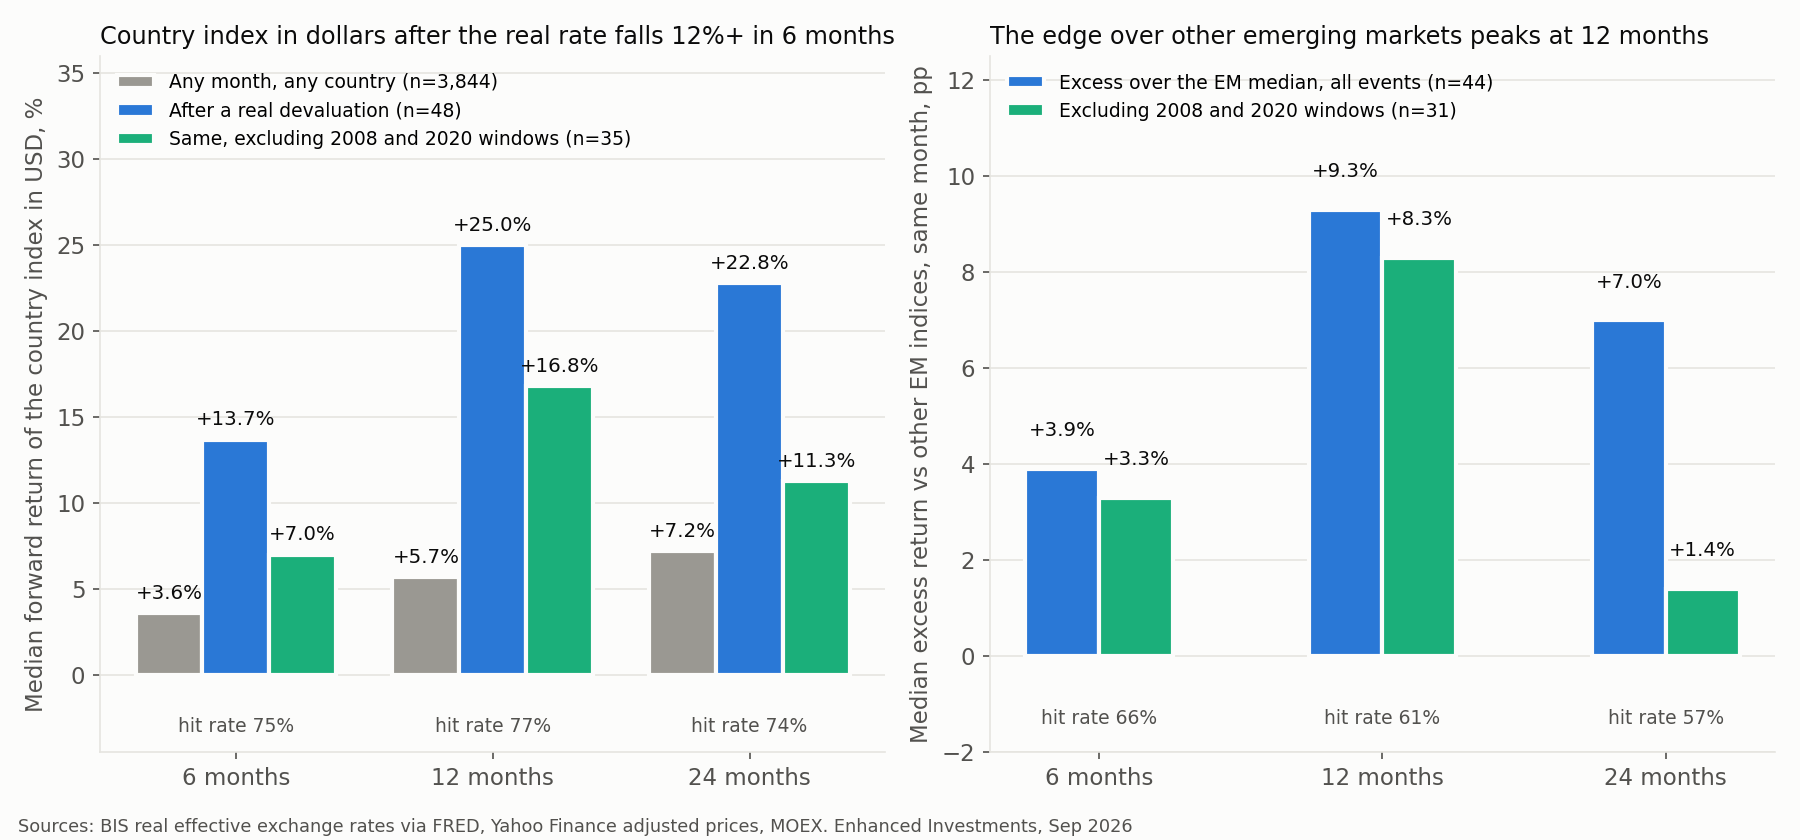
A year later the index is up 25% in dollars in the median case, and 9 points ahead of its peers
The median country index gained 13.7% in dollars six months after the event, 25.0% after twelve and 22.8% after twenty-four. The unconditional medians are 3.6%, 5.7% and 7.2%. Three quarters of the events were positive at every horizon.
Excess return over the emerging-market median in the same month is smaller but still there. It peaks at +9.3 points at 12 months with a 61% hit rate, then thins to +7.0 points at 24 months. Removing the 2008 and 2020 windows, which are the events an investor would most likely have been too scared to buy, leaves +8.3 points at 12 months and almost nothing at 24.
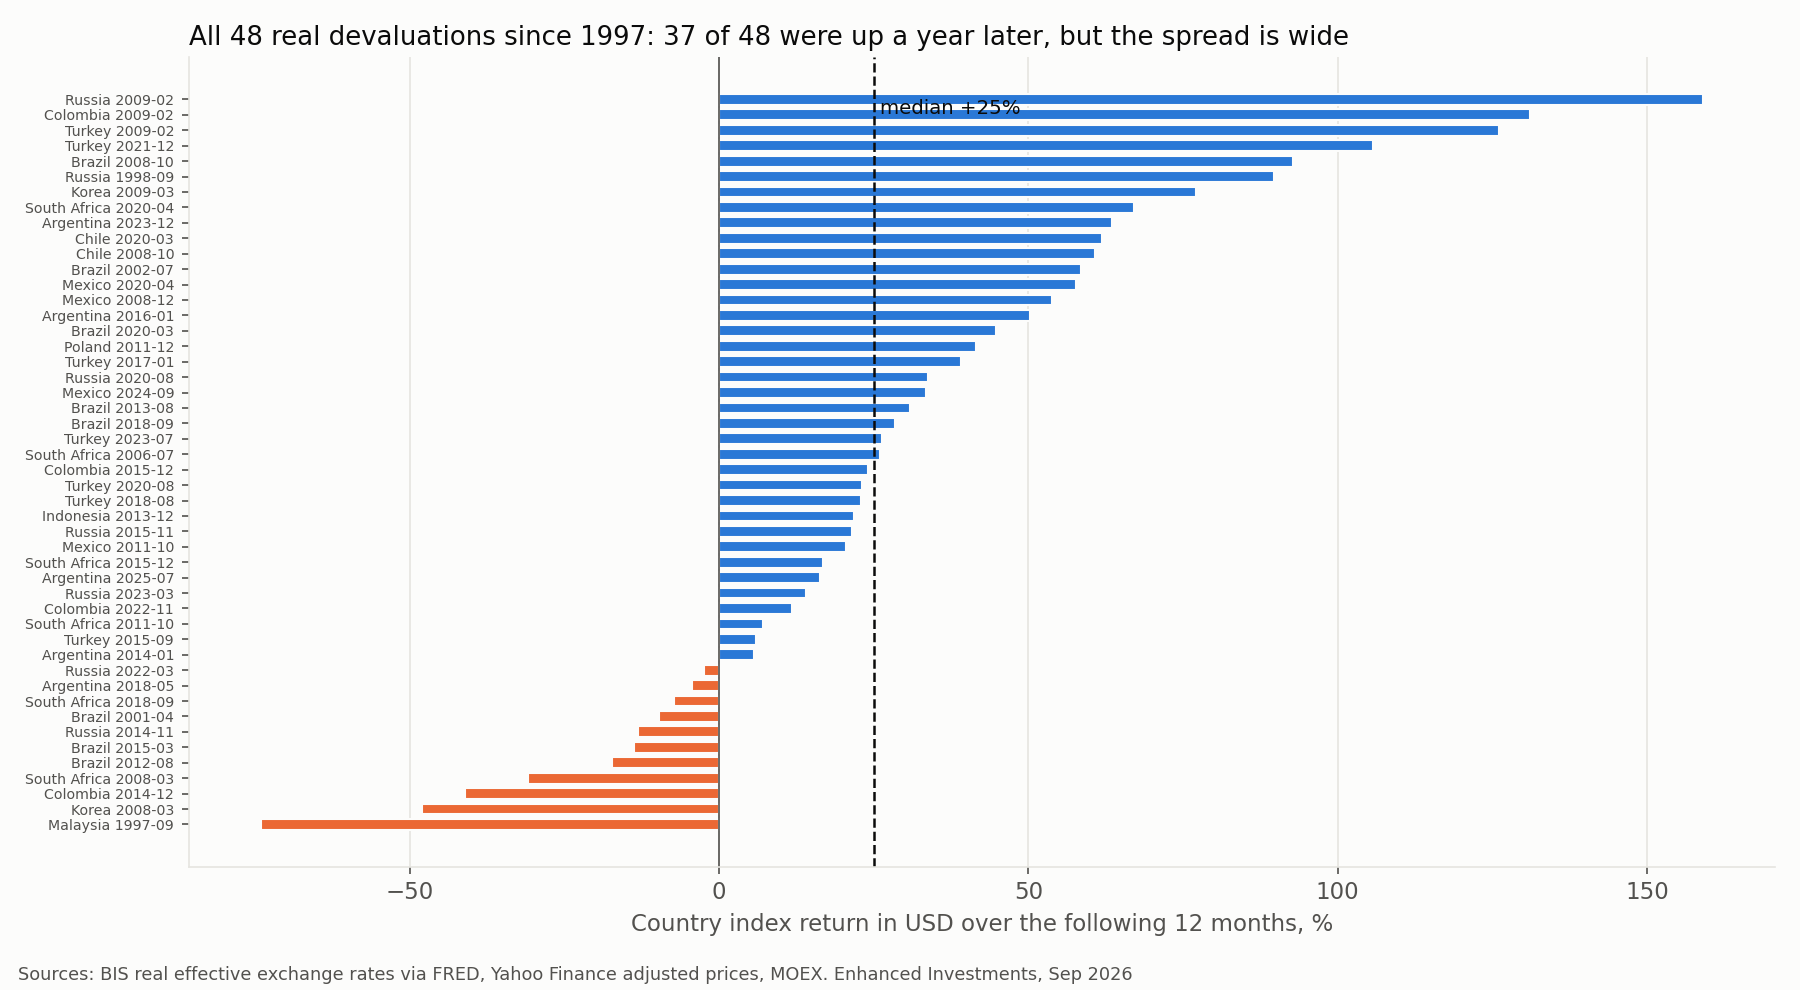
The dispersion is wide and worth seeing in full. Russia in early 2009 returned 159% in a year. Malaysia in 1997 lost 74%. Eleven of the 48 events were negative a year later, and the losing list is not exotic. It includes Korea in March 2008, Colombia at the end of 2014 and Russia in November 2014.
A cheap currency on its own, without the crash, is a weak signal. Sorting all country-months by where the real rate sits within its own ten-year range, the cheapest fifth returned a median 7.3% over the next year against 5.7% for all months. The most expensive fifth returned 3.5%. The gap exists but it is not monotonic in between, so the level tells you where to look, not when to buy.
The mirror image is cleaner. When a real rate rises 8% or more in six months into the top quarter of its range, the country still gains in dollars on average, but it lags other emerging markets by 4.4 points over the following year and by 11.3 points over two.
Inside the market, exporters beat domestic stocks only where the exports are manufactured
For 11 of the 16 countries we built two baskets of large, currently traded stocks. Exporters earn in dollars or sell goods priced on world markets. Domestic names sell in local currency at local prices, mostly banks, retailers, telecoms and consumer staples. Both baskets are equal-weighted, in local currency, with dividends reinvested, and the comparison is the ratio of the two, not the difference. In high-inflation countries both baskets multiply several times over, and an arithmetic difference produces nonsense. The first pass gave Turkey a spread of minus 262 points before that was fixed.
Across all 37 events with basket data, exporters led domestic stocks by a median 7.1% at 12 months, with a 62% hit rate. Split the countries by what they export and the result splits with them.
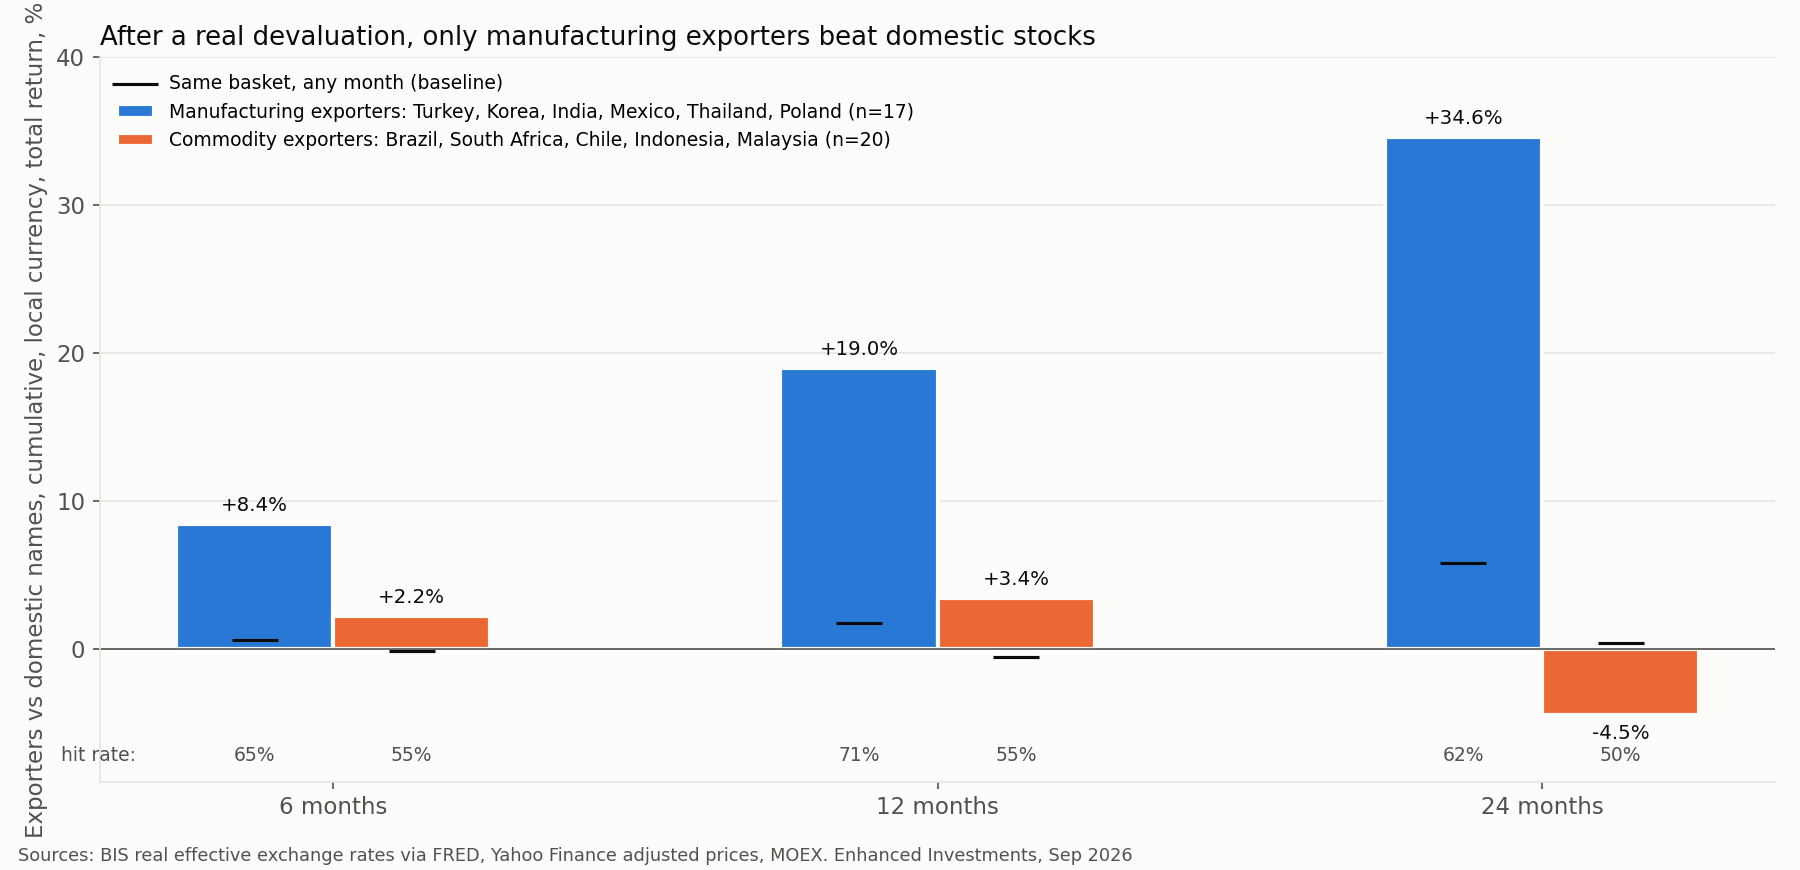
In the manufacturing group, Turkey, Korea, India, Mexico, Thailand and Poland, exporters led by 8.4% at six months, 19.0% at twelve and 34.6% at twenty-four, with hit rates of 65%, 71% and 62%. In any random month the same baskets lead by 1.7% at twelve months, so this is a real change in behavior, not a permanent tilt.
In the commodity group, Brazil, South Africa, Chile, Indonesia and Malaysia, exporters led by 2.2%, 3.4% and then trailed by 4.5%. The hit rates sit at 50-55%. The baseline for these baskets in a random month is zero. Nothing happened.
The likely mechanism, and this part is interpretation rather than measurement, is what caused the devaluation in the first place. A commodity currency usually falls because the commodity fell. Brazil in 2015, Colombia in 2014 and Russia in 2014 devalued alongside iron ore and oil, so the exporter's dollar revenue was collapsing at the same time its local costs were shrinking. A manufacturing exporter sells cars, chips, textiles or software at world prices that do not move with the lira or the won, while wages and local inputs drop in dollar terms. The margin expands and the stock reprices.
The sector cut says the same thing: factories won, mines and farms did not
Rebuilding the baskets by sector rather than by country gives 37 events across 11 countries and five sector groups. Twelve months after a real devaluation, relative to the domestic basket of the same country:
- Manufacturing, autos and electronics: +24.3% median, 16 events, 81% positive.
- Precious metals: +6.1%, 7 events, 57% positive (all South Africa).
- Energy: -4.4%, 9 events, 44% positive.
- Steel and base metals: -5.5%, 22 events, 45% positive.
- Agriculture, pulp and soft commodities: -10.7%, 16 events, 44% positive.
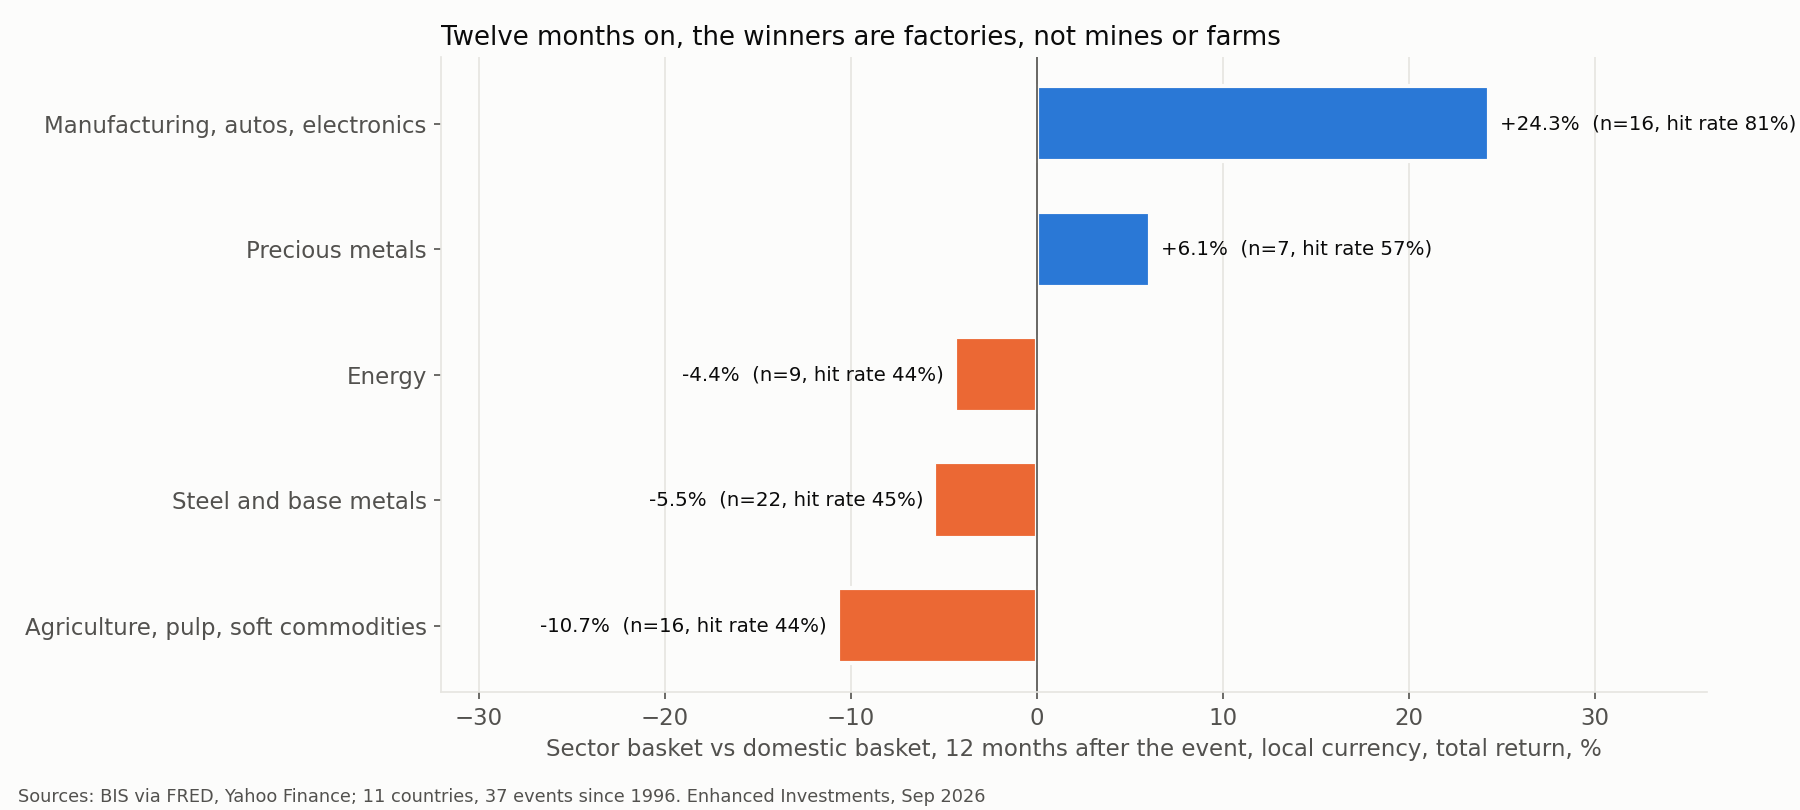
The manufacturing number holds when any one country is removed. Without Turkey, which supplies half the events, the median rises to +27.7% with 8 of 8 positive. Without Korea it is +21.2%, without Mexico +18.4%. Both failures in the group were Turkish, in August 2018 and July 2023, so the risk is concentrated in one country's policy history rather than spread across the sample.
Sixteen events is a small sample and the article does not pretend otherwise. It is enough to say that the direction is consistent and that the opposite claim, that commodity exporters are the trade, is not supported anywhere in the data.
Russia's five devaluations gave the same answer: steel and agriculture paid, gold and oil did not
Russia is the market where the "buy exporters after a devaluation" rule is quoted most often, so it deserves a separate look with local data. Prices and declared dividends come from the Enhanced Investments database rather than Yahoo. Five events qualify since 2011, in November 2014, November 2015, August 2020, March 2022 and March 2023. Two of them were driven by sanctions rather than by oil.
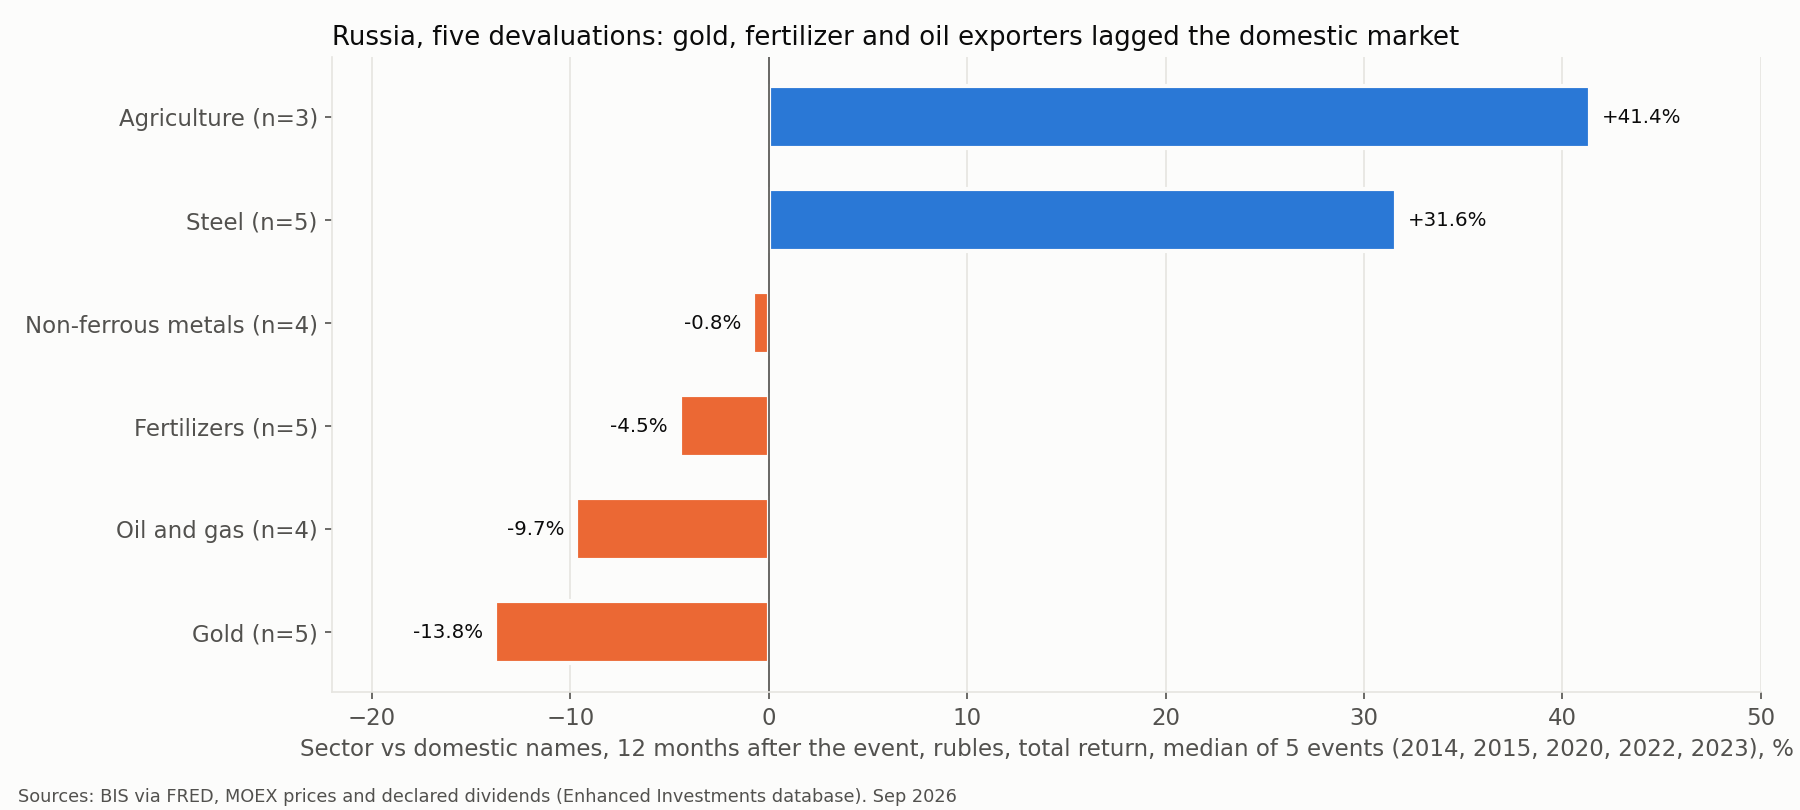
Twelve months on, relative to a basket of 18 domestic names, gold miners returned a median -13.8%, oil and gas -9.7%, fertilizers -4.5%, non-ferrous metals -0.8%. Steel returned +31.6% and agriculture +41.4%, the latter on only three events.
The comparison with the unconditional baseline is the useful part. In a random month, fertilizer producers beat the domestic basket by 8.2% and non-ferrous metals by 10.2%, so both sectors normally outperform and stop doing so after a devaluation. Steel normally trails by 3.9% and jumps to +31.6% after the event. Gold and grain are exchange-traded commodities that fell with the ruble in most of these episodes, and fertilizer prices follow gas and grain. Steel is the closest thing Russia has to a manufacturing export, and it behaved like one.
The idea that one should buy an exporter whose product is unrelated to the commodity that crashed sounds right and did not survive contact with the data. In Russia there are almost no such exporters. Gold, grain, fertilizer and oil are all priced on the same global dollar cycle.
Today: nothing has fired, but Indonesia, India and Korea are at decade lows and Latin America at highs
The trigger requires a 12% real drop in six months, and as of July 2026 no country in the panel is close. The largest six-month moves are Indonesia at -5.6% and Chile at -5.0%. So this is a playbook for the next crash, with a map of where the fuel is.
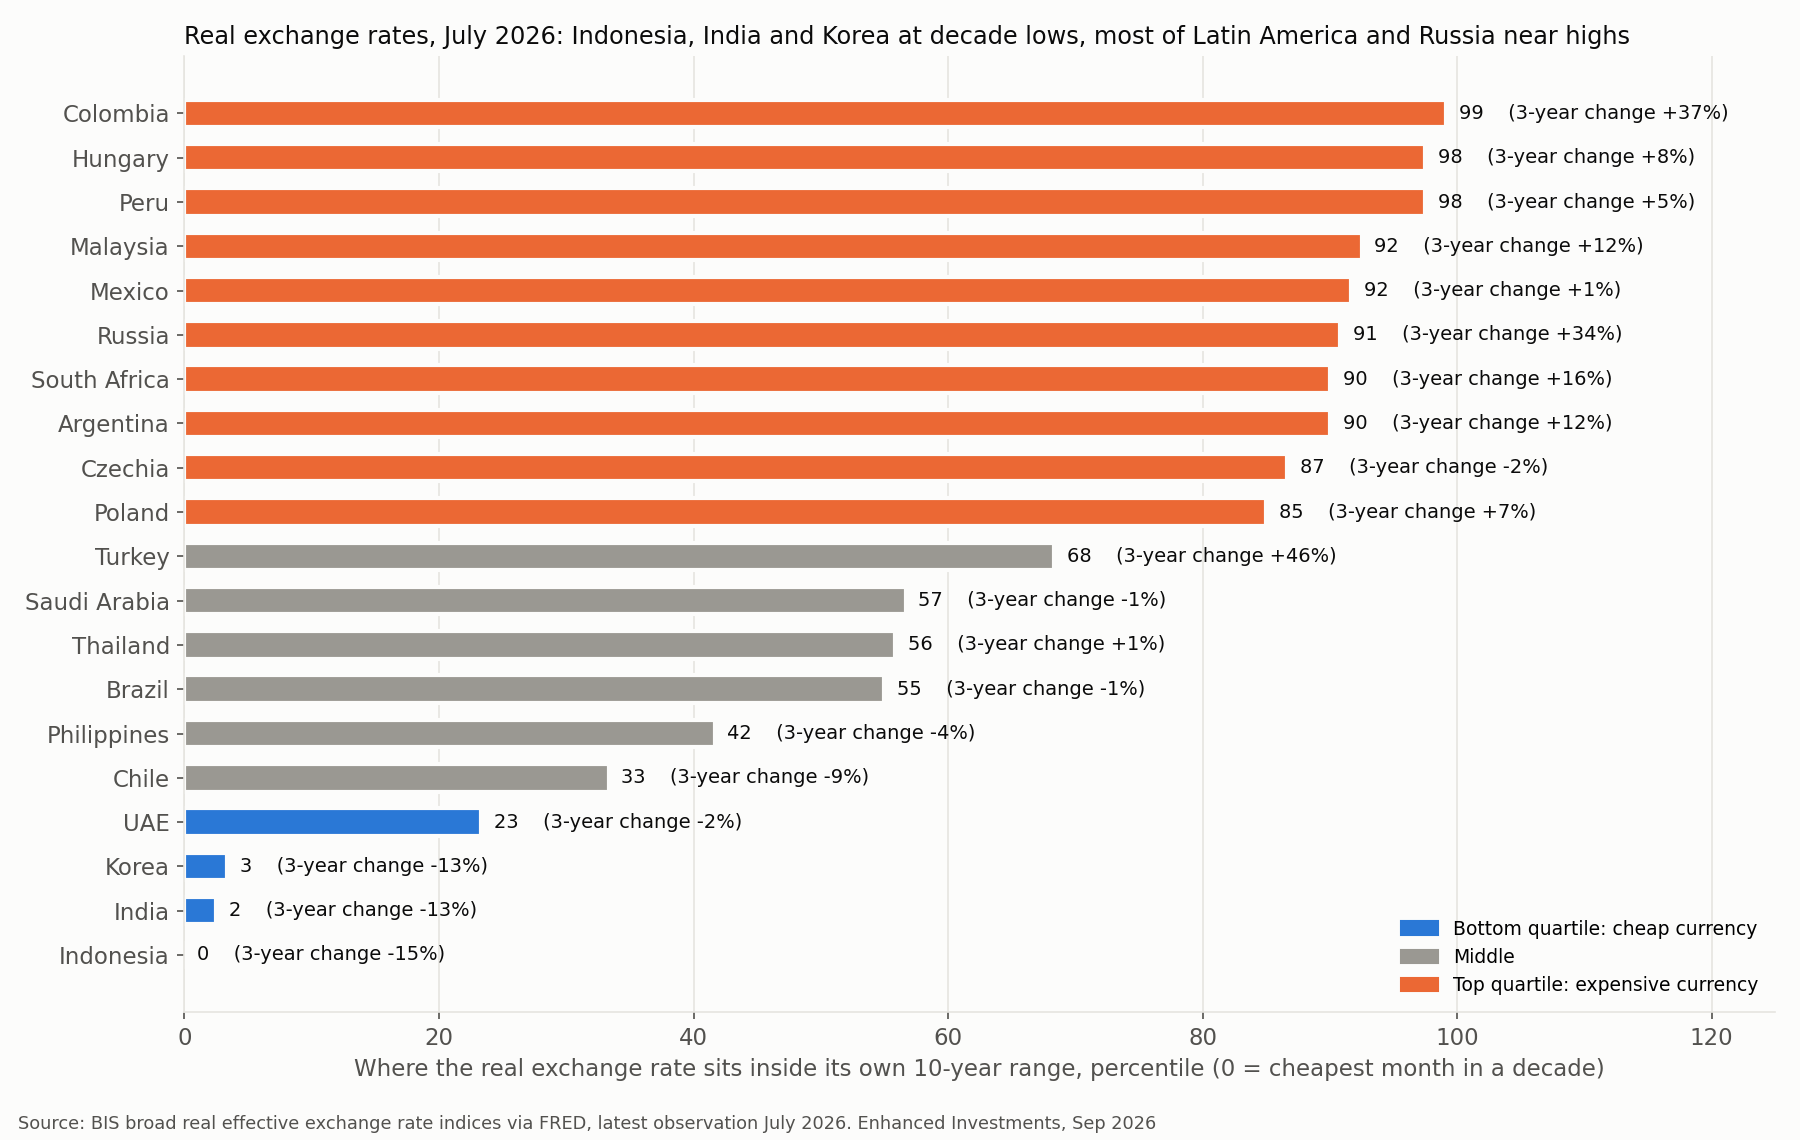
Three currencies sit at or near the bottom of their ten-year real ranges. Indonesia is at the zero percentile, down 15% in three years. India is at the second percentile and Korea at the third, both down 13%. None of them crashed. They slid, quarter after quarter, which is why the six-month trigger never fired. The cheap-quintile edge of roughly two points a year applies to them, and the manufacturing mechanism applies fully to Korea and to India's service exporters.
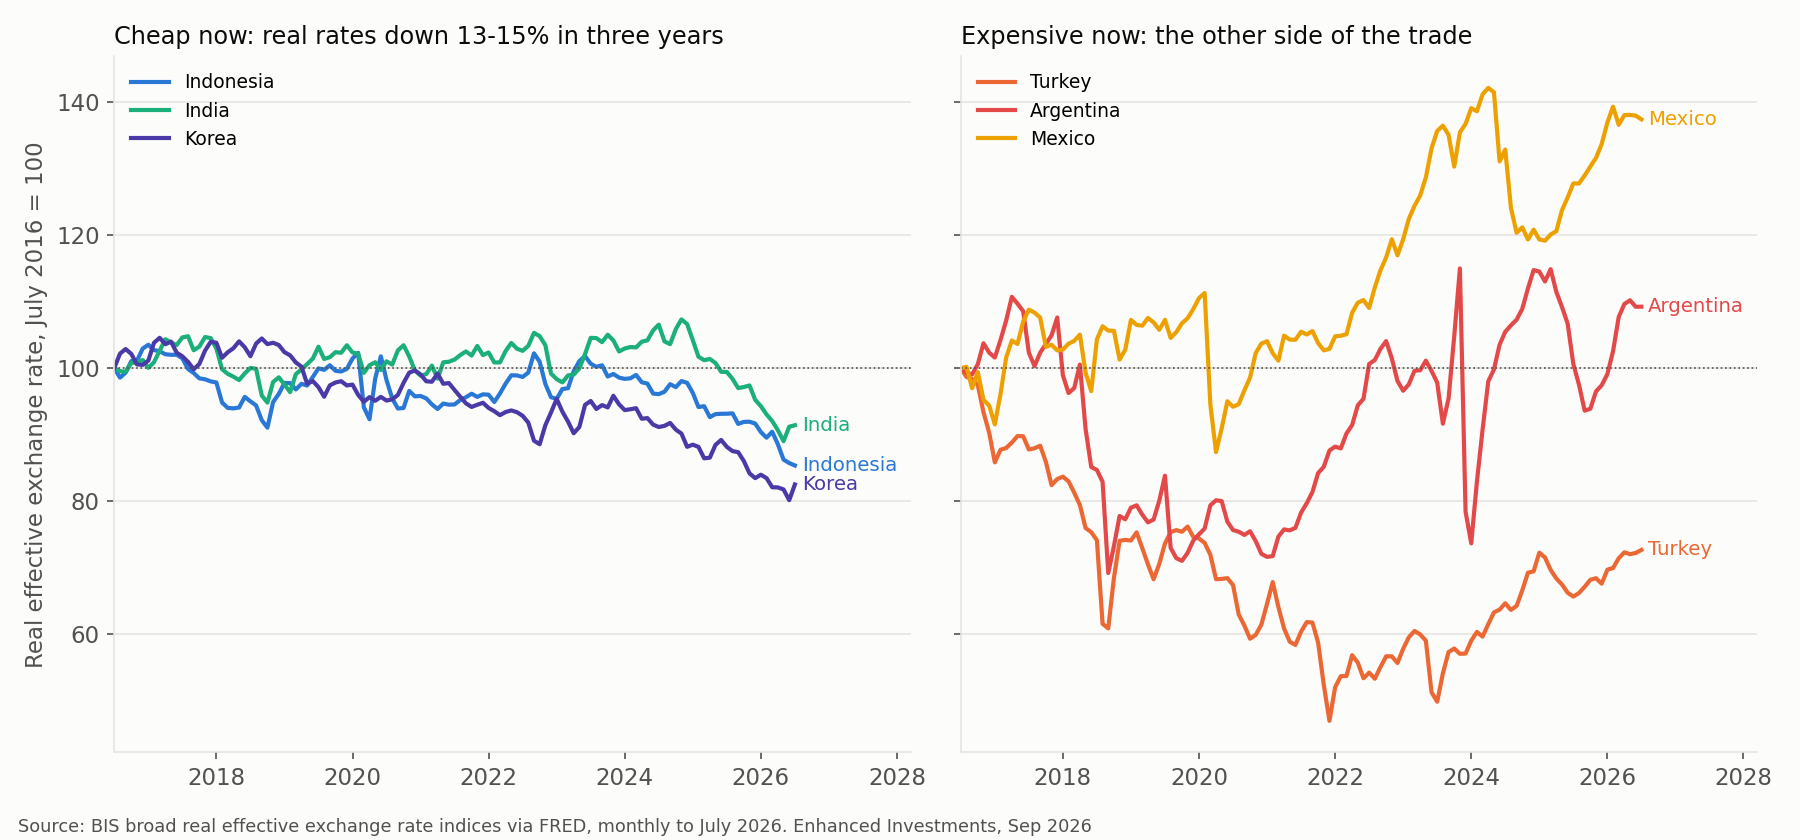
The expensive side is crowded. Colombia is at the 99th percentile after a 37% real appreciation in three years. Hungary and Peru are at the 98th. Malaysia, Mexico, Russia, South Africa and Argentina are all above the 90th. Turkey is at the 68th, but the path there is a 46% real appreciation in three years from the 2021 collapse, and the anti-event numbers above are the relevant precedent for it. Mexico's manufacturing exporters were the right trade in September 2024 and gained 21% on domestic names in a year. That year is over.
Indonesia is cheap, but Indonesia is a commodity currency. Its exporters are coal, nickel, tin and palm oil, and in the one Indonesian event in the sample, December 2013, they trailed domestic names by 11% over the following year. A cheap rupiah is an argument for Indonesian banks and consumer franchises, which is a different note, and we hold one of them. The exporter trade from this study points at Korea and India.
The candidates: Kia, Hyundai Mobis and the Indian IT services names, checked against two sources
We onboarded 22 Korean and 32 Indian companies onto the Frontier platform for this study, tilted toward exporters. Every multiple below was read from the company card on September 4, after the Korean cards were rebuilt from second-quarter 2026 filings, and then checked against StockAnalysis the same day. Where the two sources disagree, both numbers are shown.
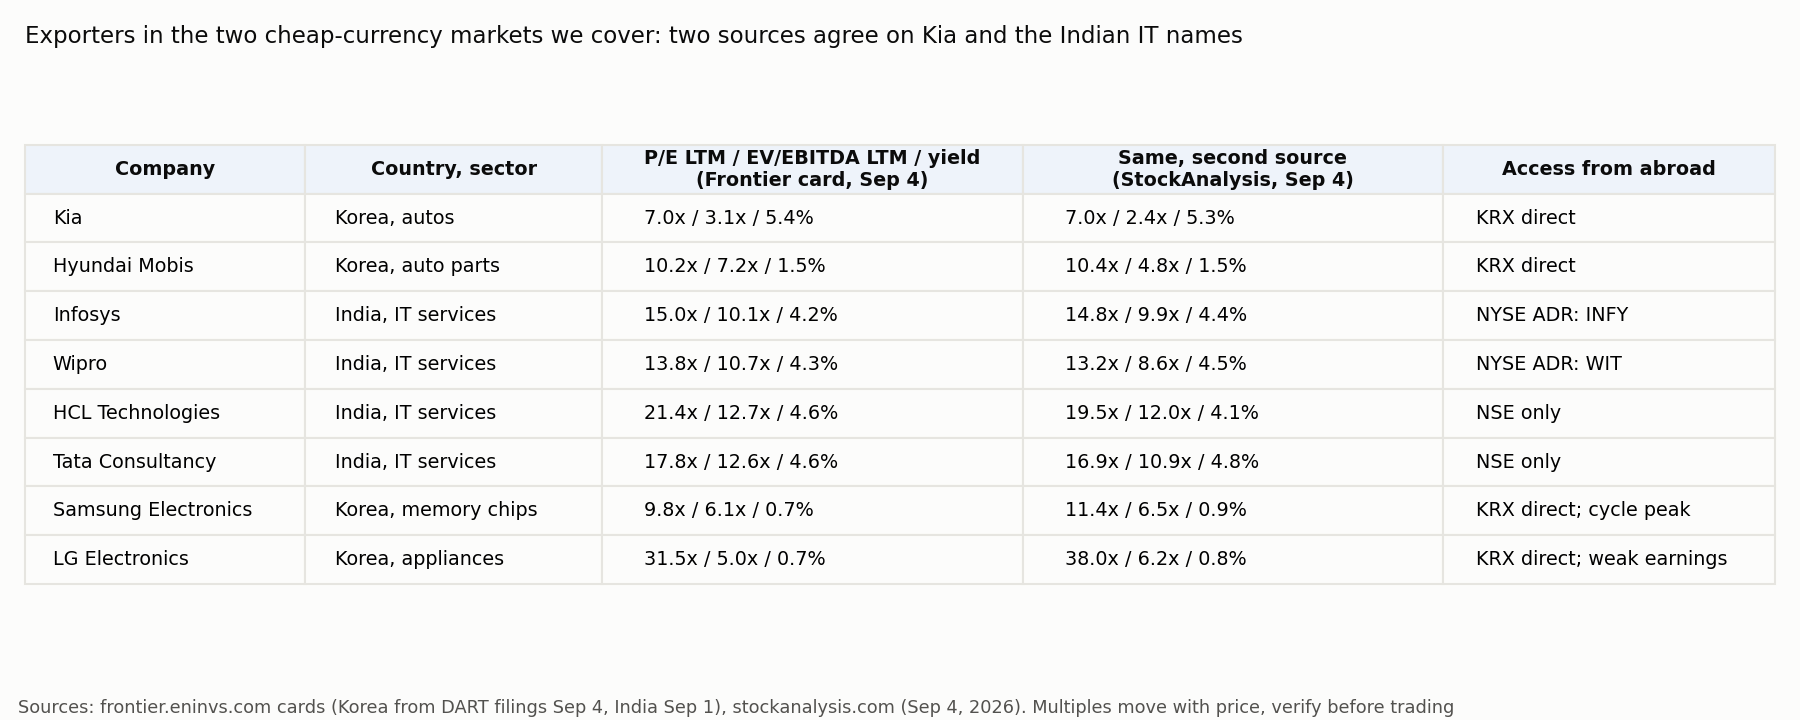
Kia is the cleanest case. Both sources put it at a P/E of 7, EV/EBITDA between 2.4x and 3.1x depending on how the finance arm's debt is treated, and a dividend yield above 5%. Revenue grew 13% over the last year through the second quarter of 2026, and the balance sheet is net cash. Korean autos sell in dollars and euros with won costs, which is exactly the profile that worked in the sample.
Hyundai Mobis trades at about 10 times earnings and 0.7-0.9 times book. The two sources disagree on EV/EBITDA, 4.8x against 7.2x, for the same reason as Kia, and either number is low for a top-tier auto parts supplier.
India's IT services exporters bill in dollars and pay in rupees, and four of them now yield 4-5% in dividends. Infosys trades at 15 times earnings and 10 times EBITDA. Wipro is at 13 times earnings and 9-11 times EBITDA. HCL Technologies and Tata Consultancy are at 17-21 times earnings with the same yields. Their revenue growth is 3-14% and their margins are 21-27%, so the cheap rupee shows up as margin rather than as growth.
Samsung Electronics and SK hynix dominate the Korean index and both screen cheap on trailing numbers, about 10 times earnings for Samsung and 7 for SK hynix, but those earnings come from a memory-price cycle that more than doubled revenue in a year. A memory-price story is a different bet from a currency story, so they are shown for reference and left out of the recommendations. LG Electronics is excluded because it earns too little for its price, 31-38 times trailing earnings depending on the source.
Access from abroad differs. The Korean exchange is open to foreign retail investors through Interactive Brokers once Korea trading permission is enabled in the client portal. India's exchange is closed to non-residents without an FPI license, so Infosys and Wipro are reachable only through their New York ADRs, and HCL Technologies and Tata Consultancy are not reachable at all outside India.
What can go wrong with this study
The sample is small and overlapping. There are 48 index events and 37 basket events, and nine of them fall within six months of each other in 2008-2009. Treating them as independent overstates the confidence.
The baskets are built from stocks that trade today. Companies that were exporters in 2001 and have since been delisted, nationalized or merged are not in the sample, which flatters every basket by an unknown amount.
Prices come from one source, Yahoo Finance adjusted closes, and real exchange rates from one source, the BIS via FRED. Neither has been cross-checked for the full history. The Russian numbers use our own database and are more reliable.
The real exchange rate is published with a six-week lag, so the signal is known later than the chart suggests. An investor acting on the July 2026 reading is acting in mid-September.
The multiples in the table move with price every day. The card and the second source are dated, and anyone trading on them should re-pull both.
Where to look next
The company cards for the Korean and Indian coverage are live on the platform, with reconciled financials and export profiles for each name. The Bank Mandiri note referenced above is at the Indonesia section.
The platform subscription is at [eninvs.com/upgrade.php](https://eninvs.com/upgrade.php), and the channel is t.me/eninv.
See also: market overview · valuation map · stock screeners