Fix Price: profit fell 30%, yet it pays out nearly all it earns — a 28% yield against a 14% policy rate
On 27 August Fix Price released its results for the first half of 2026. Revenue rose 4.8% year on year to RUB 155.3 bn, EBITDA added 3.6%, while net profit fell 30.0% to RUB 2.7 bn, with a net margin of 1.8% against 2.6% a year earlier. The stock trades at a P/E of 3.9 and EV/EBITDA of 1.14 against its own three-year average of 2.42, and the trailing dividend yield is 28.1% against a 14.0% policy rate. For a name held for the payout, this looks rather attractive: the multiple sits below its own history and the dividend covers the policy rate twice over.
Key takeaways
— Revenue added 4.8%, and retail rather than wholesale delivered almost all of the growth
— EBITDA rose 3.6%, but the margin stayed at 10.9% — costs ate the gain
— Net profit fell 30% on interest expense and a FX loss, not on trading
— Operating cash flow of RUB 18.5 bn covered RUB 4.5 bn of capex and RUB 10.3 bn of dividends
— Net debt rose from RUB 3.1 bn at end-2025 to RUB 6.1 bn, but that is just 0.17 of LTM EBITDA
— The trailing dividend is RUB 0.11 per share, a 28.1% yield against a 14.0% policy rate
— At 1.14 EV/EBITDA against its own three-year average of 2.42, the stock is at a discount to its own history
Attractiveness
Key figures, RUB bn
| Metric | H1 2025 | H1 2026 | Change |
|---|---|---|---|
| Revenue | 148 | 155 | +4.8% |
| EBITDA | 16.4 | 17.0 | +3.6% |
| Operating profit | 7.33 | 6.66 | -9.1% |
| Net profit | 3.90 | 2.73 | -30.0% |
| Operating cash flow | 17.4 | 18.5 | +6.4% |
| Capex | 4.41 | 4.51 | +2.3% |
| EBITDA margin | 11.0% | 10.9% | -0.1 pp |
| Net margin | 2.6% | 1.8% | -0.8 pp |
Revenue added 4.8%, and retail rather than wholesale delivered almost all of the growth
Revenue for the first half of 2026 came to RUB 155.3 bn against RUB 148.2 bn a year earlier, up 4.8%. Retail revenue rose to RUB 138.2 bn from RUB 129.5 bn, a gain of RUB 8.7 bn, while wholesale shrank to RUB 17.1 bn from RUB 18.7 bn, a drop of RUB 1.5 bn. In other words, retail contributed more growth than the whole business showed in aggregate, and wholesale dragged the result down.
Wholesale works with entities under common control in Belarus and Kazakhstan and with franchisees, so its decline is not a loss of retail customers. Retail dynamics matter more: they reflect footfall and average ticket in the fixed-price stores, and their 6.7% year-on-year growth shows the chain keeps adding sales.
For a shareholder this means the top line remains sound: even against a weak consumer backdrop the chain is growing. The question is not revenue but what happens below it.
EBITDA rose 3.6%, but the margin stayed at 10.9% — costs ate the gain
EBITDA for the first half of 2026 was RUB 17.0 bn, up 3.6% year on year. The EBITDA margin was 10.9% against 11.0% a year earlier, so the margin was essentially flat. Revenue growth of 4.8% against EBITDA growth of 3.6% is a gap of 1.2 percentage points, showing costs are rising slightly faster than sales.
Selling, general and administrative expenses rose to RUB 44.7 bn from RUB 39.3 bn, adding RUB 5.4 bn, or 13.8%. The main contributor was staff costs: RUB 28.4 bn against RUB 24.6 bn a year earlier, up 15.4%. That is markedly faster than revenue, and it is where the margin is losing its footing.
Operating profit for the half-year was RUB 6.7 bn against RUB 7.3 bn a year earlier, down 9.1%. EBITDA is still growing while operating profit is already falling, because depreciation of right-of-use assets rose to RUB 6.9 bn from RUB 6.1 bn. The chain is expanding, and leases are eating a growing share of the operating result.
For a shareholder this is the key point: the business is growing in revenue but not in profit. The margin is flat, and without slower growth in staff and lease costs there is no reason to expect improvement.
Net profit fell 30% on interest expense and a FX loss, not on trading
Net profit for the first half of 2026 was RUB 2.7 bn against RUB 3.9 bn a year earlier, down 30.0%. The net margin was 1.8% against 2.6% a year earlier. Pre-tax profit fell to RUB 3.8 bn from RUB 5.4 bn, and the gap between operating profit and pre-tax profit is explained by financial items.
Interest expense was RUB 2.7 bn against RUB 2.8 bn a year earlier, almost unchanged. But the FX loss was RUB 0.4 bn against a RUB 0.9 bn gain a year earlier, a swing of RUB 1.2 bn. That swing, together with higher depreciation, explains most of the fall in net profit.
Operating profit fell by RUB 0.7 bn, the FX result worsened by RUB 1.2 bn, and income tax fell to RUB 1.0 bn from RUB 1.5 bn — the net profit decline of RUB 1.2 bn is the sum of these moves. Trading is not the issue here: the weakness in profit sits in financial items and depreciation.
For a shareholder this matters because FX differences are a volatile item and can swing either way. But lease depreciation is structural and will grow with the chain.
Operating cash flow of RUB 18.5 bn covered RUB 4.5 bn of capex and RUB 10.3 bn of dividends
Cash generated from operations in the first half of 2026 was RUB 18.5 bn against RUB 12.7 bn a year earlier. That is well above net profit because the flow includes depreciation of RUB 10.3 bn and working capital movements. The company collected cash from customers and reduced inventories by RUB 1.2 bn.
Capital expenditure on property, plant and equipment and intangibles was RUB 4.5 bn against RUB 4.4 bn a year earlier. The main investments are leasehold improvements and store equipment, so the money goes into expanding and refreshing the chain. Free cash flow after capex is around RUB 14.0 bn.
Dividends paid in the half-year were RUB 10.3 bn — the interim dividend for the first quarter of 2026, declared at RUB 11.0 bn including withholding tax. The payout is fully covered by operating cash flow, leaving about RUB 3.7 bn of free funds.
Lease payments were RUB 6.7 bn against RUB 6.0 bn a year earlier, and they are already reflected in operating cash flow through interest and principal payments. Total lease outflow including interest was RUB 9.5 bn against RUB 8.2 bn a year earlier. This is a growing item, and it competes with the dividend for the same cash flow.
Net debt rose from RUB 3.1 bn at end-2025 to RUB 6.1 bn, but that is just 0.17 of LTM EBITDA
Net debt at 30 June 2026 was RUB 6.1 bn. At end-2025 it was RUB 3.1 bn, so it rose by RUB 3.1 bn over six months. A year earlier, at 30 June 2025, net debt was RUB 5.0 bn, and over 12 months it rose by RUB 1.2 bn. The increase is tied to large dividend payments: the company paid RUB 10.3 bn in the half-year.
The ratio of net debt to LTM EBITDA is 0.17. That is a very low level: debt is covered by less than two months of EBITDA. By comparison, the company services interest easily: interest expense for the half-year was RUB 2.7 bn against EBITDA of RUB 17.0 bn for the same period.
Loans and borrowings on the balance sheet are RUB 1.3 bn long-term and RUB 7.7 bn short-term, RUB 9.0 bn in total. Cash meanwhile fell to RUB 2.9 bn from RUB 9.5 bn at end-2025 — the company spent its savings on dividends. That is normal for a business generating RUB 18.5 bn of operating cash flow in a half-year.
For a shareholder this means debt is not a risk. Even with higher rates the company services it without strain, and the low debt base leaves room for further payouts.
The trailing dividend is RUB 0.11 per share, a 28.1% yield against a 14.0% policy rate
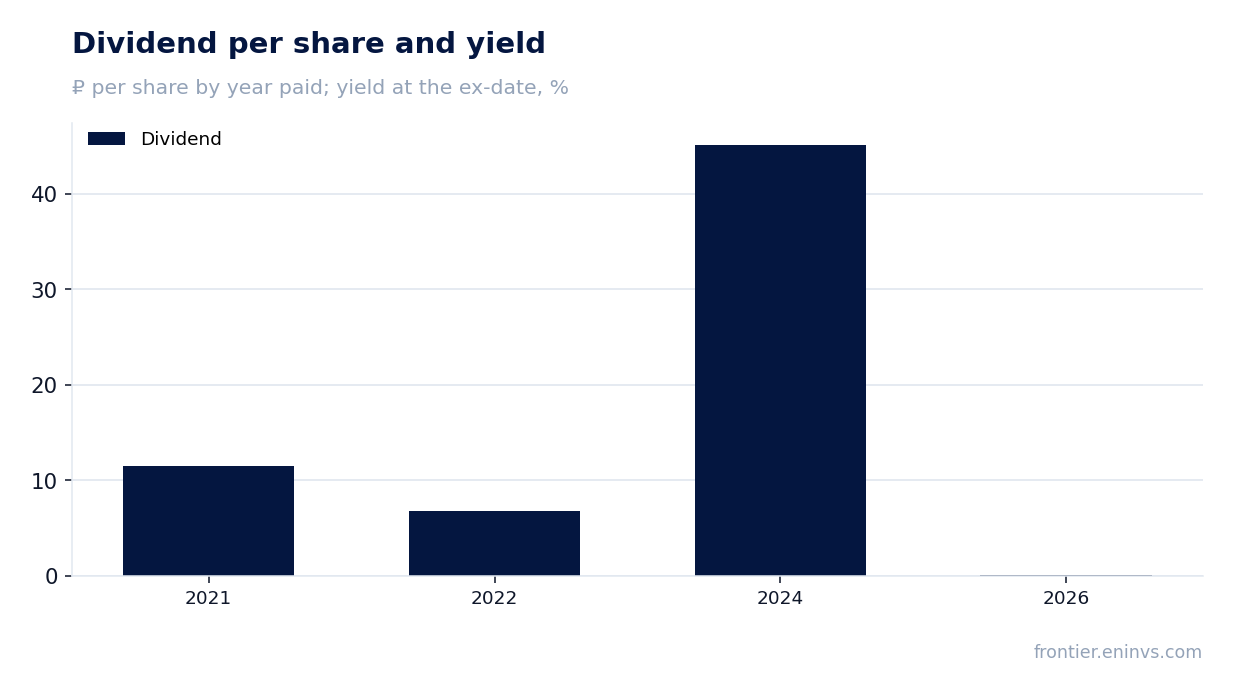
Over the last 12 months Fix Price paid RUB 0.11 per share, a yield of 28.1% on the current price. That is well above the 14.0% policy rate and above the 27.1% yield we consider fair for this name. The payout for the first half of 2026 was RUB 10.3 bn, or RUB 0.11 per share, fully covered by operating cash flow.
Our own estimate for the current financial year, to be paid next year, is RUB 0.10 per share, a 25.4% yield on the current price. We calculate it as 98% of LTM net profit divided by the number of shares — the share of profit the company actually paid out last year. This is our estimate, not a board decision: the board sets the payout.
Fix Price's dividend history is uneven: RUB 11.5 per share for 2021, RUB 6.8 for 2022, RUB 45.15 for 2024 and RUB 0.11 for 2026. The range is huge and reflects both the change in share count after the GDR exchange and the change in profit. The current payout is 96% of profit, meaning the company distributes almost everything it earns.
What could make the payout smaller: a further fall in net profit, higher lease payments and capex, and the need to maintain liquidity while repaying short-term loans. With a payout ratio of 0.96 there is almost no room for manoeuvre — any decline in profit hits the dividend directly.
At 1.14 EV/EBITDA against its own three-year average of 2.42, the stock is at a discount to its own history
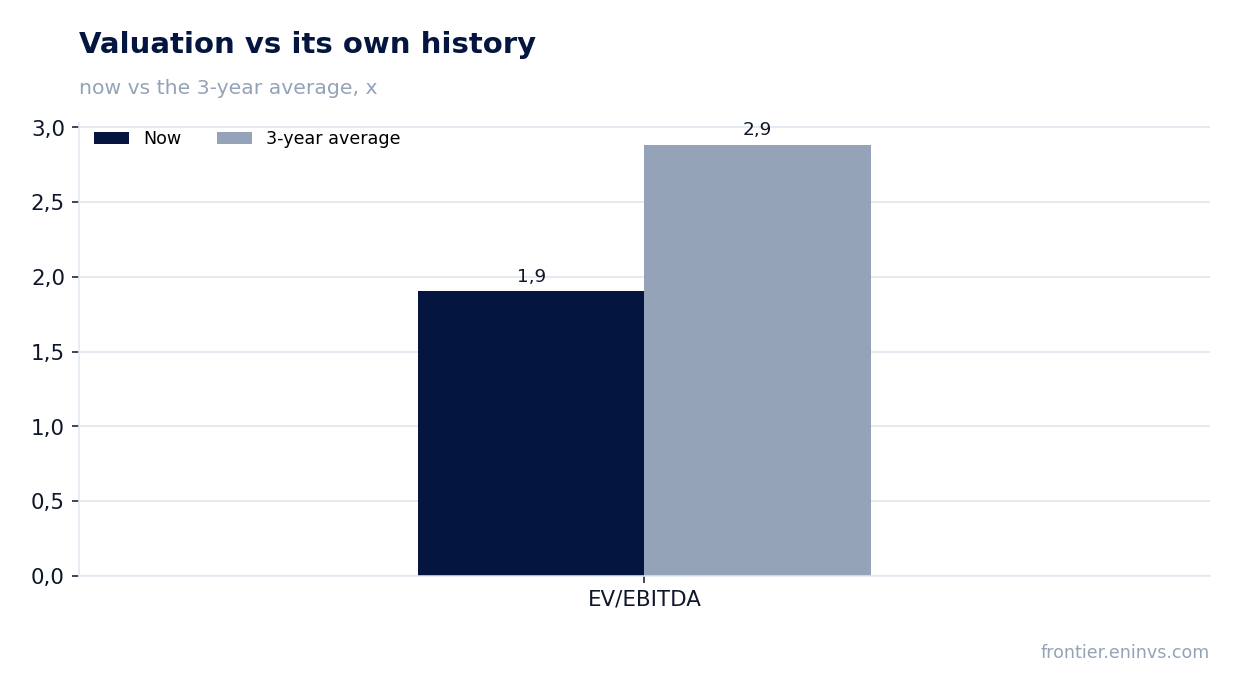
Fix Price trades at an LTM EV/EBITDA of 1.14 against its own three-year average of 2.42. That is less than half the historical level. The LTM P/E is 3.9. Market capitalisation is RUB 38.7 bn against net debt of RUB 6.1 bn and LTM EBITDA of RUB 36.7 bn.
Our fundamental valuation model, which weighs EBITDA growth against a target multiple, puts the upside to fair value at +11%. This is our own estimate on the portal's model, not a market consensus or a target price.
The discount to its own history is explained by the fall in net profit and uncertainty around the dividend. But an EV/EBITDA of 1.14 means the market values the entire business at less than it generates in EBITDA in a year. With stable operating cash flow and low debt, this creates asymmetry: even a modest profit recovery could trigger a re-rating.
LTM ROE is 9.6%. That is not high for a business with such a low capital base, but it is explained by the large share of leases in the cost structure. For a shareholder the main thing is not ROE but the company's ability to sustain the payout.
Valuation on the latest reported figures
| Metric | Value |
|---|---|
| Market cap | 38.7 bn ₽ |
| P/E (LTM) | 3.9 |
| EV/EBITDA (LTM) | 1.1 |
| P/B | 0.64 |
| Net debt / EBITDA (LTM) | 0.17 |
| Operating cash flow (LTM) | 42.9 bn |
| ROE | 9.6% |
| Dividend yield (12m) | 28.1% |
| EV/EBITDA, 3-year average | 2.4 |
Dividend per share, ₽, and yield at the ex-date
| Year paid | Dividend | Yield |
|---|---|---|
| 2021 | 11.50 | — |
| 2022 | 6.80 | — |
| 2024 | 45.15 | — |
| 2026 | 0.11 | 17.1% |
| Our estimate, current year | 0.10 | 25.4% on the current price |
Bottom line
Fix Price showed revenue growth of 4.8% and EBITDA growth of 3.6%, but net profit fell 30% on interest expense, an FX loss and rising lease depreciation. Operating cash flow of RUB 18.5 bn comfortably covered capex and dividends, and net debt of RUB 6.1 bn is just 0.17 of LTM EBITDA. The 28.1% dividend yield is more than double the policy rate, and the 1.14 EV/EBITDA multiple is half its own three-year average. Our estimate for the current year's dividend is RUB 0.10 per share, a 25.4% yield on the current price. The key question for a holder is whether the company can sustain the payout at a 0.96 ratio with staff and lease costs rising.
Open the company's financial profile FIXR →
See also: market overview · valuation map · stock screeners