IVA Technologies: revenue fell 8.5% and EBITDA turned negative – profit no longer rests on operations
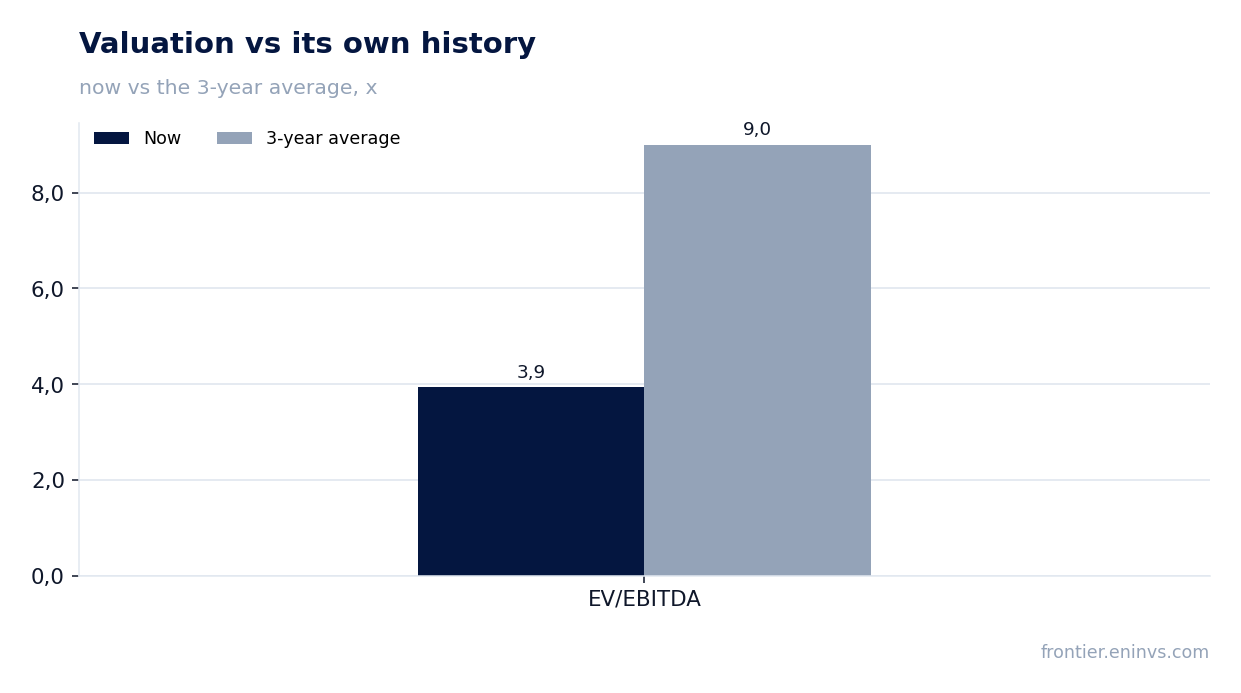
On 5 November IVA Technologies released its results for the second quarter of 2026. Revenue fell 8.5% year on year to RUB 489.3 mn, EBITDA came in at minus RUB 179.8 mn against RUB 276.0 mn a year earlier, and net profit was RUB 43.1 mn against RUB 153.8 mn. Yet the stock trades at 3.9x LTM EV/EBITDA against its own three-year average of 9.0, and the portal's model puts fair value 31% below the market – at the current price the share looks rather unattractive, because the cheap multiple rests on profit that operations no longer generate.
Key takeaways
— Q2 2026 revenue fell 8.5% year on year to RUB 489.3 mn – the second consecutive quarter of decline
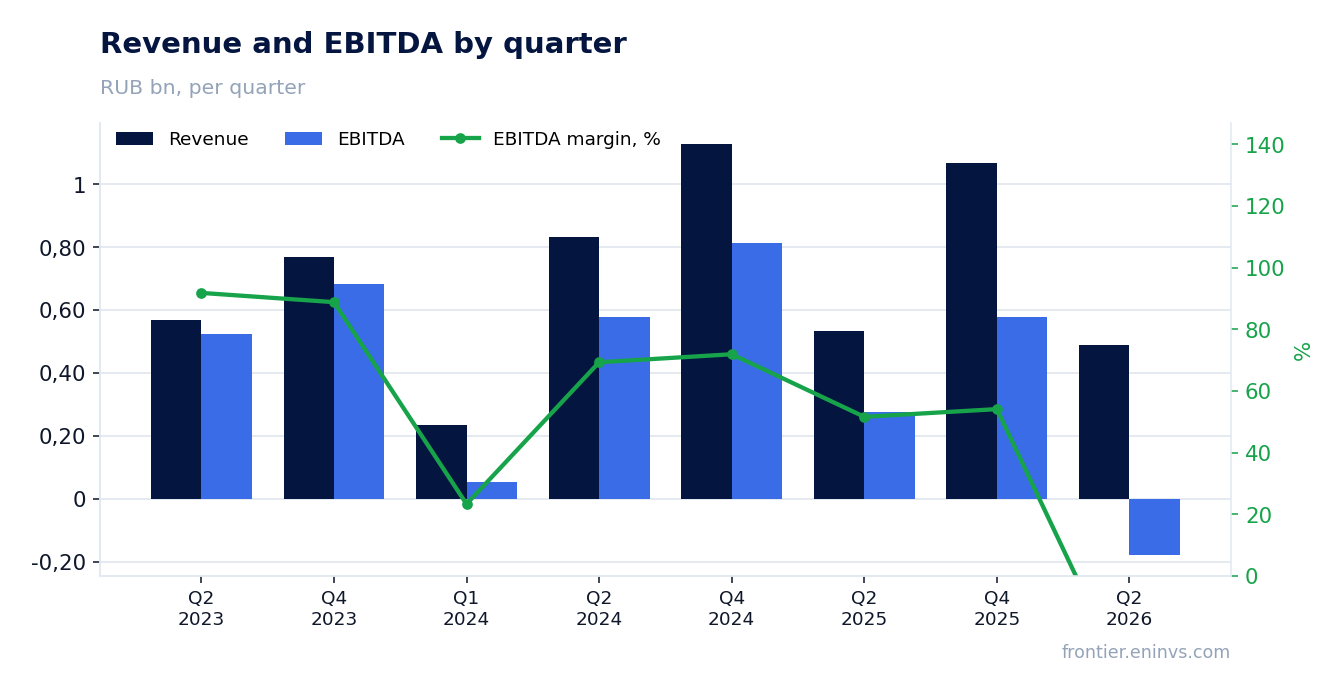
— Q2 EBITDA turned negative at minus RUB 179.8 mn, with a margin of minus 36.7% against 51.6% a year earlier
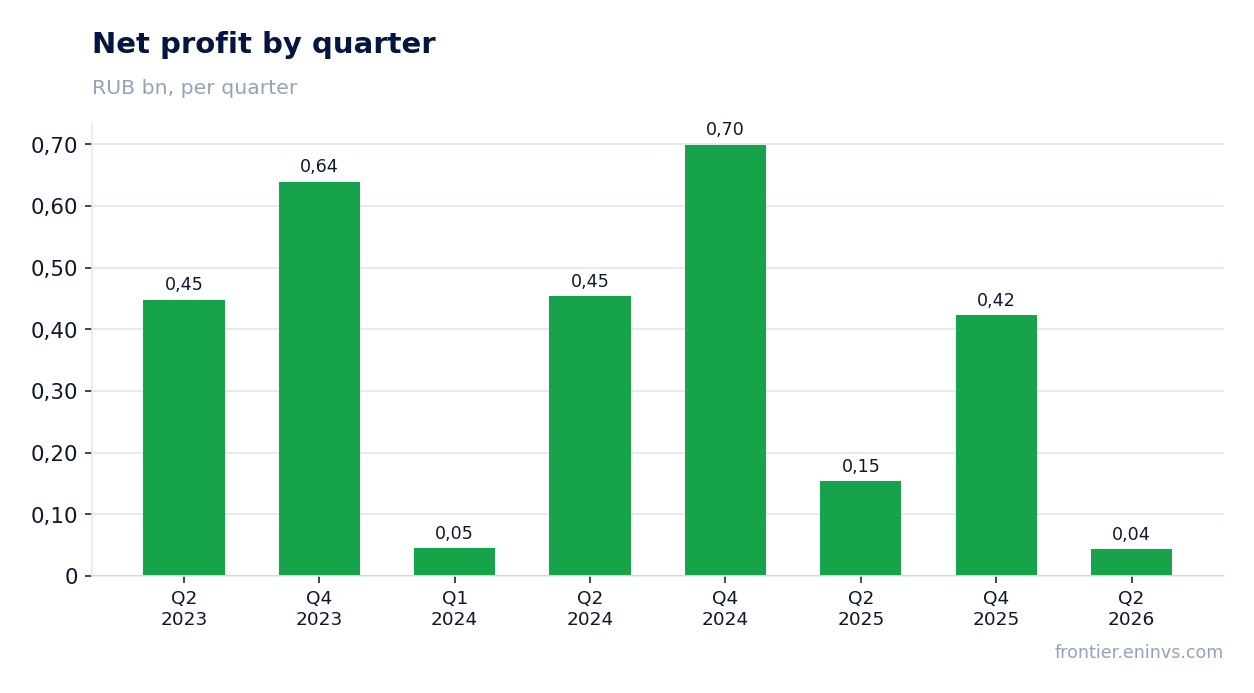
— Net profit of RUB 43.1 mn alongside negative EBITDA means the result rests on lines below the operating line
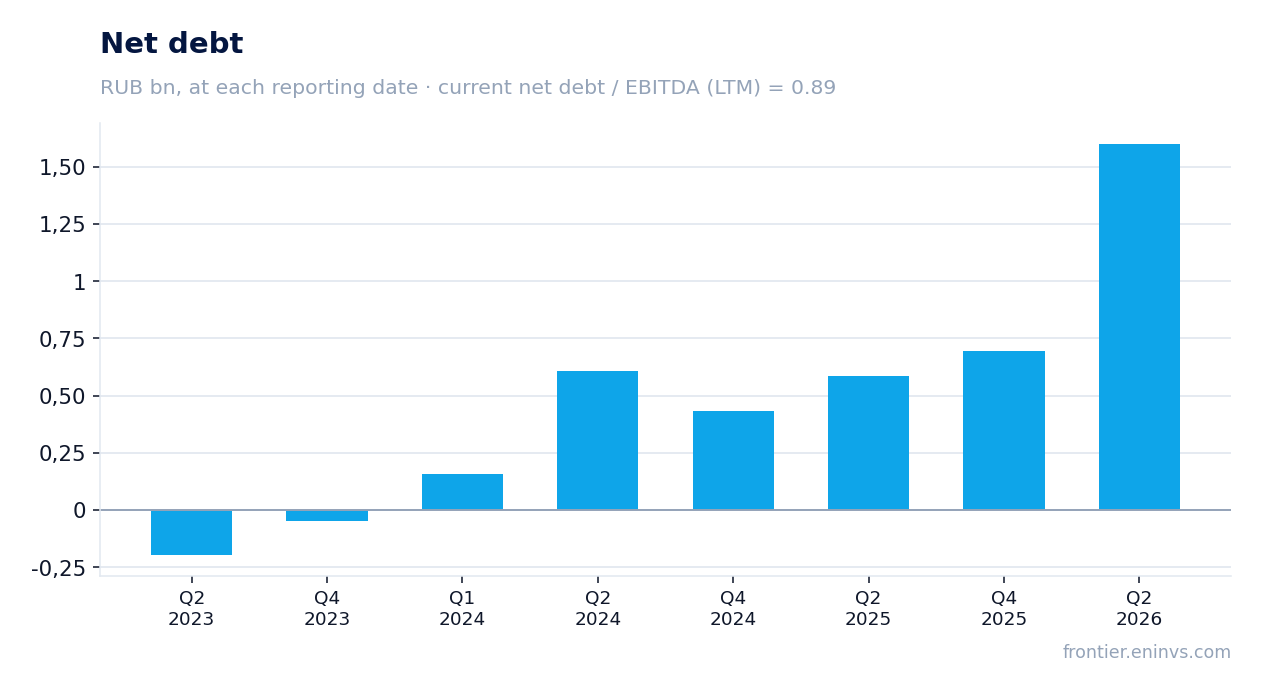
— Net debt rose from RUB 0.6 bn on 30 June 2025 to RUB 1.6 bn on 30 June 2026, while quarterly capex reached RUB 86.8 mn
— The 2025 dividend was RUB 3.0 per share; our estimate for the current year is the same RUB 3.0, a 4.5% yield against the 7.0% we consider fair
— LTM EV/EBITDA is 3.9 against its own three-year average of 9.0, but the cheapness is deceptive: the profit base is unstable
— On the portal's model fair value is 31% below the market – investors are paying for profit the report does not show
Attractiveness
Key figures, RUB bn
| Metric | Q2 2025 | Q2 2026 | Change |
|---|---|---|---|
| Revenue | 0.53 | 0.49 | -8.5% |
| EBITDA | 0.28 | -0.18 | -165.2% |
| Operating profit | 0.26 | -0.21 | -180.0% |
| Net profit | 0.15 | 0.04 | -72.0% |
| Operating cash flow | 0.46 | — | — |
| Capex | 0.00 | 0.09 | +4262.3% |
| EBITDA margin | 51.6% | -36.7% | -88.3 pp |
| Net margin | 28.8% | 8.8% | -20.0 pp |
Q2 2026 revenue fell 8.5% year on year to RUB 489.3 mn – the second consecutive quarter of decline
In Q2 2026 revenue was RUB 489.3 mn, 8.5% less than a year earlier. This is the second consecutive quarterly decline: the previous reporting quarter saw a deeper fall, and the current figures confirm the company has not yet returned to growth.
For comparison: in 2024 quarterly revenue grew 46.6% year on year, while in 2025 the dynamic reversed. The reason for the reversal is not disclosed in the report, and we do not attempt to name it. What matters is that the decline is happening alongside rising capex – the company is investing, but the return in revenue is not yet visible.
An 8.5% revenue decline combined with rising costs means operating leverage is working against the company. Each ruble of revenue now brings less than a year ago, and this shows up at every level of profit.
Q2 EBITDA turned negative at minus RUB 179.8 mn, with a margin of minus 36.7% against 51.6% a year earlier
Q2 2026 EBITDA was minus RUB 179.8 mn against RUB 276.0 mn a year earlier – a 165.2% decline. The margin turned negative at minus 36.7% from 51.6% a year earlier. Operating profit is also negative at minus RUB 206.4 mn.
This movement means the company is not covering operating expenses with revenue. With revenue of RUB 489.3 mn, negative EBITDA of RUB 179.8 mn indicates that costs grew faster than revenue or revenue fell faster than the company could cut costs. The report does not detail the cause.
For a holder this is a key signal: the company's business model did not generate operating profit in the current quarter. Restoring the margin to last year's levels will require either revenue growth or cost cuts, and both processes will take more than one quarter.
Net profit of RUB 43.1 mn alongside negative EBITDA means the result rests on lines below the operating line
Q2 2026 net profit was RUB 43.1 mn against RUB 153.8 mn a year earlier – a 72.0% decline. The net margin fell to 8.8% from 28.8%. At the same time EBITDA is negative and operating profit is minus RUB 206.4 mn.
The gap between negative operating profit and positive net profit means the result was formed by lines below the operating line. The facts do not disclose what those lines are, but what matters for an investor is that the profit is not supported by operating activity.
Such profit is unstable by nature: it may disappear next quarter if the one-off items do not repeat. Relying on it when valuing the company is risky, which is why multiples built on net profit can be misleading.
Net debt rose from RUB 0.6 bn on 30 June 2025 to RUB 1.6 bn on 30 June 2026, while quarterly capex reached RUB 86.8 mn
Net debt on 30 June 2026 was RUB 1.6 bn against RUB 0.6 bn on 30 June 2025 – an increase of RUB 1.0 bn over the year. Since the start of the year debt rose from RUB 0.7 bn on 31 December 2025 to RUB 1.6 bn on 30 June 2026, i.e. by RUB 0.9 bn.
The ratio of net debt to LTM EBITDA is 0.89. This is a level, not a direction: we cannot compare it with past values because the facts do not provide an earlier figure. Absolute debt has risen, and that matters in itself.
Q2 capex was RUB 86.8 mn against RUB 2.0 mn a year earlier. Rising capex alongside falling revenue and negative EBITDA means the company is financing investment partly with debt. This explains the rise in net debt and creates pressure on future results.
The 2025 dividend was RUB 3.0 per share; our estimate for the current year is the same RUB 3.0, a 4.5% yield against the 7.0% we consider fair
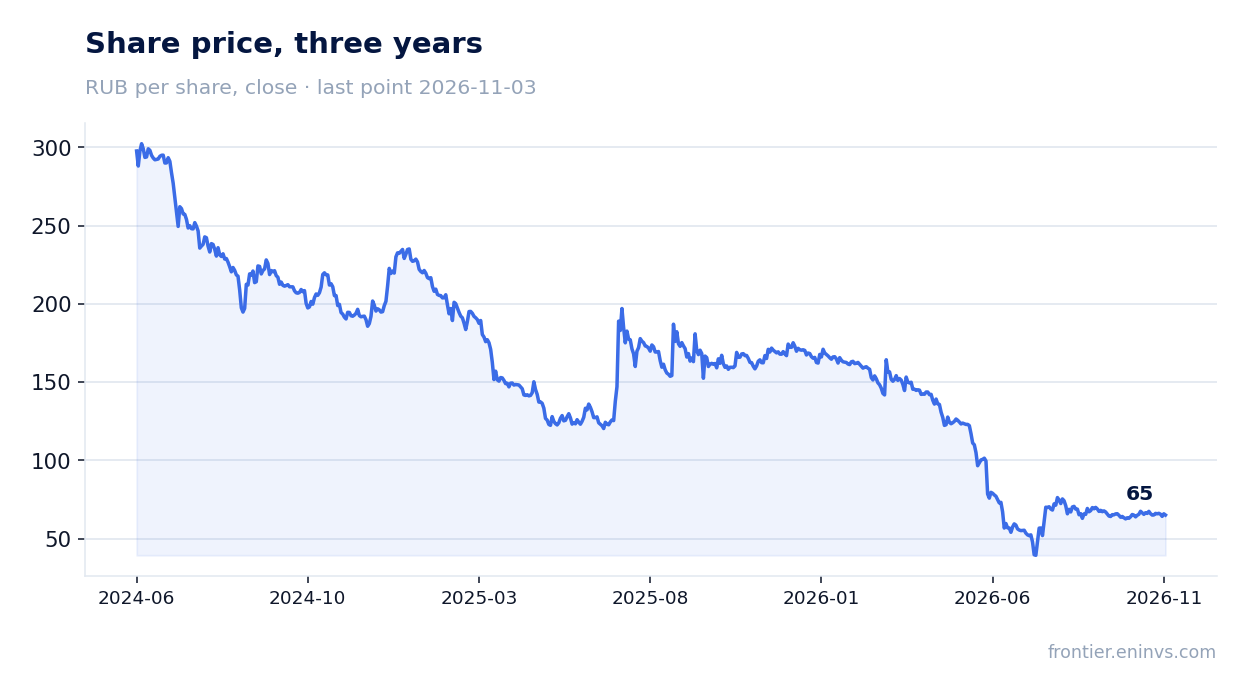
For 2025 the company paid RUB 3.0 per share – the only payment recorded in the facts. At the ex-date price of RUB 124.4 the yield was 2.4%. Our estimate of the annual dividend for the current year is also RUB 3.0 per share, which at the current price of RUB 66.65 gives a forward yield of 4.5%.
The estimate rests on the dividend-potential model with a payout ratio of 0.15 of profit and a profit base of RUB 1,202.0 mn over the last twelve months. The free cash flow cap does not bind the payment. However, the profit base is unstable: in Q2 net profit was only RUB 43.1 mn with negative EBITDA, and if the one-off items do not repeat, profit over the next twelve months may be lower.
A 4.5% yield is below the 14.0% key rate and below the 7.0% we consider fair for this name. For the company's dividend history this is a modest level: the market demands a higher premium for the risk tied to unstable operating results.
The payment could be smaller if full-year profit falls more than expected or if the company directs more funds to capex, which has already risen to RUB 86.8 mn per quarter. The board decides, and our estimate is not a guarantee of payment.
LTM EV/EBITDA is 3.9 against its own three-year average of 9.0, but the cheapness is deceptive: the profit base is unstable
LTM EV/EBITDA is 3.9 – 56% below its own three-year average of 9.0. Formally the stock trades cheaper than usual. LTM P/E is 5.5, which also looks low.
However, the low multiple rests on LTM profit and EBITDA that included strong quarters. In Q2 2026 EBITDA is negative, and if this dynamic persists the denominator of the multiple will shrink and the multiple itself will rise without any change in price.
On the portal's model fair value is 31% below the market. This is our own estimate, not a consensus: it reflects EBITDA growth weighted by the target multiple against the current market cap. The market is paying for profit that the report does not confirm operationally.
On the portal's model fair value is 31% below the market – investors are paying for profit the report does not show
The portal's model puts fair value 31% below the current market price. This means that even with the low multiple the market is paying more than the company deserves on our model.
The gap is explained by the fact that the model relies on sustainable EBITDA generation, while the Q2 report shows negative EBITDA. If the company returns to positive EBITDA in coming quarters the estimate may change, but for now the signal is negative.
For a holder this means the current price offers no margin of safety. The cheap multiple does not compensate for the risk of further deterioration in operating results.
Valuation on the latest reported figures
| Metric | Value |
|---|---|
| Market cap | 6.67 bn ₽ |
| P/E (LTM) | 5.5 |
| EV/EBITDA (LTM) | 3.9 |
| P/B | 1.31 |
| Net debt / EBITDA (LTM) | 0.89 |
| ROE | 2.6% |
| EV/EBITDA, 3-year average | 9.0 |
Bottom line
The report's strong point remains net profit of RUB 43.1 mn and a positive LTM result, but this quarter it is not supported by operations: EBITDA is minus RUB 179.8 mn and operating profit is minus RUB 206.4 mn. Rising capex and net debt of RUB 1.6 bn show the company is investing in the future, but so far this brings no return in revenue, which fell 8.5%. The RUB 3.0 per share dividend gives a 4.5% yield – below the key rate and below the 7.0% we consider fair. At the current price the share looks rather unattractive: the cheap multiple is deceptive, and the portal's model points to 31% downside. The verdict would change if the company returned to positive EBITDA and sustainable revenue growth.
Open the company's financial profile IVAT →
See also: market overview · valuation map · stock screeners