Magnit H1 2026: revenue up 12.8%, but interest costs wiped out the profit
On 28 August Magnit released its H1 2026 results. Revenue rose 12.8% year-on-year to RUB 1,887.2 bn, EBITDA – by 13.7% to RUB 171.8 bn, but the net loss came in at RUB 9.5 bn against a profit of RUB 0.2 bn a year earlier. The cause is not operational: financial expenses jumped to RUB 116.1 bn from RUB 79.9 bn, and interest payments alone exceeded operating profit. At the current price the share looks unattractive: the only multiple in the facts – EV/EBITDA LTM 1.96 – is below its own three-year average of 2.30, but no dividends were paid over the last 12 months, and the portal's model puts the upside at minus 78%.
Key takeaways
— Revenue rose 12.8%, but interest expenses jumped 45% and turned profit into a loss
— Operating profit grew 15.6%, but interest payable exceeded it
— The RUB 9.5 bn net loss is a debt story, not an operating one
— Operating cash flow of RUB 51.1 bn remains positive, but capex almost caught up with it
— Net debt of RUB 518.0 bn against LTM EBITDA of RUB 309.3 bn gives a ratio of 1.68 – a level, not a trend
— No dividends paid for 12 months, and a fair yield of 7.0% against a 14.0% key rate looks out of reach
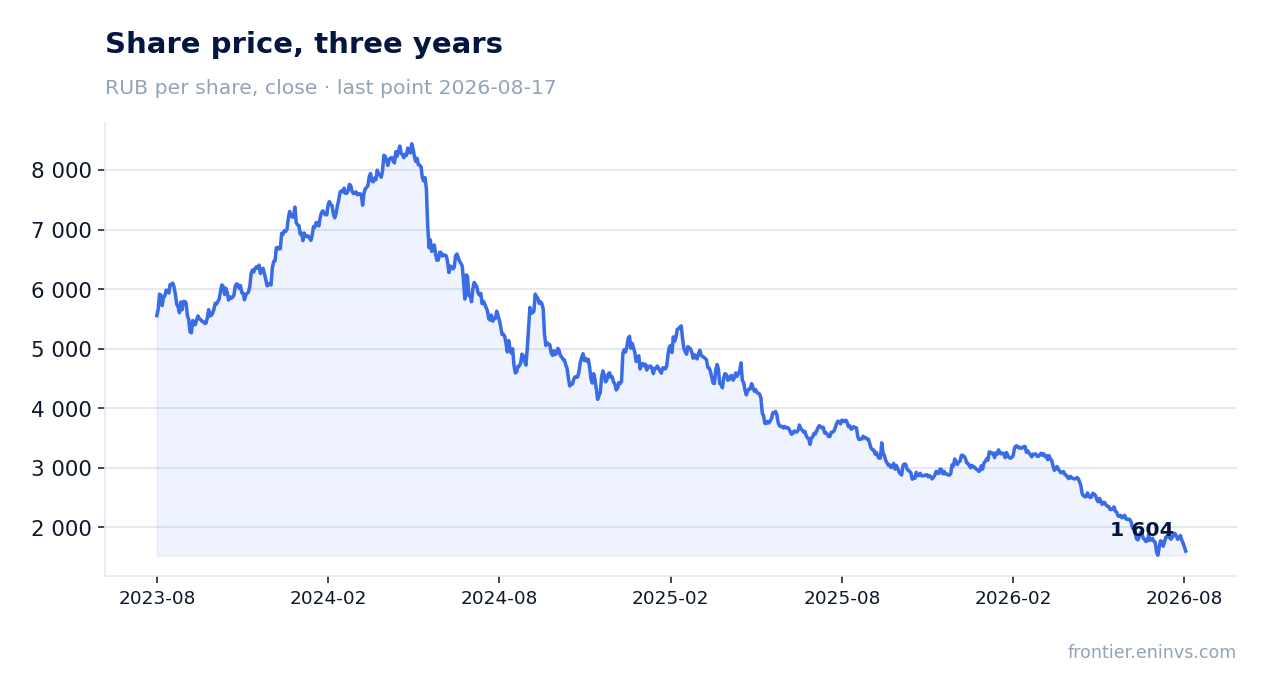
— EV/EBITDA of 1.96 is below its own three-year average of 2.30, but the portal's model shows minus 78%
Attractiveness
Key figures, RUB bn
| Metric | H1 2025 | H1 2026 | Change |
|---|---|---|---|
| Revenue | 1 673 | 1 887 | +12.8% |
| EBITDA | 151 | 172 | +13.7% |
| Operating profit | 73.0 | 84.4 | +15.6% |
| Net profit | 0.15 | -9.55 | -6279.2% |
| Operating cash flow | -35.8 | 51.1 | to profit |
| Capex | 74.5 | 46.1 | -38.1% |
| EBITDA margin | 9.0% | 9.1% | +0.1 pp |
| Net margin | 0.0% | -0.5% | -0.5 pp |
Revenue rose 12.8%, but interest expenses jumped 45% and turned profit into a loss
Revenue for H1 2026 came in at RUB 1,887.2 bn, up 12.8% year-on-year. That is solid growth for a food retailer, reflecting both network expansion and like-for-like sales growth. Operating profit grew even faster – by 15.6% to RUB 84.4 bn – and EBITDA added 13.7% to RUB 171.8 bn. The EBITDA margin even improved from 9.0% to 9.1%.
Below operating profit, however, the picture changes. Financial expenses rose to RUB 116.1 bn from RUB 79.9 bn a year earlier – a 45% increase. Interest income also grew, to RUB 21.6 bn, but that was not enough. As a result, the company posted a pre-tax loss of RUB 9.4 bn and a net loss of RUB 9.5 bn against a profit of RUB 0.2 bn a year earlier.
The key takeaway: the business generates operating profit, but it is entirely consumed by debt servicing. This is not a story of falling sales or margins – it is a story of the cost of borrowing.
Operating profit grew 15.6%, but interest payable exceeded it
Operating profit for H1 2026 was RUB 84.4 bn, up 15.6% year-on-year. That is faster than revenue growth, indicating positive operating leverage. However, interest payable for the same period amounted to RUB 113.2 bn – 1.3 times operating profit.
The gap between operating profit and interest payments is the central problem of the report. Even if operating efficiency continues to improve, at the current level of debt and rates the company will remain loss-making. The central bank key rate of 14.0% is the environment in which debt is expensive.
It is worth noting that depreciation and impairment of property, plant and equipment and right-of-use assets amounted to RUB 83.3 bn, with amortisation of intangible assets adding another RUB 4.0 bn. These non-cash items form a significant part of EBITDA but do not affect the ability to service debt.
The RUB 9.5 bn net loss is a debt story, not an operating one
The net loss for H1 2026 was RUB 9.5 bn against a profit of RUB 0.2 bn a year earlier. The net margin fell to minus 0.5% from 0.0% a year earlier. Loss per share was RUB 137.35 against earnings of RUB 9.03 a year earlier.
At the same time, operating profit grew, EBITDA grew, and the EBITDA margin even improved. The only cause of the loss is the increase in financial expenses. This is important for understanding: if the cost of debt falls or debt is reduced, profit could quickly return.
However, that has not happened yet. The company continues to increase debt: long-term loans and borrowings rose to RUB 658.9 bn from RUB 467.8 bn at the end of 2025, while short-term loans decreased to RUB 263.3 bn from RUB 277.9 bn. Net debt as of 30 June 2026 was RUB 518.0 bn.
Operating cash flow of RUB 51.1 bn remains positive, but capex almost caught up with it
Operating cash flow for H1 2026 was RUB 51.1 bn against an outflow of RUB 35.8 bn a year earlier. This is a significant improvement, reflecting the growth in operating profit before changes in working capital, which was RUB 170.1 bn against RUB 147.6 bn a year earlier.
However, capital expenditure remains high: acquisition of property, plant and equipment, intangible assets and initial direct costs related to right-of-use assets amounted to RUB 46.1 bn against RUB 74.5 bn a year earlier. The nearly 40% reduction in capex is a positive signal, but even so it is almost equal to operating cash flow.
Free cash flow therefore remains minimal. After interest payments (RUB 113.2 bn) and income tax (RUB 5.7 bn), the company has little left to reduce debt or pay dividends.
Net debt of RUB 518.0 bn against LTM EBITDA of RUB 309.3 bn gives a ratio of 1.68 – a level, not a trend
Net debt as of 30 June 2026 was RUB 518.0 bn. At 31 December 2025 it was RUB 496.3 bn, meaning it grew by RUB 21.7 bn over six months. A year earlier, at 30 June 2025, net debt was RUB 430.6 bn, meaning it grew by RUB 87.4 bn over 12 months.
The net debt to EBITDA ratio for the last 12 months is 1.68. This is a moderate level for a retailer and does not look critical. However, the facts do not contain the previous value of this ratio, so it cannot be claimed that leverage rose or fell – only the current level can be stated.
Interest expenses are growing faster than debt, reflecting both the increase in debt itself and the rise in the cost of borrowing. With the key rate at 14.0%, debt servicing remains expensive.
No dividends paid for 12 months, and a fair yield of 7.0% against a 14.0% key rate looks out of reach
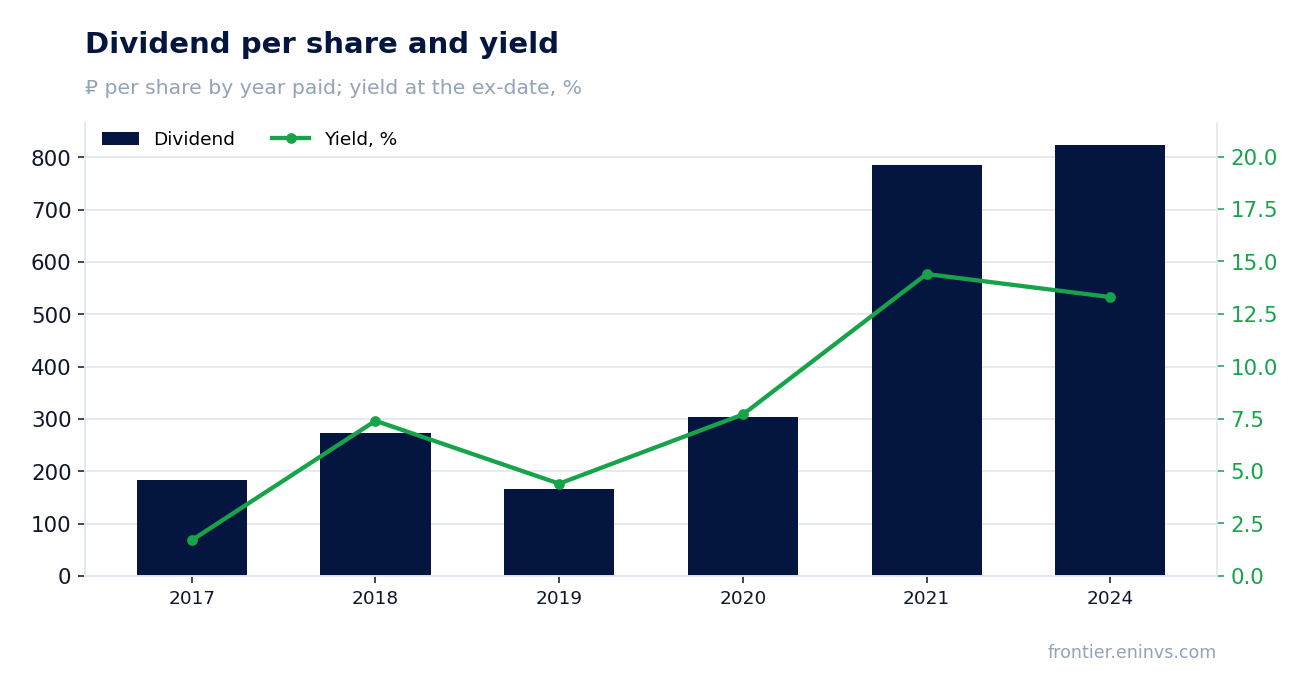
No dividends were paid over the last 12 months: the payment per share was RUB 0.0. Nothing has been paid in the current calendar year either, and no further payout is pencilled in. This contrasts sharply with history: in 2024, RUB 824.26 per share was paid (13.3% yield at the ex-date), in 2021 – RUB 784.99 (14.4%), in 2020 – RUB 304.19 (7.7%).
Our estimate of the fair yield for this name is 7.0%. At the current price, that would imply a payout ratio of 0.64 of profit. However, the company posted a loss in H1 2026, and there is no profit base for dividend calculation. With the key rate at 14.0%, a 7.0% yield does not look attractive to an investor, even if it were achievable.
What could make the payout smaller: further growth in interest expenses, an increase in debt, a decline in operating profit. What could bring dividends back: a reduction in the key rate, debt reduction, a recovery in net profit. None of these factors has yet materialised.
EV/EBITDA of 1.96 is below its own three-year average of 2.30, but the portal's model shows minus 78%
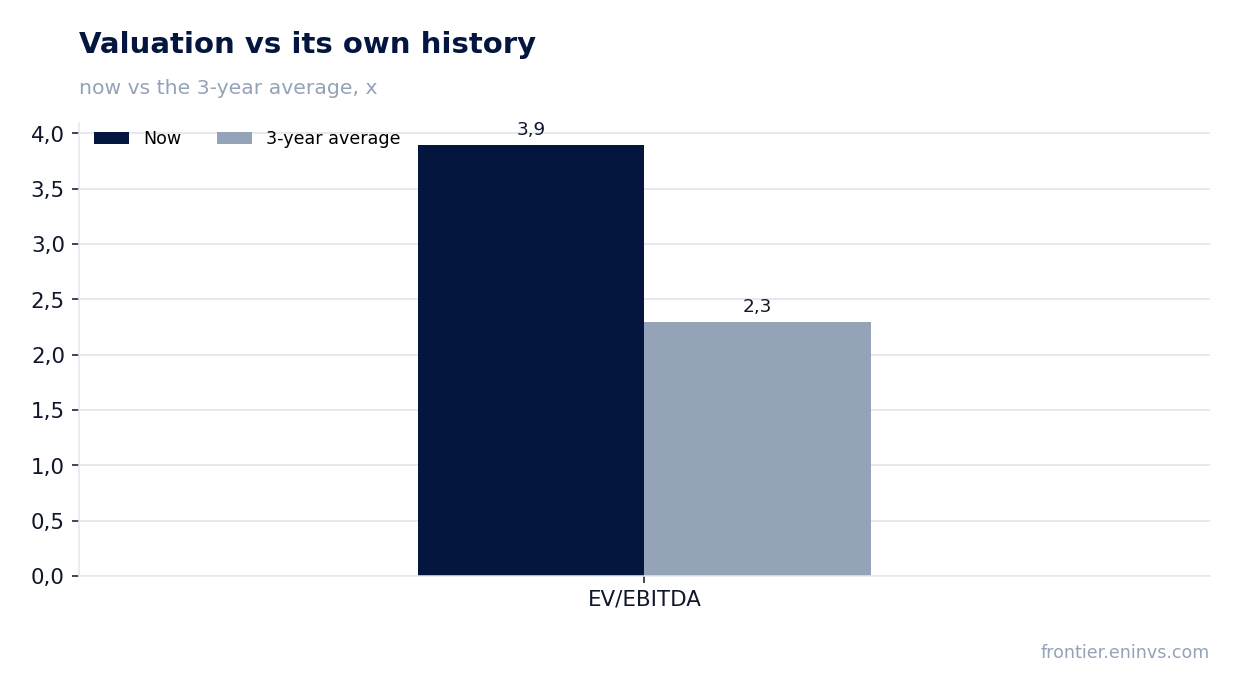
EV/EBITDA for the last 12 months is 1.96. This is below its own three-year average of 2.30. So on this metric the share trades cheaper than usual over the past three years. However, a low multiple by itself does not make the stock attractive: it may reflect risks that the market is pricing in.
Our fundamental valuation model (the portal's model) puts the upside of the share to its fair value at minus 78%. This means that even with the low multiple, the model sees no value in the current price. The market capitalisation is RUB 111.0 bn, significantly below net debt of RUB 518.0 bn.
Return on equity (ROE) is negative – minus 13.2%. This is a direct consequence of the loss. Until the company returns to profit, ROE will remain negative and the share price under pressure.
Valuation on the latest reported figures
| Metric | Value |
|---|---|
| Market cap | 111 bn ₽ |
| EV/EBITDA (LTM) | 2.0 |
| P/B | 0.74 |
| Net debt / EBITDA (LTM) | 1.68 |
| Operating cash flow (LTM) | 132 bn |
| ROE | -13.2% |
| EV/EBITDA, 3-year average | 2.3 |
Dividend per share, ₽, and yield at the ex-date
| Year paid | Dividend | Yield |
|---|---|---|
| 2017 | 182.92 | 1.7% |
| 2018 | 272.88 | 7.4% |
| 2019 | 166.78 | 4.4% |
| 2020 | 304.19 | 7.7% |
| 2021 | 784.99 | 14.4% |
| 2024 | 824.26 | 13.3% |
Bottom line
The operating part of the report looks decent: revenue grew 12.8%, EBITDA – by 13.7%, and the EBITDA margin even improved to 9.1%. But all this growth was consumed by interest expenses, which rose to RUB 116.1 bn and exceeded operating profit. The net loss of RUB 9.5 bn is a debt story, not an operating one. Dividends are not being paid, and with a loss their return is unlikely. EV/EBITDA of 1.96 is below its own three-year average of 2.30, but the portal's model shows minus 78% – the market is already pricing in serious risks. The question for a holder now is not whether the business is growing, but when debt will stop eating all the profit.
Open the company's financial profile MGNT →
See also: market overview · valuation map · stock screeners