Magnit: revenue and EBITDA grow at double-digit rates, but interest costs eat the profit
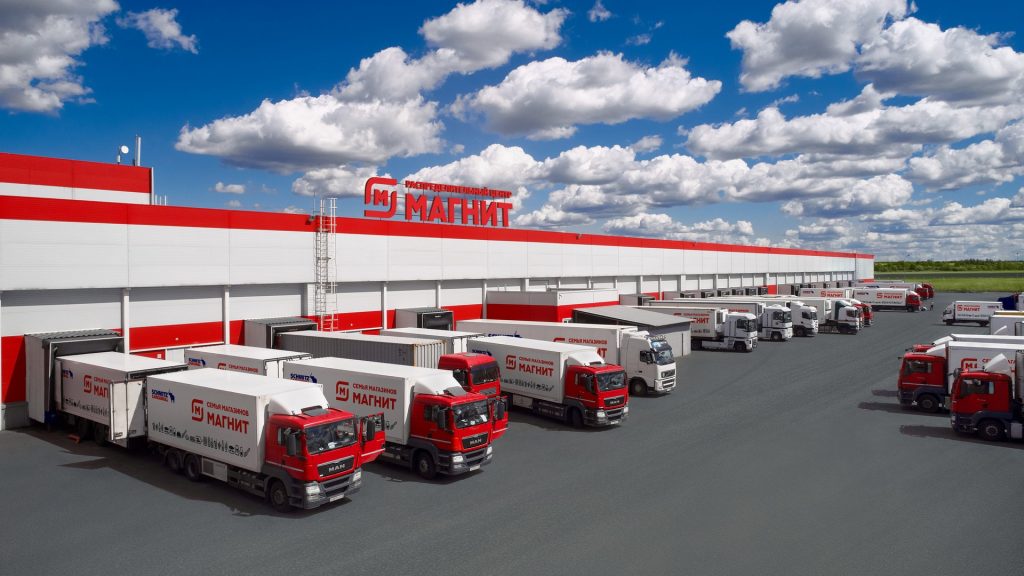
On 28 August Magnit released its Q2 2026 results. Revenue rose 12.8% year on year to RUB 943.6 bn, EBITDA – by 13.7% to RUB 85.9 bn, while net profit turned to a loss of RUB 4.8 bn against RUB 77.2 mn a year earlier. The cause is not operations: for the first half financial expenses reached RUB 116.1 bn versus RUB 79.9 bn a year earlier, and interest payments exceed operating profit. At an EV/EBITDA LTM of 2.0 against its own three-year average of 2.3 the share is cheaper than its history, but the absence of dividends and a negative net profit make it rather neutral than attractive.
Key takeaways
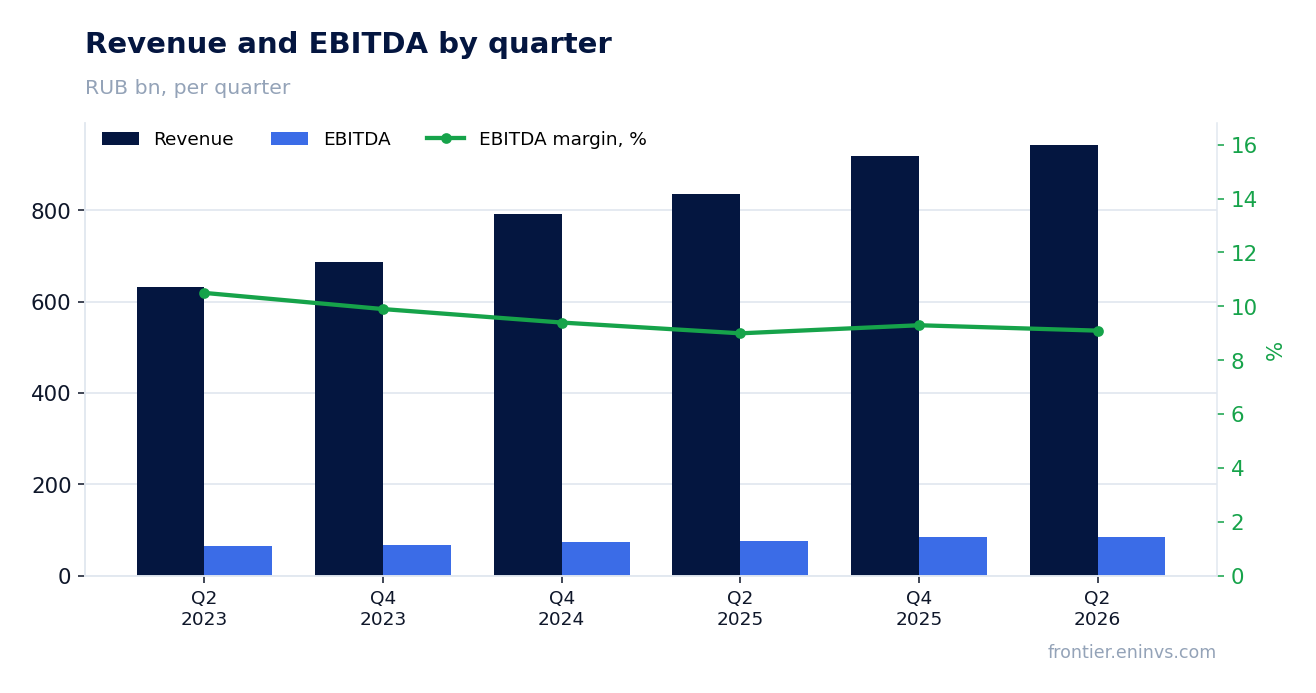
— Revenue added 12.8% on the back of double-digit EBITDA growth, but the margin stayed at 9.1%
— Operating profit rose to RUB 42.2 bn, yet interest expenses for the half-year reached RUB 116.1 bn
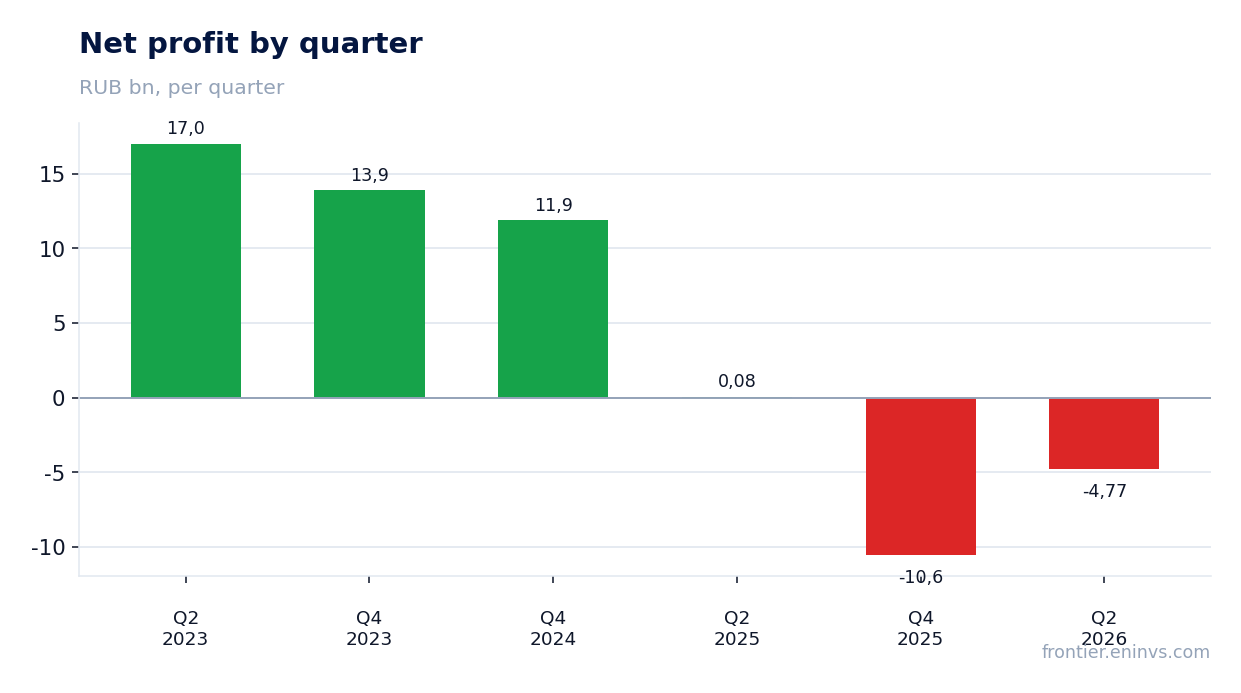
— The net loss in Q2 was RUB 4.8 bn despite positive operating cash flow of RUB 25.5 bn
— Leverage at 1.67x EBITDA LTM remains moderate, but net debt rose to RUB 518.0 bn
— Capex in Q2 was RUB 23.0 bn, half the level of a year earlier
— No dividends were paid over the last 12 months, and our estimate of the annual dividend is RUB 0.0 per share
— EV/EBITDA LTM of 2.0 is below its own three-year average of 2.3, but the portal model puts the share's upside at minus 54%
Attractiveness
Key figures, RUB bn
| Metric | Q2 2025 | Q2 2026 | Change |
|---|---|---|---|
| Revenue | 837 | 944 | +12.8% |
| EBITDA | 75.5 | 85.9 | +13.7% |
| Operating profit | 36.5 | 42.2 | +15.6% |
| Net profit | 0.08 | -4.77 | -6279.3% |
| Operating cash flow | -17.9 | 25.5 | to profit |
| Capex | 37.2 | 23.0 | -38.1% |
| EBITDA margin | 9.0% | 9.1% | +0.1 pp |
| Net margin | 0.0% | -0.5% | -0.5 pp |
Revenue added 12.8% on the back of double-digit EBITDA growth, but the margin stayed at 9.1%
Revenue in Q2 2026 was RUB 943.6 bn, 12.8% above the level a year earlier. EBITDA rose 13.7% to RUB 85.9 bn, outpacing revenue. The EBITDA margin was 9.1% versus 9.0% a year earlier – a symbolic improvement, but it shows the company keeps costs under control.
Operating profit reached RUB 42.2 bn against RUB 36.5 bn a year earlier. Operating profit grew faster than revenue, indicating positive operating leverage. However, the bulk of this improvement goes to servicing debt rather than to net profit.
Operating profit rose to RUB 42.2 bn, yet interest expenses for the half-year reached RUB 116.1 bn
For the first half of 2026 financial expenses were RUB 116.1 bn versus RUB 79.9 bn in the same period last year. Interest income rose to RUB 21.6 bn from RUB 12.3 bn, but that is not enough to offset the increase in interest payments. As a result, the pre-tax loss for the half-year was RUB 9.4 bn against a profit of RUB 1.8 bn a year earlier.
The net loss in Q2 was RUB 4.8 bn against a profit of RUB 77.2 mn a year earlier. This is the second consecutive quarter with a negative result: in Q4 2025 the loss was RUB 10.6 bn. The cause is not operational weakness but the cost of borrowed funds, which remains high with the key rate at 14.0%.
The net loss in Q2 was RUB 4.8 bn despite positive operating cash flow of RUB 25.5 bn
Operating cash flow in Q2 2026 was RUB 25.5 bn against a negative RUB 17.9 bn a year earlier. For the half-year operating flow reached RUB 51.1 bn against an outflow of RUB 35.8 bn a year earlier. The improvement is due to working capital release: advances paid grew by only RUB 3.2 bn versus RUB 63.1 bn a year earlier.
Capex in Q2 was RUB 23.0 bn against RUB 37.2 bn a year earlier. For the half-year the purchase of fixed and intangible assets was RUB 46.1 bn against RUB 74.5 bn a year earlier. Lower capex together with higher operating flow allowed the company to allocate funds to debt repayment and to build up its cash cushion: the cash balance rose to RUB 404.1 bn from RUB 244.5 bn at the end of 2025.
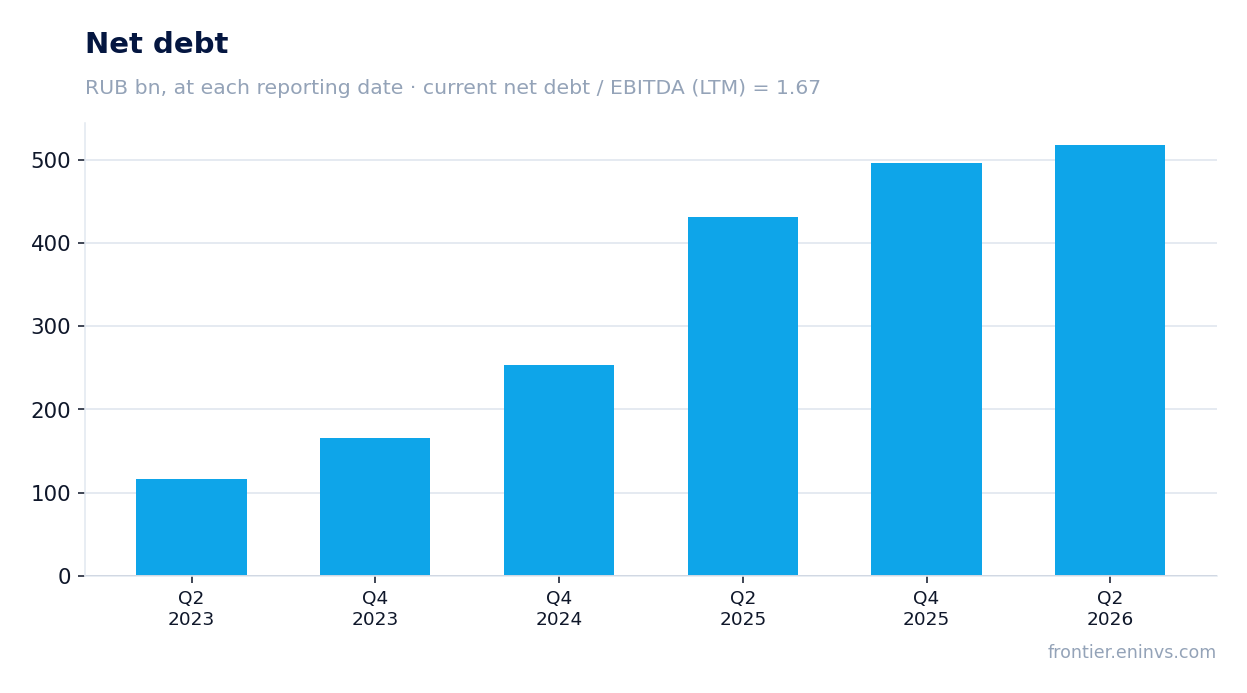
Leverage at 1.67x EBITDA LTM remains moderate, but net debt rose to RUB 518.0 bn
Net debt at 30 June 2026 was RUB 518.0 bn against RUB 496.3 bn at 31 December 2025, an increase of RUB 21.7 bn. Over 12 months net debt rose by RUB 87.4 bn – from RUB 430.6 bn at 30 June 2025. The net debt to EBITDA LTM ratio is 1.67 – a moderate level for a retail chain.
Long-term loans and borrowings rose to RUB 658.9 bn from RUB 467.8 bn at the end of 2025, while short-term debt declined to RUB 263.3 bn from RUB 277.9 bn. The company is refinancing short-term debt into long-term, which reduces refinancing risk. Interest expenses of RUB 116.1 bn for the half-year are the cost of debt, which remains heavy at the current key rate.
Capex in Q2 was RUB 23.0 bn, half the level of a year earlier
Capex in Q2 2026 was RUB 23.0 bn against RUB 37.2 bn a year earlier. For the half-year the purchase of fixed and intangible assets was RUB 46.1 bn against RUB 74.5 bn a year earlier. The decline in capex may be linked to the completion of integration of acquired assets, including the Azbuka Vkusa chain acquired in 2025.
Lower capex frees up cash flow, which the company directs to debt repayment. However, the sustainability of this decline is questionable: a retail chain requires constant investment in store renovation and logistics. If capex remains low, it will support cash flow but may limit future growth.
No dividends were paid over the last 12 months, and our estimate of the annual dividend is RUB 0.0 per share
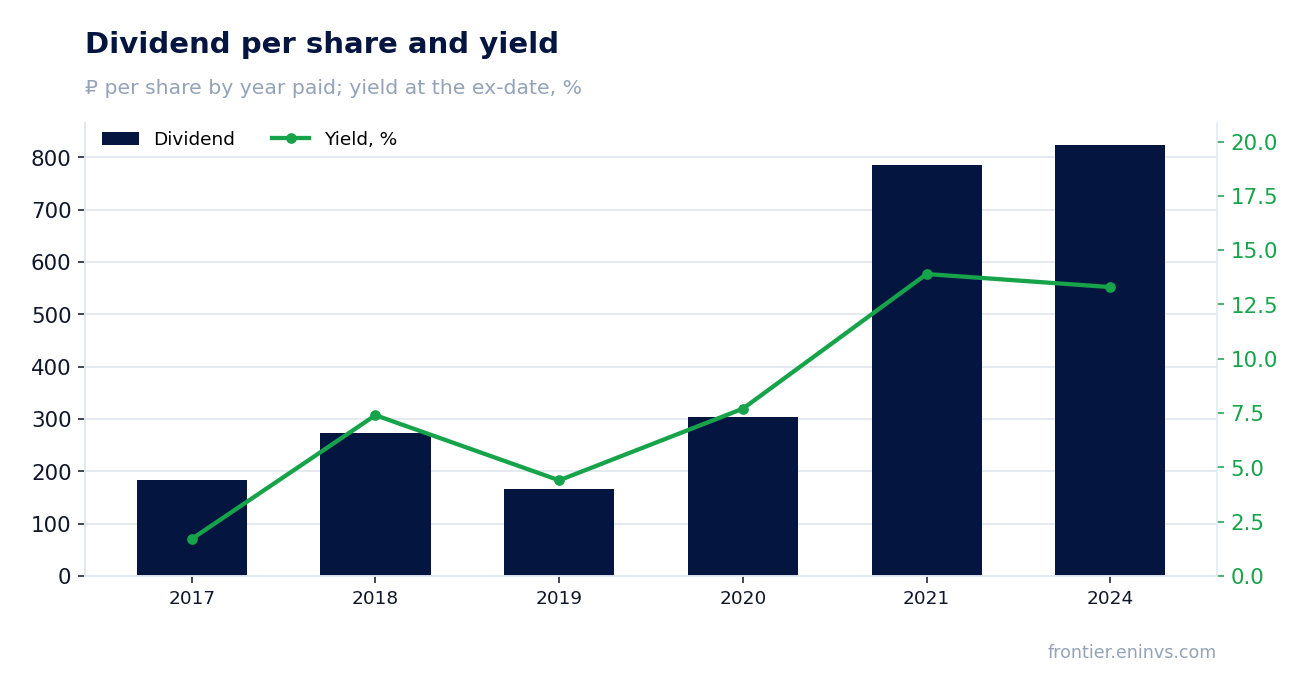
No dividends were paid over the last 12 months. The last payment was for 2024 – RUB 824.26 per share, which at the ex-date price of RUB 6,215.0 gave a yield of 13.3%. The payment history is intermittent: after 2021 the company paid no dividends until 2024.
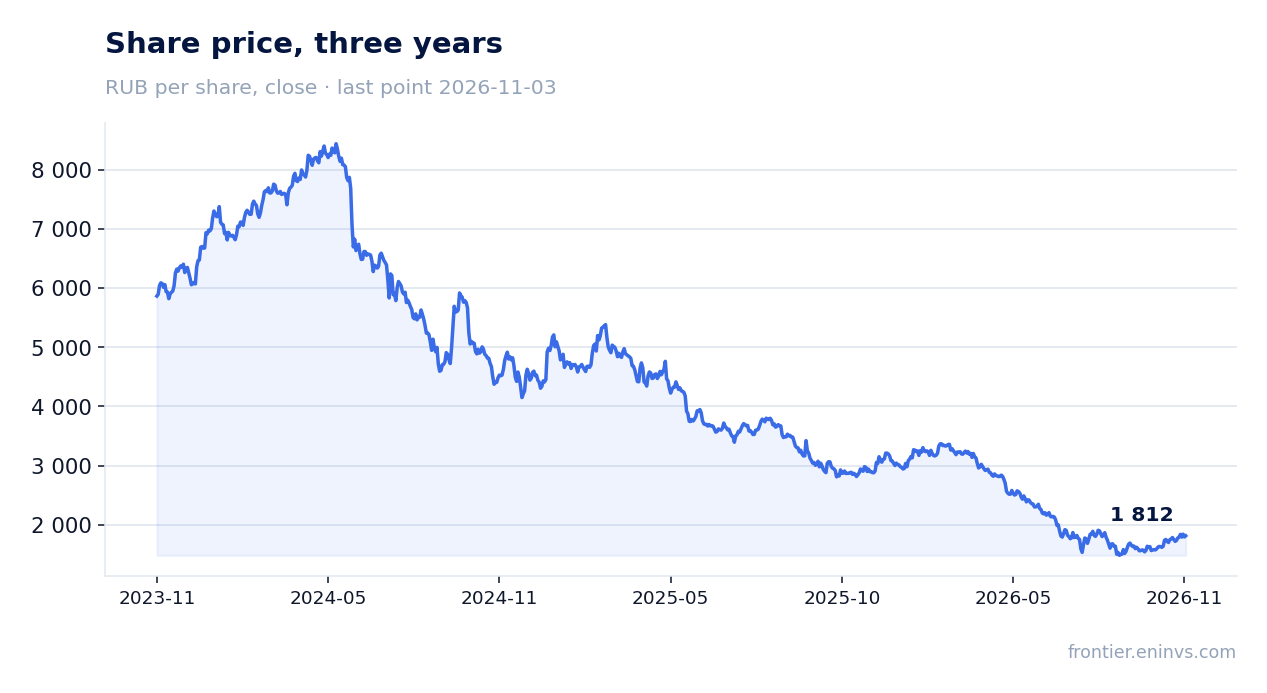
Our estimate of the annual dividend is RUB 0.0 per share, corresponding to a zero yield on the current price of RUB 1,888.0. The reason is negative profit: the dividend potential model starts from a base of minus RUB 31.6 bn. With a payout ratio of 0.64 of profit, a dividend is only possible with a positive financial result. The fair yield we consider adequate for this stock is 7.0%.
The key rate of 14.0% sets a high bar for equity yields. Until the company returns to profit, dividend payments should not be expected. Lower interest expenses are the main factor that could restore profit and, accordingly, dividends.
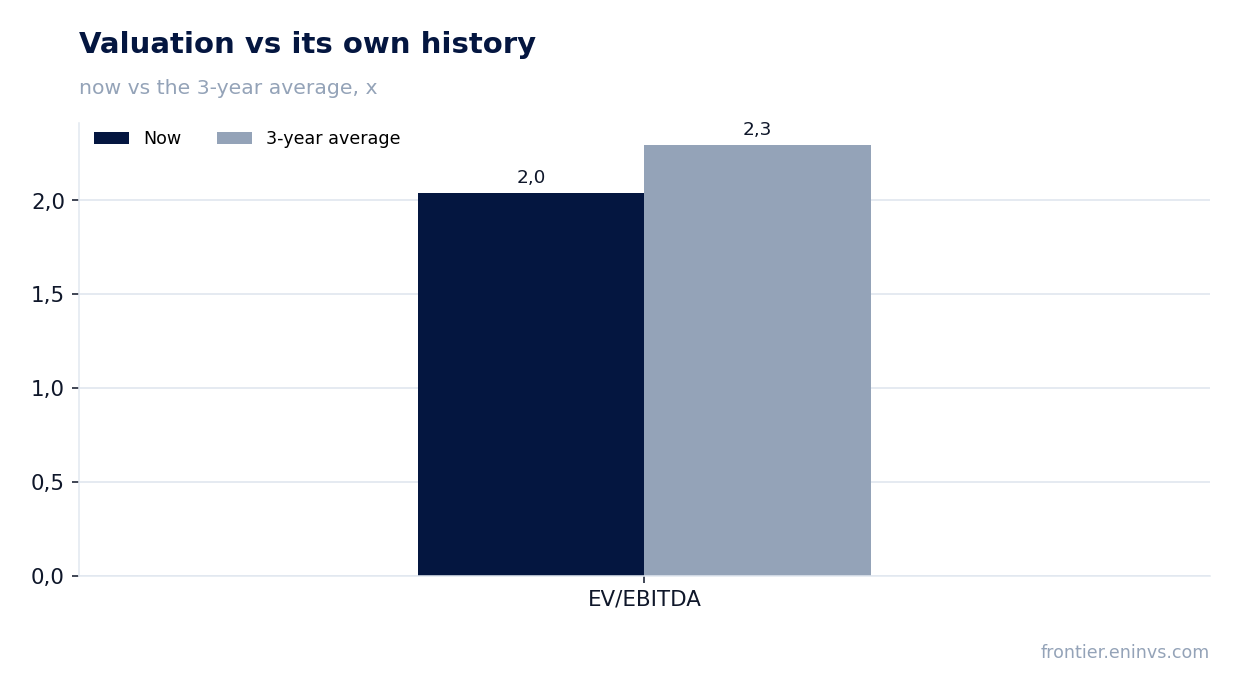
EV/EBITDA LTM of 2.0 is below its own three-year average of 2.3, but the portal model puts the share's upside at minus 54%
The EV/EBITDA LTM multiple is 2.0 against its own three-year average of 2.3. The share trades below its history on this multiple – a discount of about 11%. This may indicate undervaluation, but only if profit returns to positive values.
Our fundamental value-creation model, based on EBITDA growth and the target multiple, shows the share's upside at minus 54% to the current price. This means that even with a low multiple, the market values the company above what the model assumes. Market capitalisation is RUB 135.3 bn, which is small for a company with quarterly revenue of RUB 943.6 bn.
Valuation on the latest reported figures
| Metric | Value |
|---|---|
| Market cap | 135 bn ₽ |
| EV/EBITDA (LTM) | 2.0 |
| P/B | 0.90 |
| Net debt / EBITDA (LTM) | 1.67 |
| Operating cash flow (LTM) | 132 bn |
| ROE | -13.7% |
| EV/EBITDA, 3-year average | 2.3 |
Dividend per share, ₽, and yield at the ex-date
| Year paid | Dividend | Yield |
|---|---|---|
| 2017 | 182.92 | 1.7% |
| 2018 | 272.88 | 7.4% |
| 2019 | 166.78 | 4.4% |
| 2020 | 304.19 | 7.7% |
| 2021 | 784.99 | 13.9% |
| 2024 | 824.26 | 13.3% |
Bottom line
The strong side of the report is operational: revenue grew 12.8%, EBITDA – by 13.7%, operating profit – to RUB 42.2 bn, and operating cash flow for the half-year was RUB 51.1 bn against an outflow a year earlier. The weak side is interest expenses, which reached RUB 116.1 bn for the half-year and led to a net loss of RUB 4.8 bn in Q2. No dividends are paid, and our estimate of the annual dividend is RUB 0.0 per share. At an EV/EBITDA LTM of 2.0 against the three-year average of 2.3 the share is cheaper than its history, but the portal model shows upside of minus 54%. The verdict is neutral: operational growth and a low multiple are balanced by the loss and the absence of dividends.
Open the company's financial profile MGNT →
See also: market overview · valuation map · stock screeners