Rosseti Moscow Region: profit up 69%, but capex swallows the entire gain

On 28 September Rosseti Moscow Region reported results for the second quarter of 2026. Revenue rose 22.6% year on year to RUB 74.8 bn, EBITDA by 28.2% to RUB 24.1 bn, net profit by 69.0% to RUB 10.0 bn. The share looks attractive: EV/EBITDA of 1.40 against a three-year average of 1.84, a dividend yield of 11.6% versus the 10.5% we consider fair, and the portal model implies 84% upside.
Key takeaways
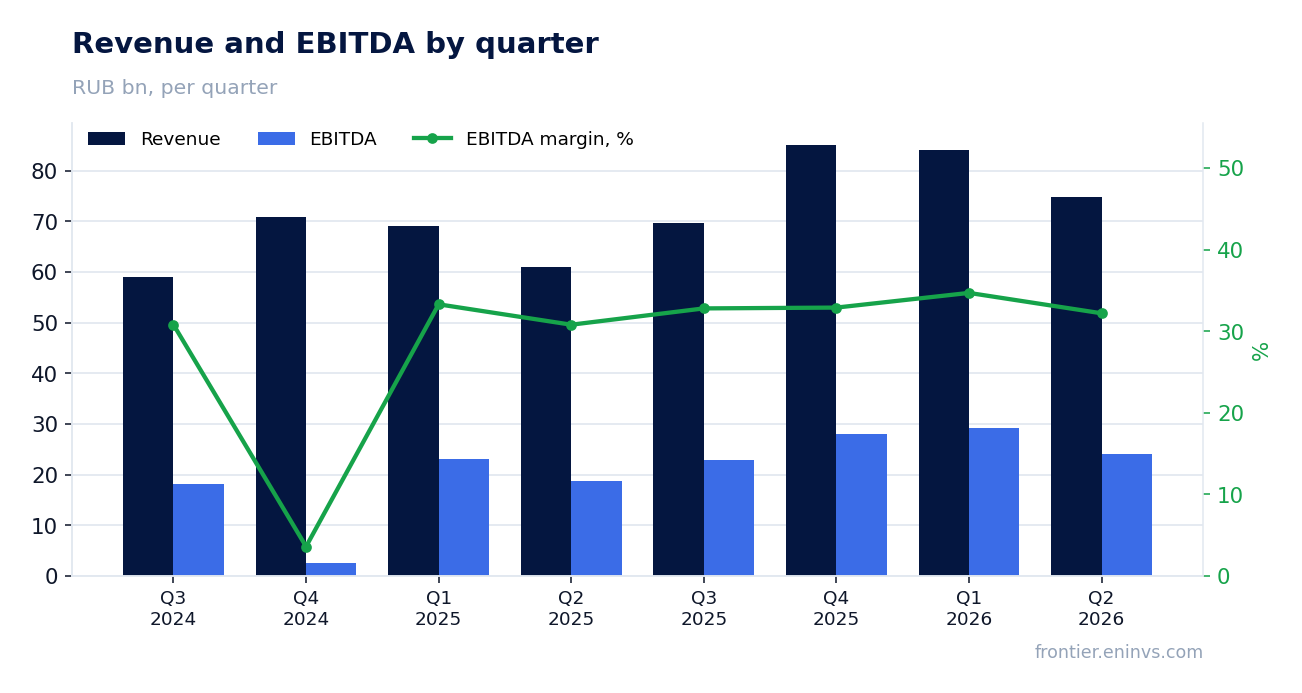
— Revenue accelerated to +22.6%, the fourth consecutive quarter of above-20% growth
— EBITDA margin rose to 32.2% – costs are growing slower than revenue
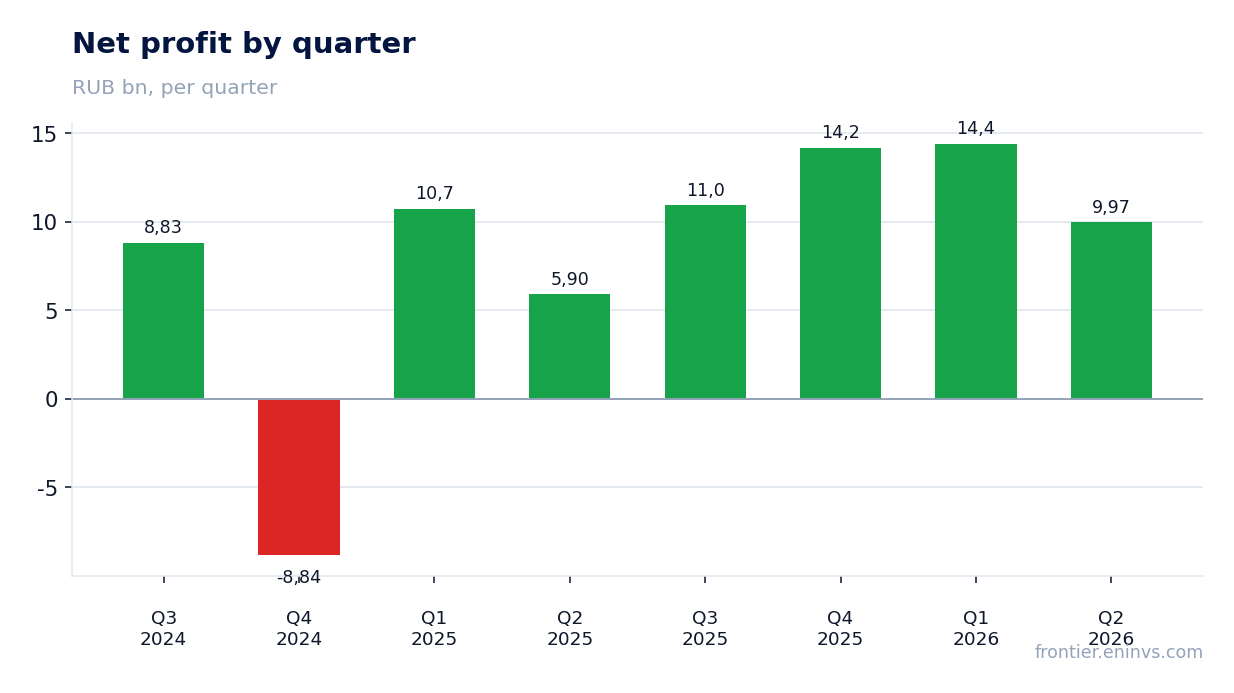
— Net profit rose 69.0%, but operating cash flow fell to RUB 18.5 bn
— Capex of RUB 24.4 bn exceeded operating cash flow of RUB 18.5 bn
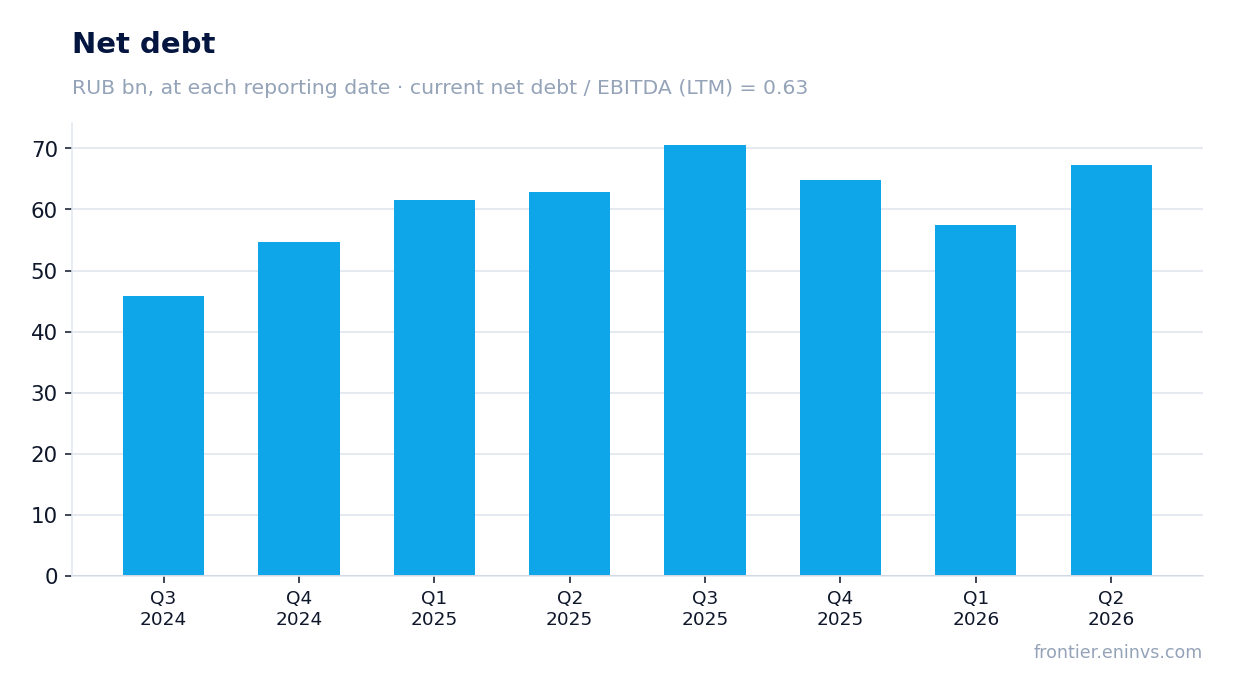
— Debt rose to RUB 67.3 bn, but that is only 0.66 LTM EBITDA
— The dividend for 2026 could be RUB 0.22 per share – 13.8% on the current price
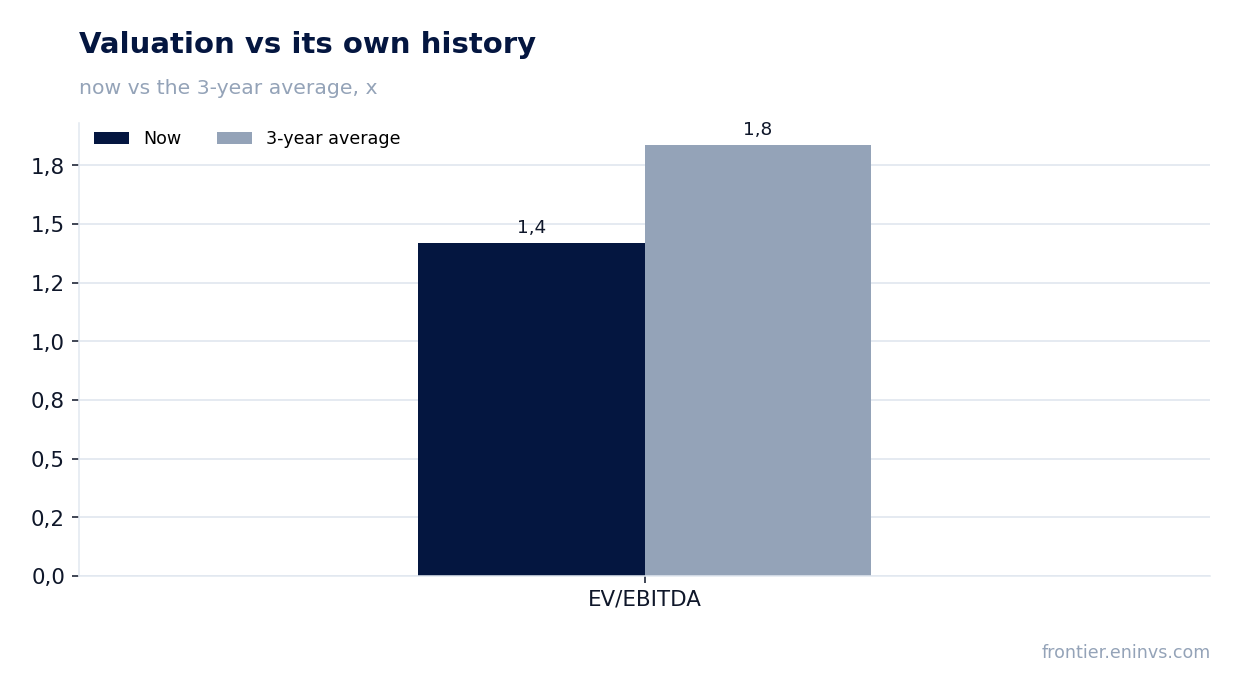
— EV/EBITDA of 1.40 versus a three-year average of 1.84 – the stock is below its own history
Attractiveness
Key figures, RUB bn
| Metric | Q2 2025 | Q2 2026 | Change |
|---|---|---|---|
| Revenue | 61.0 | 74.8 | +22.6% |
| EBITDA | 18.8 | 24.1 | +28.2% |
| Operating profit | 11.1 | 15.7 | +41.5% |
| Net profit | 5.90 | 9.97 | +69.0% |
| Operating cash flow | 22.4 | 18.5 | -17.1% |
| Capex | 22.6 | 24.4 | +8.0% |
| EBITDA margin | 30.8% | 32.2% | +1.4 pp |
| Net margin | 9.7% | 13.3% | +3.6 pp |
Revenue accelerated to +22.6%, the fourth consecutive quarter of above-20% growth
In the second quarter of 2026 revenue reached RUB 74.8 bn, up 22.6% year on year. That is an acceleration from 21.9% in the first quarter. This is the fourth consecutive quarter of above-20% growth: 18.1% in Q3 2025, 20.1% in Q4 2025, 21.9% in Q1 2026.
The top line is driven by new customer connections and higher electricity supply in the Moscow region. The company does not disclose details, but the steady acceleration indicates demand for capacity is growing faster than tariffs.
EBITDA margin rose to 32.2% – costs are growing slower than revenue
EBITDA in Q2 2026 was RUB 24.1 bn, up 28.2% year on year. The EBITDA margin rose to 32.2% from 30.8% a year earlier. This means operating costs grew slower than revenue.
The main driver of margin expansion is operating leverage: fixed costs are spread over a larger revenue base. The company does not disclose its cost structure, but the 1.4 percentage point margin improvement indicates cost control.
Net profit rose 69.0%, but operating cash flow fell to RUB 18.5 bn
Net profit in Q2 2026 was RUB 10.0 bn, up 69.0% year on year. The net margin rose to 13.3% from 9.7%. However, operating cash flow fell to RUB 18.5 bn from RUB 22.4 bn a year earlier.
The gap between profit and cash flow is explained by higher receivables and advances, as well as increased tax payments. Profit grew, but it converted into cash worse than a year ago.
Capex of RUB 24.4 bn exceeded operating cash flow of RUB 18.5 bn
Capital expenditures in Q2 2026 were RUB 24.4 bn, up 8.0% year on year. That exceeds operating cash flow of RUB 18.5 bn. The gap is funded by debt.
Grid construction and modernisation are the main driver of revenue growth, but investment absorbs the entire operating cash flow. The company has to borrow to finance its development programme.
Debt rose to RUB 67.3 bn, but that is only 0.66 LTM EBITDA
Net debt as of 30 June 2026 was RUB 67.3 bn versus RUB 57.5 bn on 31 March 2026, an increase of RUB 9.8 bn. Over 12 months debt rose from RUB 62.9 bn on 30 June 2025 to RUB 67.3 bn, an increase of RUB 4.4 bn.
The ratio of net debt to LTM EBITDA is 0.66. That is a low level that does not pose risks to dividends. The company can service its debt without strain.
The dividend for 2026 could be RUB 0.22 per share – 13.8% on the current price
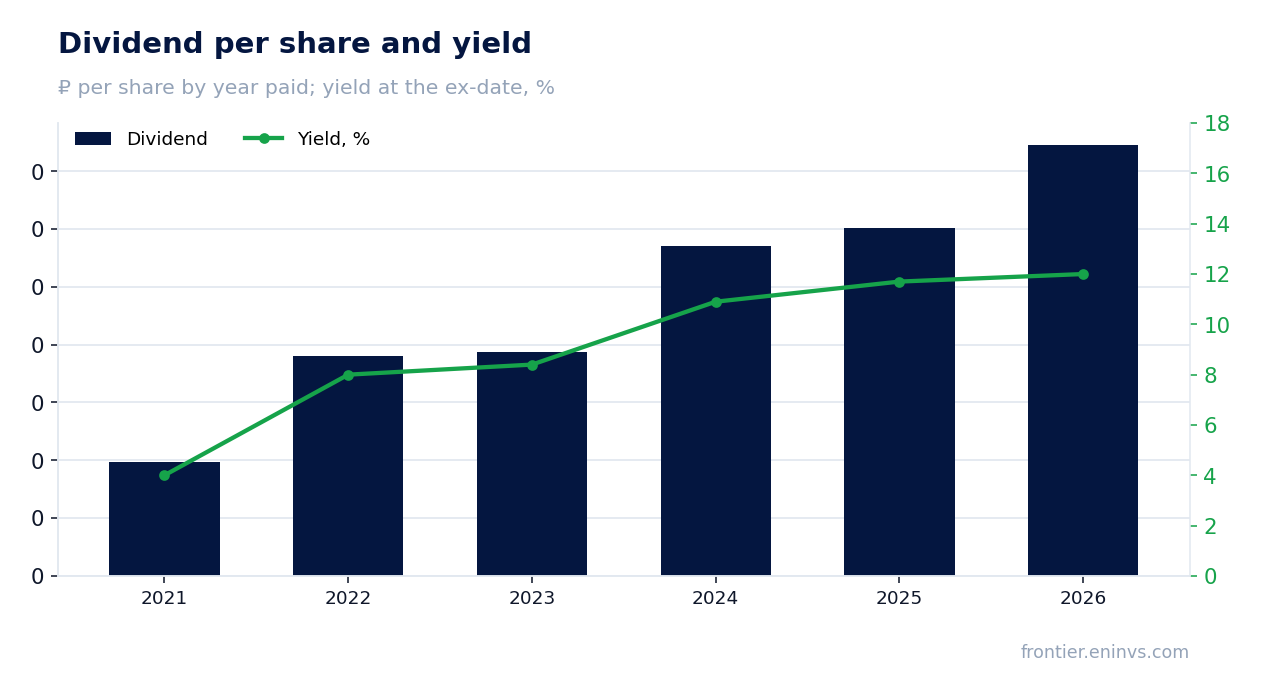
Over the last 12 months the company paid RUB 0.1865 per share, giving a yield of 11.6% on the current price. In our estimate, the dividend for the current financial year could be RUB 0.22 per share – 13.8% on the current price. The estimate is based on LTM profit and the share of profit paid out last year. The board decides.
The yield we consider fair for this name is 10.5%. The current yield is above that, making the dividend attractive. The central bank key rate is 14.0%, so the dividend yield is close to the risk-free rate, but justified by business growth.
The payout history shows growth: RUB 0.0493 in 2021, RUB 0.095 in 2022, RUB 0.097 in 2023, RUB 0.1428 in 2024, RUB 0.1505 in 2025, RUB 0.1865 in 2026. The yield at the ex-date ranged from 4.0% to 12.0%. A lower dividend is possible if profit falls or capex rises.
EV/EBITDA of 1.40 versus a three-year average of 1.84 – the stock is below its own history
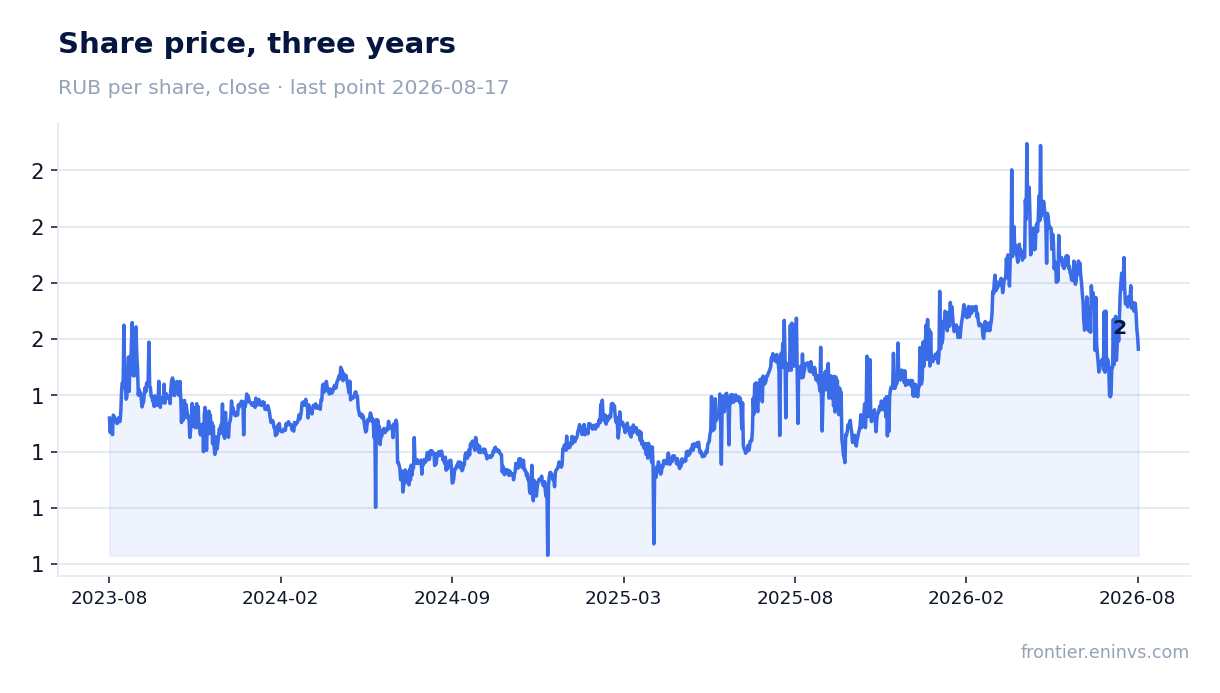
LTM EV/EBITDA is 1.40. The three-year average of this multiple is 1.84. The current level is below its historical average, indicating undervaluation. LTM P/E is 1.59.
The portal model estimates upside to fair value at +84%. This is our own estimate, not a market consensus. At the current price and a dividend yield of 11.6%, the share looks attractive for income-oriented investors.
Valuation on the latest reported figures
| Metric | Value |
|---|---|
| Market cap | 78.7 bn ₽ |
| P/E (LTM) | 1.6 |
| EV/EBITDA (LTM) | 1.4 |
| P/B | 0.31 |
| Net debt / EBITDA (LTM) | 0.66 |
| Operating cash flow (LTM) | 107 bn |
| ROE | 14.6% |
| Dividend yield (12m) | 11.6% |
| EV/EBITDA, 3-year average | 1.8 |
Dividend per share, ₽, and yield at the ex-date
| Year paid | Dividend | Yield |
|---|---|---|
| 2021 | 0.05 | 4.0% |
| 2022 | 0.10 | 8.0% |
| 2023 | 0.10 | 8.4% |
| 2024 | 0.14 | 10.9% |
| 2025 | 0.15 | 11.7% |
| 2026 | 0.19 | 12.0% |
| Our estimate, current year | 0.22 | 13.8% on the current price |
Bottom line
Bottom line: in Q2 2026 Rosseti Moscow Region showed strong revenue growth (+22.6%) and profit growth (+69.0%), with EBITDA margin reaching 32.2%. However, operating cash flow declined and capex exceeded it, leading to debt rising to RUB 67.3 bn. Debt remains low at 0.66 LTM EBITDA. A dividend yield of 11.6% and EV/EBITDA of 1.40 versus a three-year average of 1.84 make the share attractive. The key question for a holder is whether the company can finance its construction programme and pay growing dividends without further increasing debt.
Open the company's financial profile MSRS →
See also: market overview · valuation map · stock screeners