NLMK: revenue is falling more slowly, but profit dropped by a third and there is no dividend
On September 28, NLMK reported results for the second quarter of 2026. Revenue amounted to RUB 199.1 bn, down 9.1% year-on-year, EBITDA – RUB 34.9 bn (–8.8%), net profit – RUB 15.6 bn (–33.0%). The company maintains a negative net debt position (–RUB 37.1 bn), but no dividends were paid over the last 12 months. At the current price, the share looks neutral: the decline in revenue has slowed, but profit and cash flow are weak, and the absence of dividends removes support.
Key takeaways
— Revenue is falling more slowly: a 9.1% decline versus 18.3% a quarter earlier
— EBITDA contracted by 8.8%, but the margin held at 17.5%
— Net profit fell by a third due to a faster decline in operating profit
— Operating cash flow collapsed to RUB 9.8 bn – the lowest in recent quarters
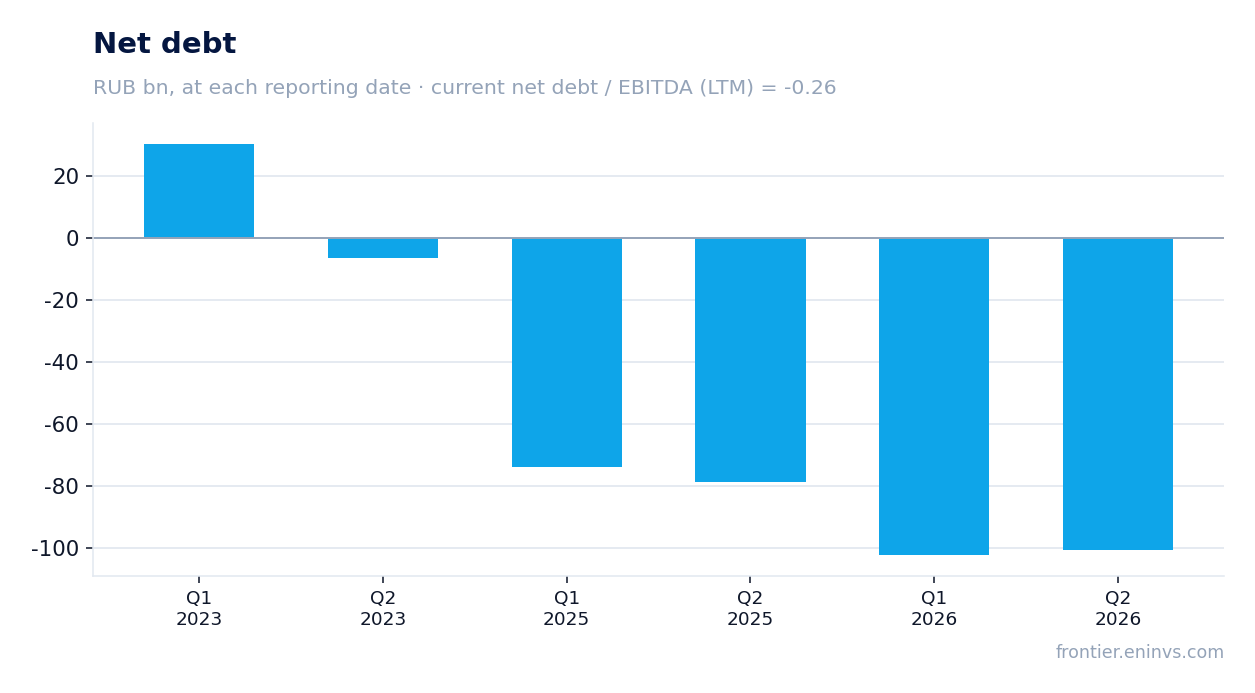
— Net debt remains negative: –RUB 37.1 bn at the end of June
— No dividends were paid over the last 12 months, and no payouts are expected this year
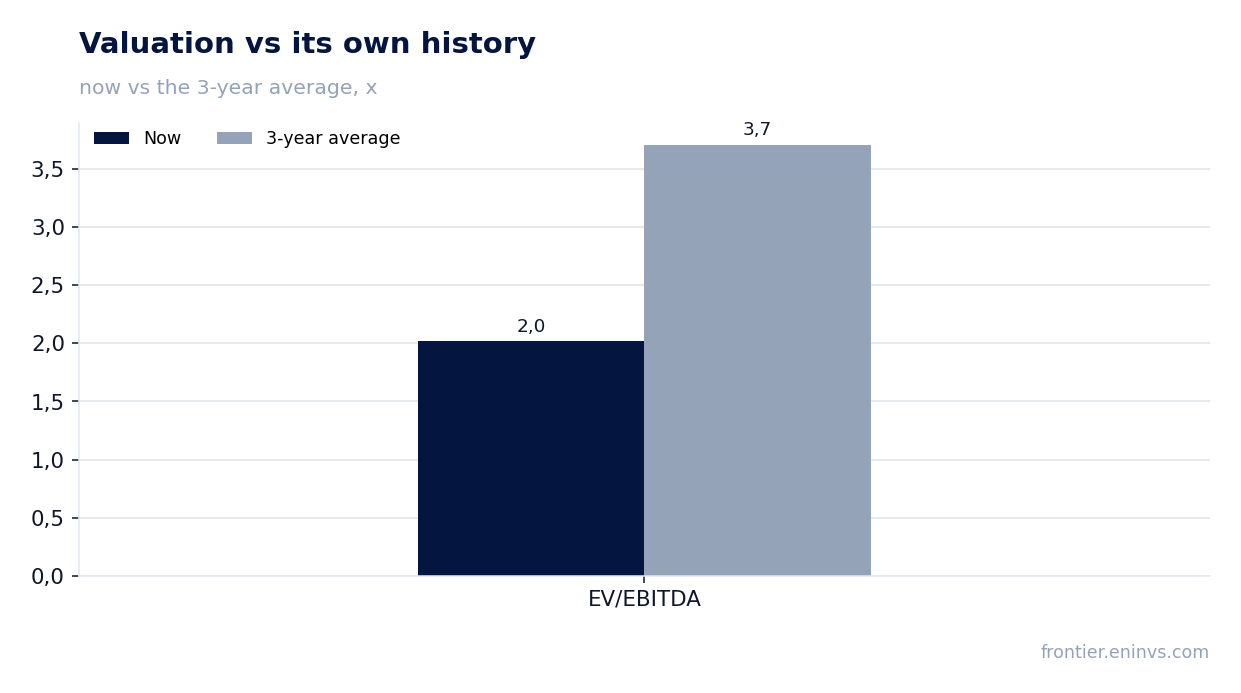
— EV/EBITDA of 2.75 is below its own three-year average of 3.71
Attractiveness
Key figures, RUB bn
| Metric | Q2 2025 | Q2 2026 | Change |
|---|---|---|---|
| Revenue | 219 | 199 | -9.1% |
| EBITDA | 38.3 | 34.9 | -8.8% |
| Operating profit | 23.5 | 19.3 | -18.1% |
| Net profit | 23.3 | 15.6 | -33.0% |
| Operating cash flow | 26.1 | 9.77 | -62.6% |
| EBITDA margin | 17.5% | 17.5% | +0.0 pp |
| Net margin | 10.6% | 7.8% | -2.8 pp |
Revenue is falling more slowly: a 9.1% decline versus 18.3% a quarter earlier
In the second quarter of 2026, NLMK's revenue amounted to RUB 199.1 bn, down 9.1% year-on-year. This is noticeably smaller than the decline in the previous quarter, when it reached 18.3%. The slowdown in the rate of decline may indicate stabilisation in steel prices or higher sales volumes, but without additional data from the report the exact cause is not disclosed.
A comparison with the first quarter of 2026 shows revenue growth of 3.4% (from RUB 192.5 bn in the fourth quarter of 2025), but this is a seasonal factor, and the year-on-year dynamics remain negative. The company is still operating in an environment of weak demand for steel products both domestically and in export markets.
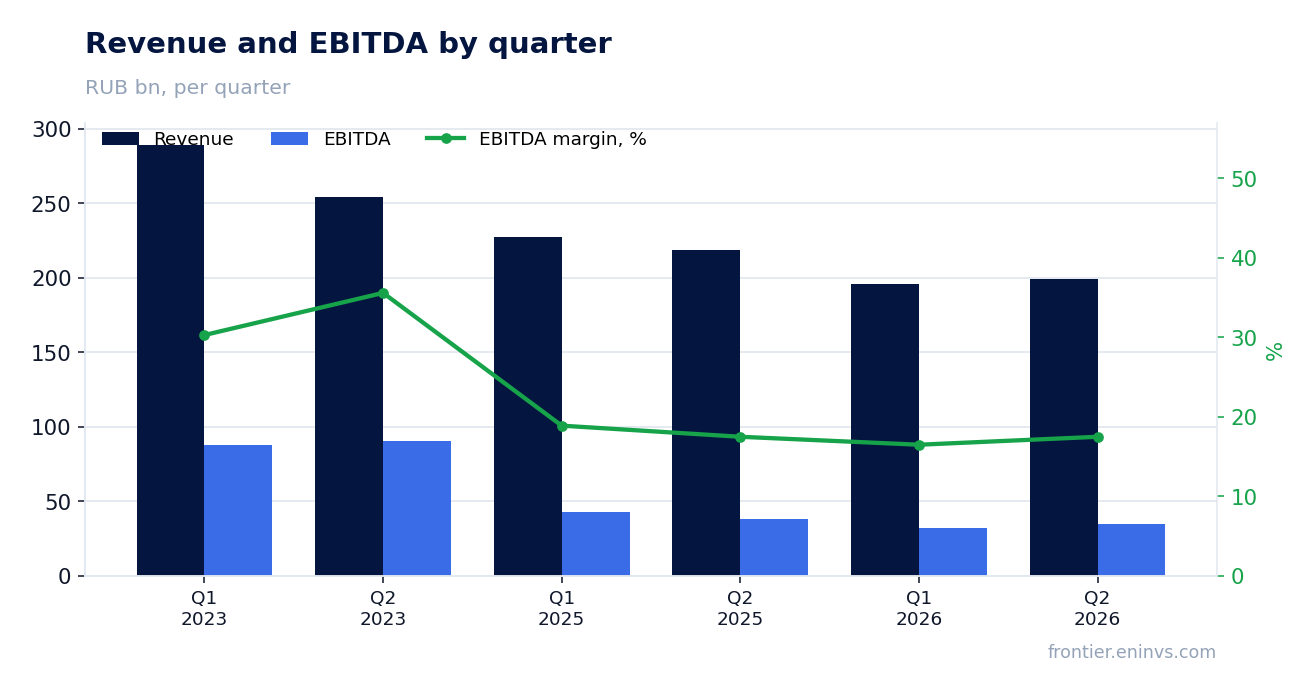
EBITDA contracted by 8.8%, but the margin held at 17.5%
EBITDA in the second quarter of 2026 amounted to RUB 34.9 bn, down 8.8% year-on-year. Despite the decline, the EBITDA margin remained at 17.5%, the same as in the same period last year. This indicates that the company managed to keep costs under control despite falling revenue.
Operating profit fell to RUB 19.3 bn, down 18.1% from the second quarter of 2025. The gap between the dynamics of EBITDA and operating profit is explained by higher depreciation or changes in other operating expenses, but details are absent from the provided facts.
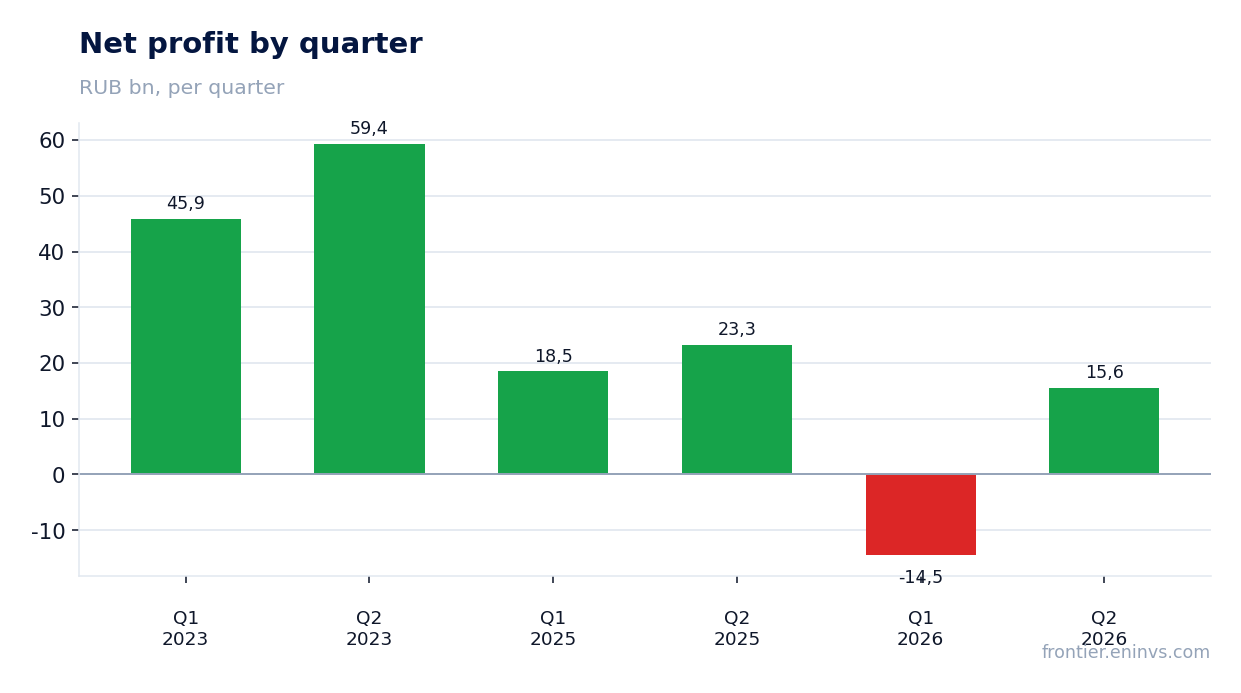
Net profit fell by a third due to a faster decline in operating profit
Net profit in the second quarter of 2026 amounted to RUB 15.6 bn, down 33.0% year-on-year. The decline in profit significantly outpaces the fall in revenue and EBITDA, indicating pressure from financial expenses or one-off factors. The net profit margin fell to 7.8% from 10.6% a year earlier.
The main reason is the faster decline in operating profit, which was not offset by lower interest expenses or tax burden. At the same time, the company remains profitable, and the net margin level remains positive, although noticeably lower than in previous periods.
Operating cash flow collapsed to RUB 9.8 bn – the lowest in recent quarters
Operating cash flow in the second quarter of 2026 amounted to only RUB 9.8 bn, significantly lower than in previous quarters. For comparison, in the fourth quarter of 2025 it was RUB 33.7 bn, and in the second quarter of 2025 – RUB 26.1 bn. Such a sharp decline may be due to deteriorating settlement terms with customers or inventory build-up.
Weak operating cash flow limits the company's ability to finance investments and dividends. At the same time, capital expenditures are absent from the provided data, which does not allow assessing how well cash flow covers investment needs.
Net debt remains negative: –RUB 37.1 bn at the end of June
NLMK's net debt as of June 30, 2026, amounted to –RUB 37.1 bn, meaning the company maintains a net cash position. Compared to December 31, 2025, net debt changed from –RUB 45.4 bn to –RUB 37.1 bn (+RUB 8.3 bn), and over the year – from –RUB 13.1 bn on June 30, 2025, to –RUB 37.1 bn (–RUB 24.1 bn).
The net debt to EBITDA ratio over the last 12 months is –0.28, reflecting negative net debt. This is a level, not a direction of change, and it indicates the company's financial stability. Interest expenses are likely insignificant, which supports net profit despite the decline in operating profit.
No dividends were paid over the last 12 months, and no payouts are expected this year
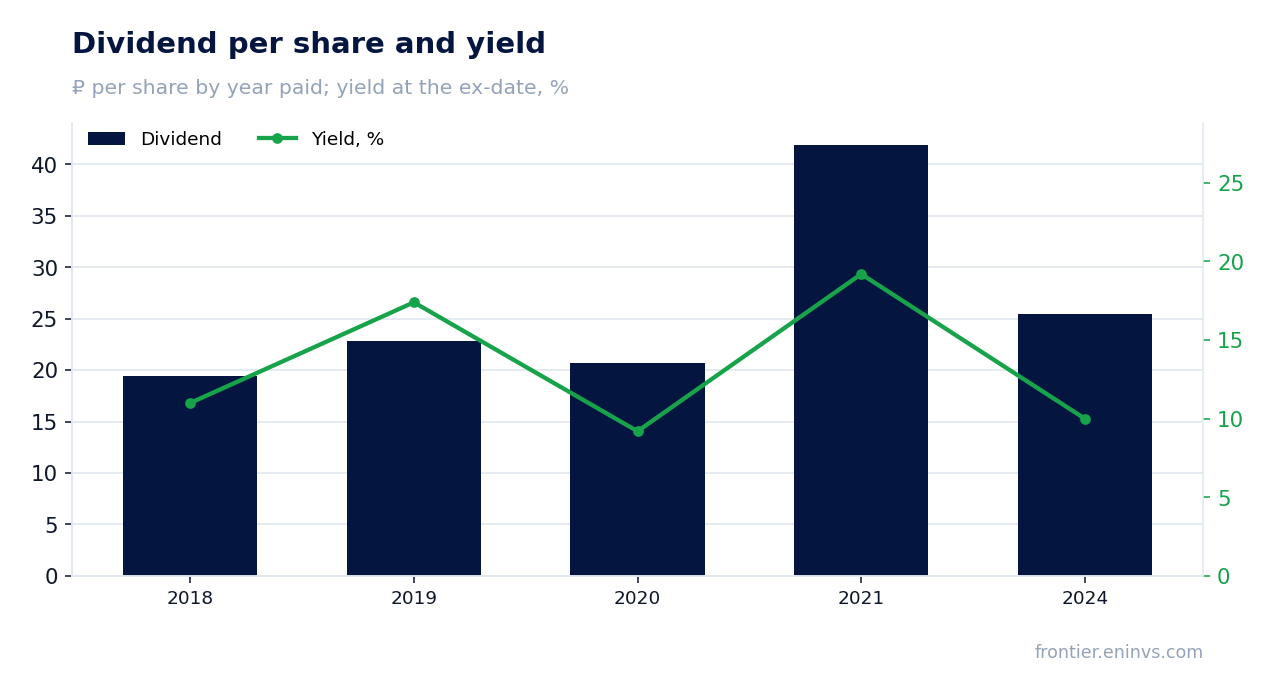
Over the last 12 months, NLMK paid no dividends: payments per share amounted to RUB 0.0. Since the beginning of the calendar year, there have also been no payments, and no dividends are planned for the current year. This contrasts sharply with history: in 2021, the company paid RUB 41.91 per share, in 2024 – RUB 25.43 per share.
The fair yield we consider for this stock is 12.3%, significantly above the current central bank key rate of 14.0%. However, in the absence of payments, this yield is not realised. The implied payout ratio is estimated at 0.72 of profit, but the profit base is shrinking, making future dividends vulnerable.
The main risk to dividends is a further decline in net profit and weak operating cash flow. If the company does not restore cash flow, the likelihood of resuming payments in the coming quarters remains low.
EV/EBITDA of 2.75 is below its own three-year average of 3.71
The current EV/EBITDA multiple is 2.75, below its own three-year average of 3.71. This may indicate the company is undervalued relative to its historical levels. However, the P/E over the last 12 months is 7.48, which is also low but reflects the decline in profit.
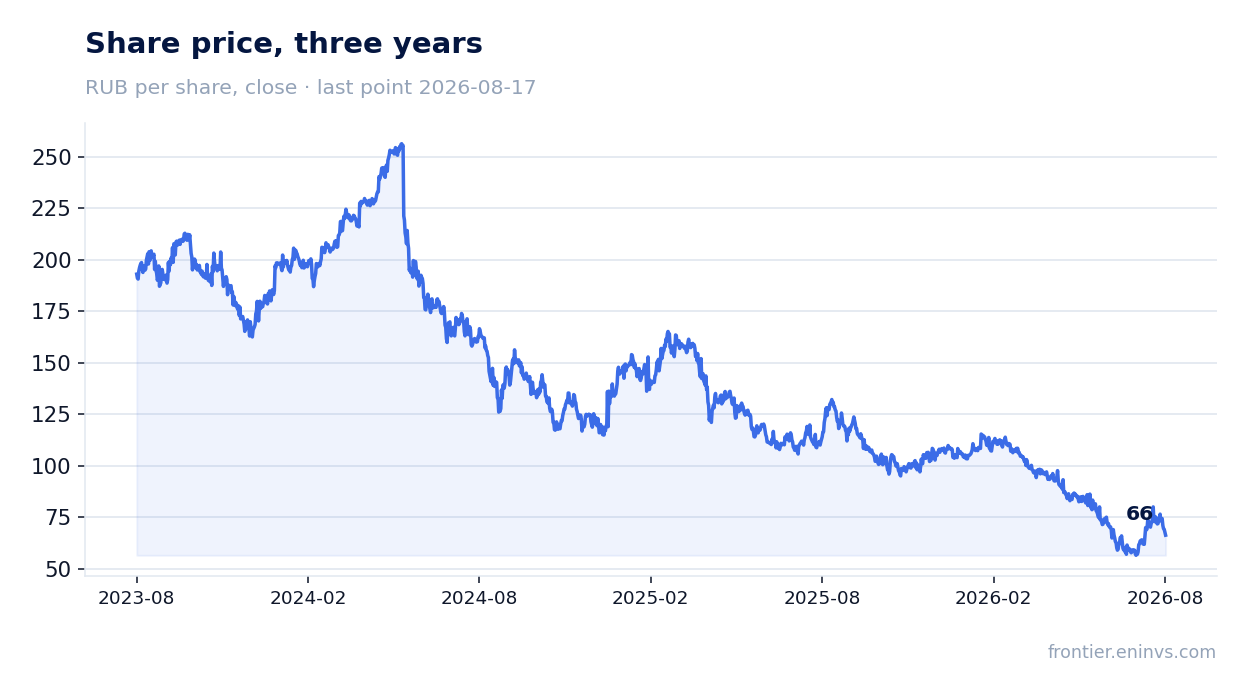
According to the portal's model, the upside of the share to its fair value is estimated at +25%. This is our own estimate, based on re-pricing EBITDA at current commodity prices at the target EV/EBITDA. The market capitalisation is RUB 414.6 bn, and net debt is negative, which supports the valuation.
Valuation on the latest reported figures
| Metric | Value |
|---|---|
| Market cap | 415 bn ₽ |
| P/E (LTM) | 7.5 |
| EV/EBITDA (LTM) | 2.8 |
| P/B | 0.47 |
| Net debt / EBITDA (LTM) | -0.28 |
| Operating cash flow (LTM) | 111 bn |
| ROE | 6.9% |
| EV/EBITDA, 3-year average | 3.7 |
Dividend per share, ₽, and yield at the ex-date
| Year paid | Dividend | Yield |
|---|---|---|
| 2018 | 19.46 | 11.0% |
| 2019 | 22.86 | 17.4% |
| 2020 | 20.73 | 9.2% |
| 2021 | 41.91 | 19.2% |
| 2024 | 25.43 | 10.0% |
Bottom line
NLMK maintains financial stability: net debt is negative, EBITDA margin is stable at 17.5%. However, net profit fell by a third, operating cash flow collapsed to RUB 9.8 bn, and no dividends are being paid. The EV/EBITDA valuation is below its historical average, but weak financial results and the absence of dividends limit upside potential. At the current price, the share looks neutral: the positive from slowing revenue decline is balanced by weak profit and cash flow.
Open the company's financial profile NLMK →
See also: market overview · valuation map · stock screeners