Phosagro: revenue accelerated to +15%, but profit fell 37% as margin was eaten away
Phosagro reported results for the third quarter of 2026. Revenue rose 15.0% year on year to RUB 164.7 bn, EBITDA added only 0.5% to RUB 51.3 bn, and net profit fell 37.2% to RUB 12.6 bn. Revenue growth accelerated versus the second quarter (+7.7%), but the EBITDA margin declined to 31.2% from 35.7% a year earlier, and leverage at 2.64 EBITDA together with a valuation above its own history make the share unattractive at the current price.
Key takeaways
— Revenue rose 15.0% year on year in the third quarter, an acceleration from +7.7% in the second quarter
— EBITDA added only 0.5% because the margin fell to 31.2% from 35.7%
— Net profit fell 37.2% to RUB 12.6 bn with a margin of 7.7% versus 14.1% a year earlier
— Net debt rose to RUB 362.7 bn at the end of September from RUB 309.2 bn at the end of June
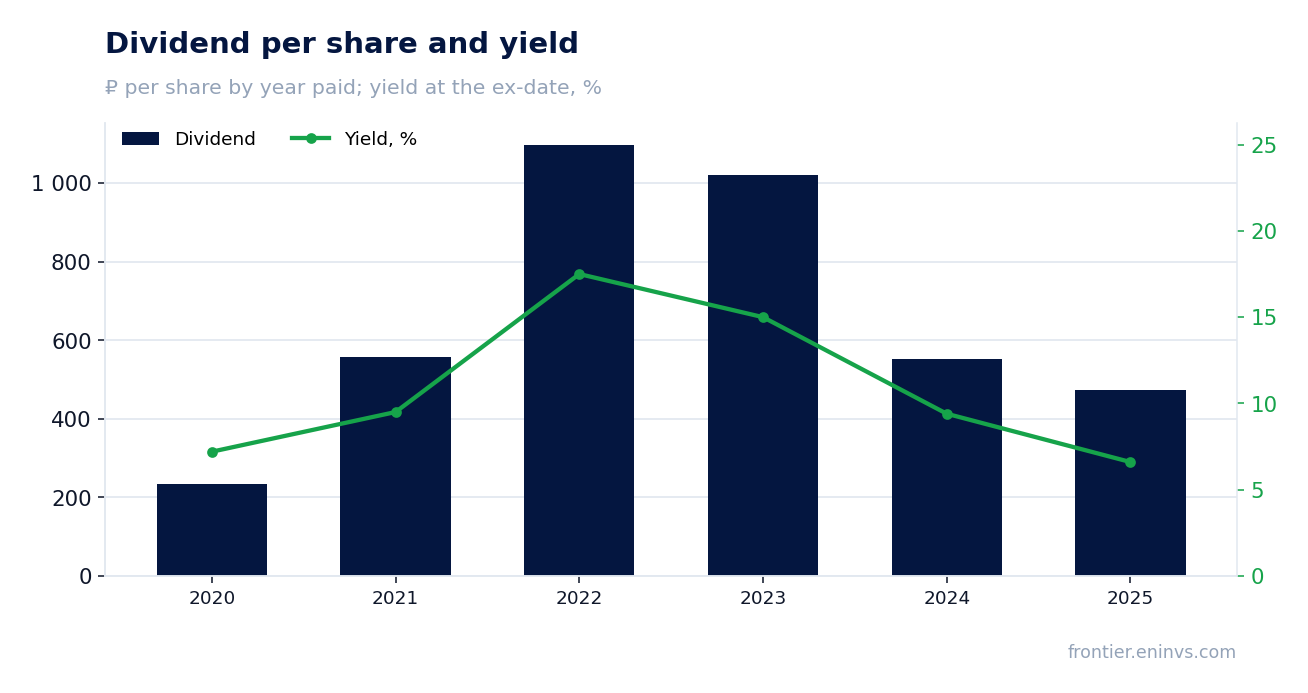
— The dividend for 2025 was RUB 474 per share, while our estimate for the current year is RUB 207.88 per share
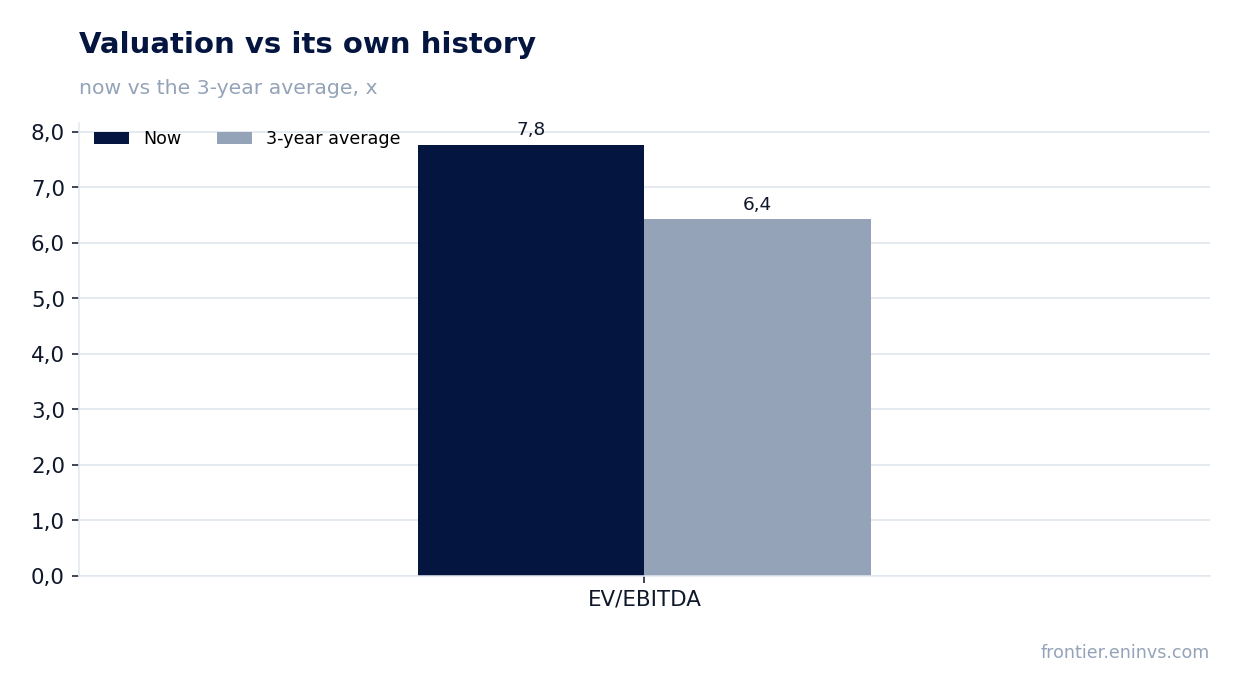
— EV/EBITDA LTM of 7.8 is 21% above its own three-year average of 6.4
Attractiveness
Key figures, RUB bn
| Metric | Q3 2025 | Q3 2026 | Change |
|---|---|---|---|
| Revenue | 143 | 165 | +15.0% |
| EBITDA | 51.1 | 51.3 | +0.5% |
| Operating profit | 40.5 | 39.2 | -3.2% |
| Net profit | 20.1 | 12.6 | -37.2% |
| Operating cash flow | 40.5 | 39.2 | -3.2% |
| Capex | 15.7 | 21.1 | +34.5% |
| EBITDA margin | 35.7% | 31.2% | -4.5 pp |
| Net margin | 14.1% | 7.7% | -6.4 pp |
Revenue rose 15.0% year on year in the third quarter, an acceleration from +7.7% in the second quarter
Revenue for the third quarter of 2026 was RUB 164.7 bn, 15.0% more than a year earlier. In the second quarter growth was more modest at 7.7%, so the pace accelerated. This is the best quarterly revenue result since the fourth quarter of 2024.
The acceleration rests on recovery from a weak base: in the first quarter of 2026 revenue fell 17.5% year on year, in the second it grew 7.7%. The third consecutive quarter shows improvement, but the absolute level of revenue is still below the peaks of 2024–2025.
For profit this growth does not yet convert: EBITDA added only 0.5%, and net profit fell. Revenue is growing faster than costs, but not fast enough to hold the margin.
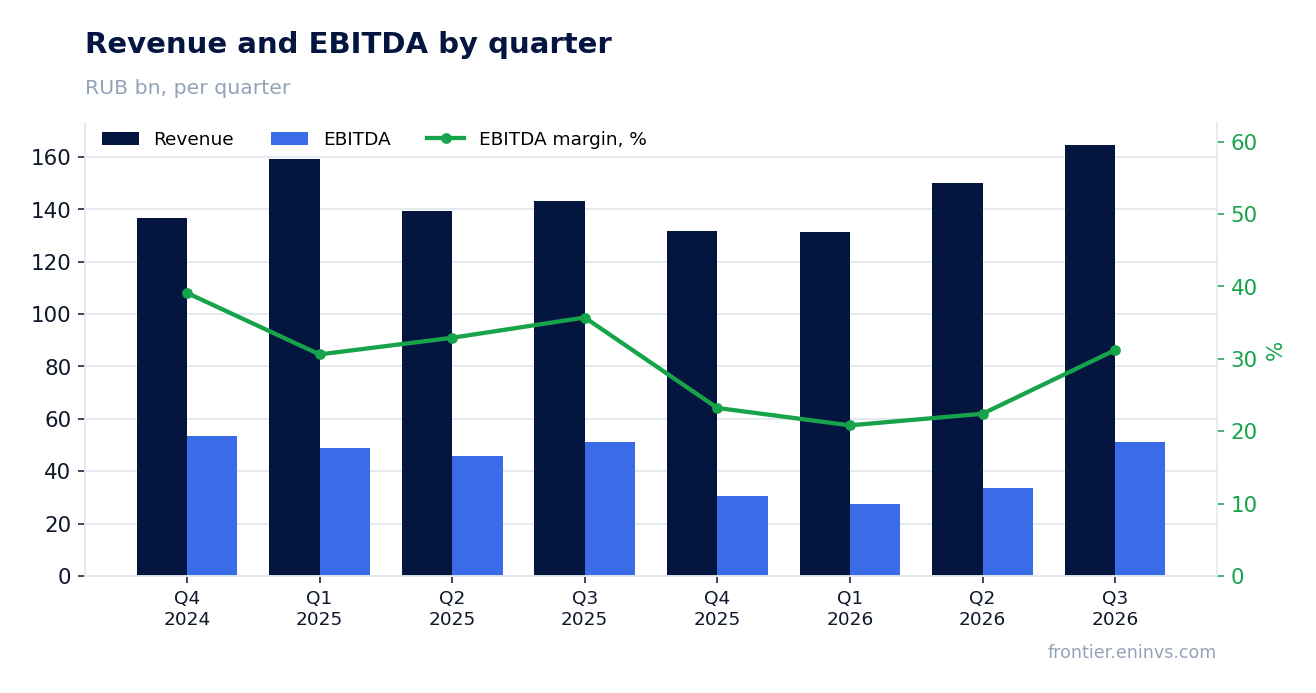
EBITDA added only 0.5% because the margin fell to 31.2% from 35.7%
EBITDA for the third quarter was RUB 51.3 bn, only 0.5% more than a year earlier. With revenue growth of 15.0%, this means the EBITDA margin declined to 31.2% from 35.7% in the third quarter of 2025.
Operating profit was RUB 39.2 bn. The gap between revenue growth and stagnant EBITDA points to cost of sales or selling expenses rising faster than revenue. The facts contain no breakdown by cost line, so the specific cause cannot be named.
A margin of 31.2% is still a high level for the company, but a decline of 4.5 percentage points year on year eats into the effect of sales growth. This is exactly why profit falls while revenue rises.
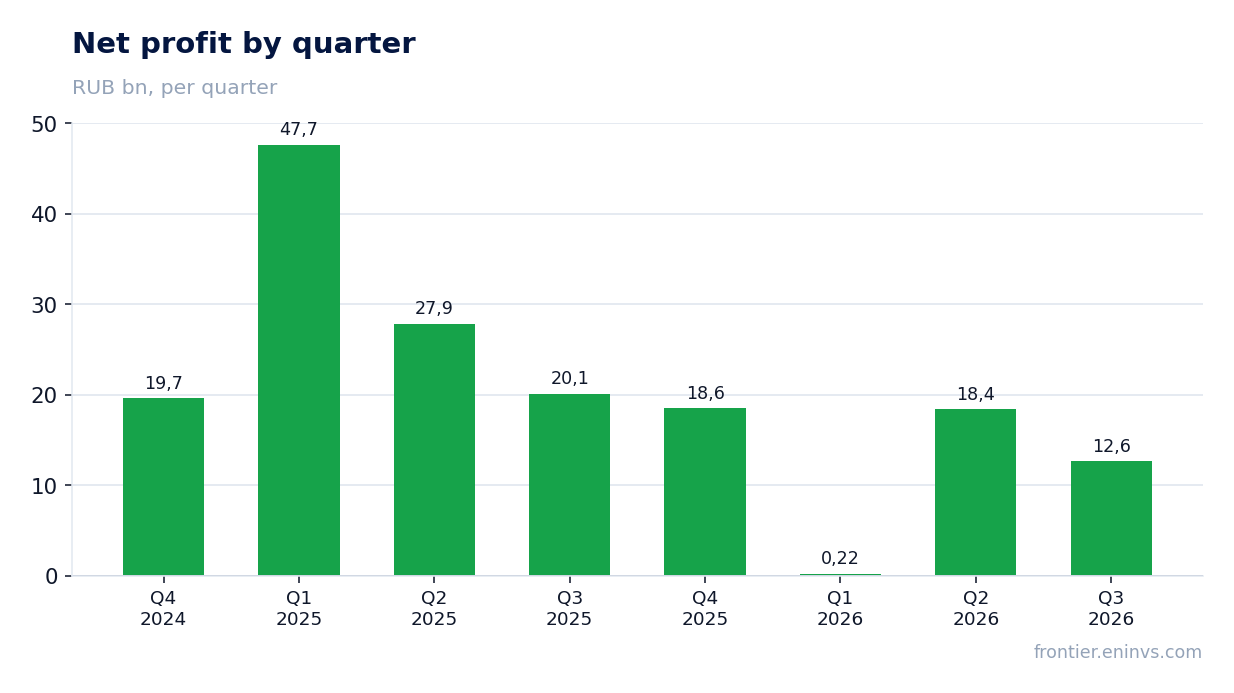
Net profit fell 37.2% to RUB 12.6 bn with a margin of 7.7% versus 14.1% a year earlier
Net profit for the third quarter of 2026 was RUB 12.6 bn, 37.2% less than a year earlier. The net margin fell to 7.7% from 14.1% in the third quarter of 2025.
The profit decline is deeper than the EBITDA decline, which points to rising expenses below the operating line — likely interest. Debt has grown, and servicing it costs more. The facts contain no interest expense figure, so the exact cause cannot be named.
Over the last twelve months net profit was RUB 49.9 bn. This is noticeably below the level of previous years, and this base determines the company's dividend capacity.
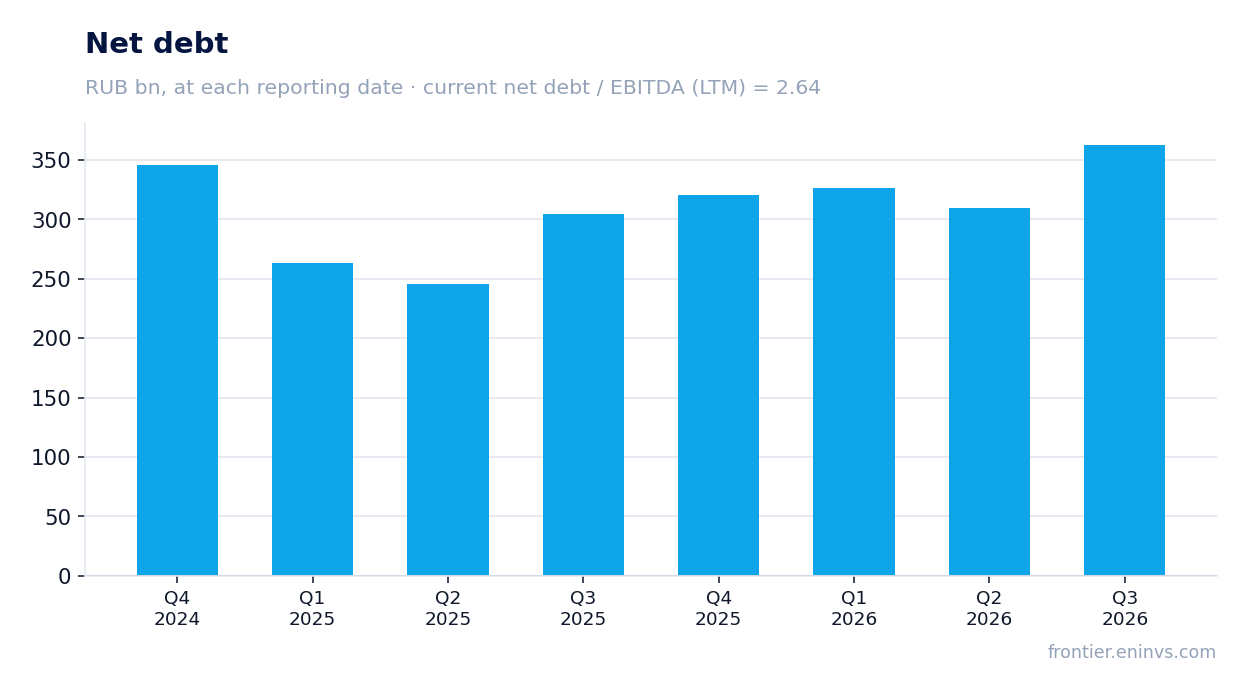
Net debt rose to RUB 362.7 bn at the end of September from RUB 309.2 bn at the end of June
Net debt at 30 September 2026 was RUB 362.7 bn versus RUB 309.2 bn at 30 June 2026 — an increase of RUB 53.5 bn over the quarter. A year earlier, at 30 September 2025, debt was RUB 304.2 bn, so over 12 months it rose by RUB 58.5 bn.
The ratio of net debt to EBITDA LTM is 2.64. This is a level that limits freedom of manoeuvre: with falling EBITDA, leverage becomes more sensitive to further deterioration in results.
Operating cash flow for the third quarter was RUB 39.2 bn, capital expenditures — RUB 21.1 bn. Free cash flow is positive, but it is not enough to cover interest expenses and dividends while servicing debt.
The dividend for 2025 was RUB 474 per share, while our estimate for the current year is RUB 207.88 per share
No dividends were paid over the last 12 months. The last payment was RUB 474 per share for 2025, which at the ex-date price of RUB 7,182 gave a yield of 6.6%. The payment history shows a decline: RUB 1,098 per share in 2022, RUB 1,020 in 2023, RUB 552 in 2024.
Our estimate for the dividend for the current financial year is RUB 207.88 per share, which gives about 3.6% on the current price. This is our forecast, not a board decision: the calculation is based on net profit over the last 12 months and a payout ratio of 0.54 of profit, as last year.
A yield of 3.6% is noticeably below the key rate of 14.0% and below the yield we consider fair for this name — 10.5%. The dividend history of recent years shows payments declining with profit, and at the current profit base the dividend is unlikely to return to the levels of 2022–2023.
EV/EBITDA LTM of 7.8 is 21% above its own three-year average of 6.4
On the EV/EBITDA LTM multiple of 7.8, the share trades 21% above its three-year average of 6.4. This means the market values the company more expensively than usual over the last three years, despite falling profit.
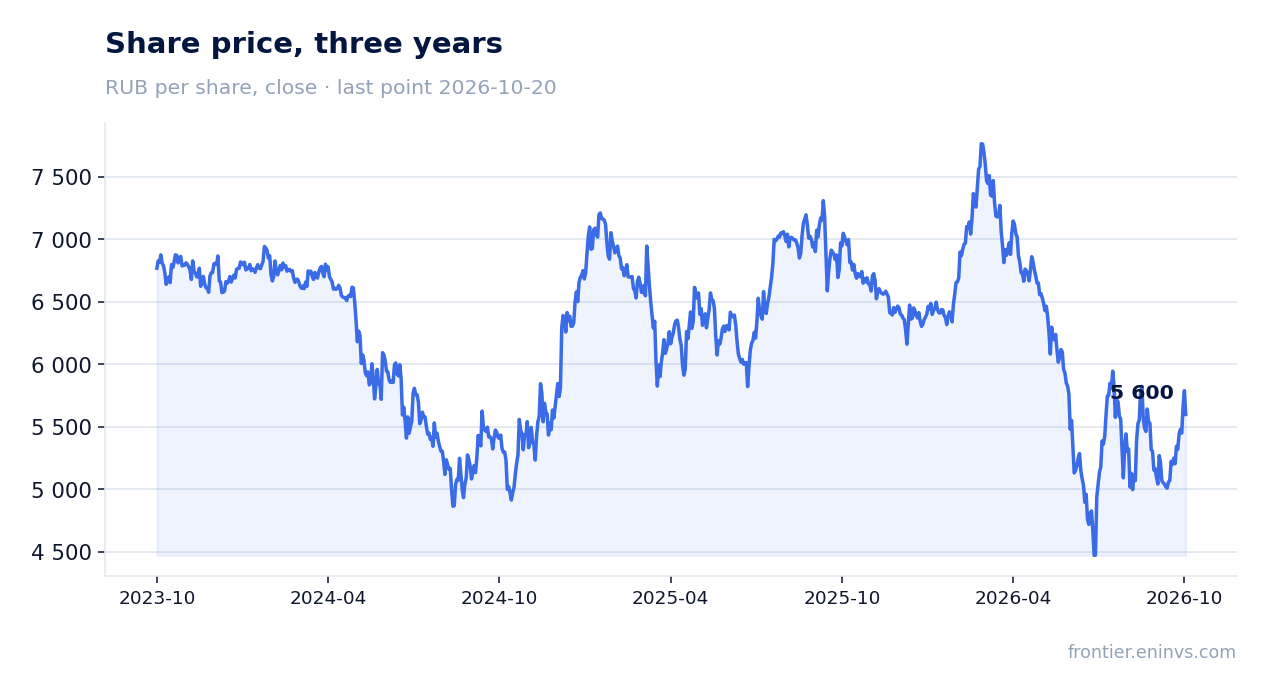
P/E LTM is 15.0. With net profit over the last 12 months of RUB 49.9 bn and a market capitalisation of RUB 747.2 bn, this does not look cheap for a company with a falling margin.
On the portal's model, which reprices EBITDA at current commodity prices at the target EV/EBITDA, the upside of the share to fair value is estimated at minus 32%. This is our own estimate, not a market consensus.
Valuation on the latest reported figures
| Metric | Value |
|---|---|
| Market cap | 747 bn ₽ |
| P/E (LTM) | 15.0 |
| EV/EBITDA (LTM) | 7.8 |
| P/B | 3.12 |
| Net debt / EBITDA (LTM) | 2.64 |
| Operating cash flow (LTM) | 97.4 bn |
| ROE | 6.1% |
| EV/EBITDA, 3-year average | 6.4 |
Dividend per share, ₽, and yield at the ex-date
| Year paid | Dividend | Yield |
|---|---|---|
| 2020 | 234.00 | 7.2% |
| 2021 | 558.00 | 9.5% |
| 2022 | 1098.00 | 17.5% |
| 2023 | 1020.00 | 15.0% |
| 2024 | 552.00 | 9.4% |
| 2025 | 474.00 | 6.6% |
| Our estimate, current year | 207.88 | 3.6% on the current price |
Bottom line
The strong side of the report is the acceleration of revenue to 15.0% year on year, the best quarterly result since the end of 2024. But growth does not convert into profit: EBITDA added only 0.5%, net profit fell 37.2%, and the margin compressed. Debt rose to RUB 362.7 bn, the dividend forecast is modest, and the valuation is above its own history. The verdict is unattractive: the share offers neither growing profit, nor a high dividend yield, nor a discount to history.
Open the company's financial profile PHOR →
See also: market overview · valuation map · stock screeners