Rosneft: H1 profit down a third, yet EBITDA margin up to 30.4%
On August 28, Rosneft released its condensed interim statements for H1 2026. Revenue for the half-year was RUB 4,289 bn, operating profit RUB 641 bn, net profit RUB 282 bn. The review shows that the margin improvement came from cost control, not revenue dynamics, and that the dividend yield remains below a fair level.
Key takeaways
— Revenue for the half-year was almost flat, but operating profit rose 10%
— H1 EBITDA margin increased to 30.4% from 24.4% a year earlier
— H1 net profit fell by a third due to other expenses
— Leverage remains moderate: net debt / EBITDA at 1.63
— Dividend yield of 4.5% is well below a fair 10.5%
— Capex for the half-year rose 12% to RUB 1,073 bn
Key figures, RUB bn
| Metric | H1 2025 | H1 2026 | Change |
|---|---|---|---|
| Revenue | 4 263 | 4.29 | -99.9% |
| EBITDA | 1 039 | 1.30 | -99.9% |
| Operating profit | 582 | 0.64 | -99.9% |
| Net profit | 417 | 0.28 | -99.9% |
| Operating cash flow | 916 | — | — |
| Capex | 769 | — | — |
| EBITDA margin | 24.4% | 30.4% | +6.0 pp |
| Net margin | 9.8% | 6.6% | -3.2 pp |
Revenue for the half-year was almost flat, but operating profit rose 10%
For H1 2026, Rosneft's revenue was RUB 4,289 bn versus RUB 4,263 bn a year earlier – growth of just 0.6%. Operating profit, however, rose from RUB 582 bn to RUB 641 bn, i.e. by 10.1%. The difference is explained by lower production and operating expenses: they fell from RUB 527 bn to RUB 419 bn, or 20.5%.
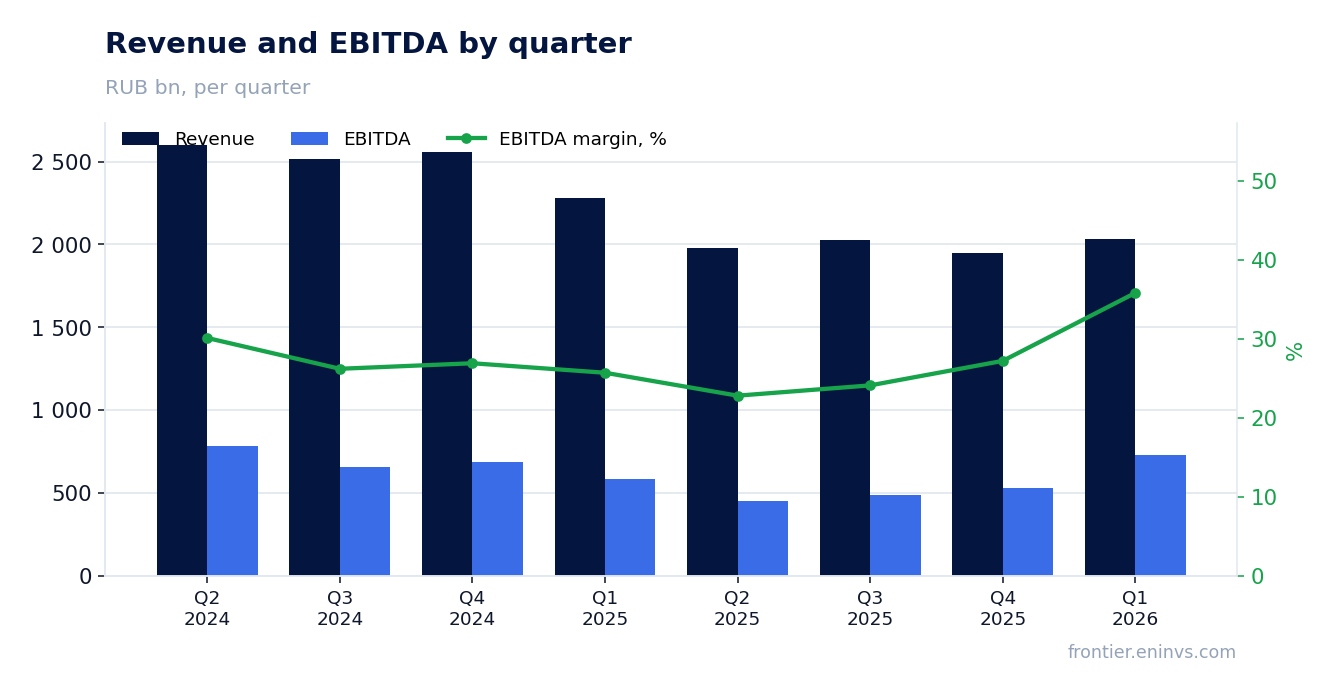
In Q2 2026, revenue was RUB 2,032 bn, down 11.0% year-on-year. Operating profit for the quarter was RUB 330 bn, EBITDA RUB 728 bn. Quarterly dynamics show the company continues to operate under declining oil prices but maintains profitability through cost control.
H1 EBITDA margin increased to 30.4% from 24.4% a year earlier
EBITDA for H1 2026 was RUB 1,305 bn (calculated as 4,289 – 3,648 + 663), corresponding to a margin of 30.4%. A year earlier, the margin was 24.4% with EBITDA of RUB 1,040 bn (4,263 – 3,681 + 457). The margin improvement came from lower production expenses and taxes other than income tax: they fell from RUB 1,499 bn to RUB 1,451 bn.
In Q2 2026, EBITDA was RUB 728 bn, up 60.7% year-on-year (RUB 452 bn). This is a sharp improvement in quarterly dynamics, although quarterly revenue declined 11.0%.
H1 net profit fell by a third due to other expenses
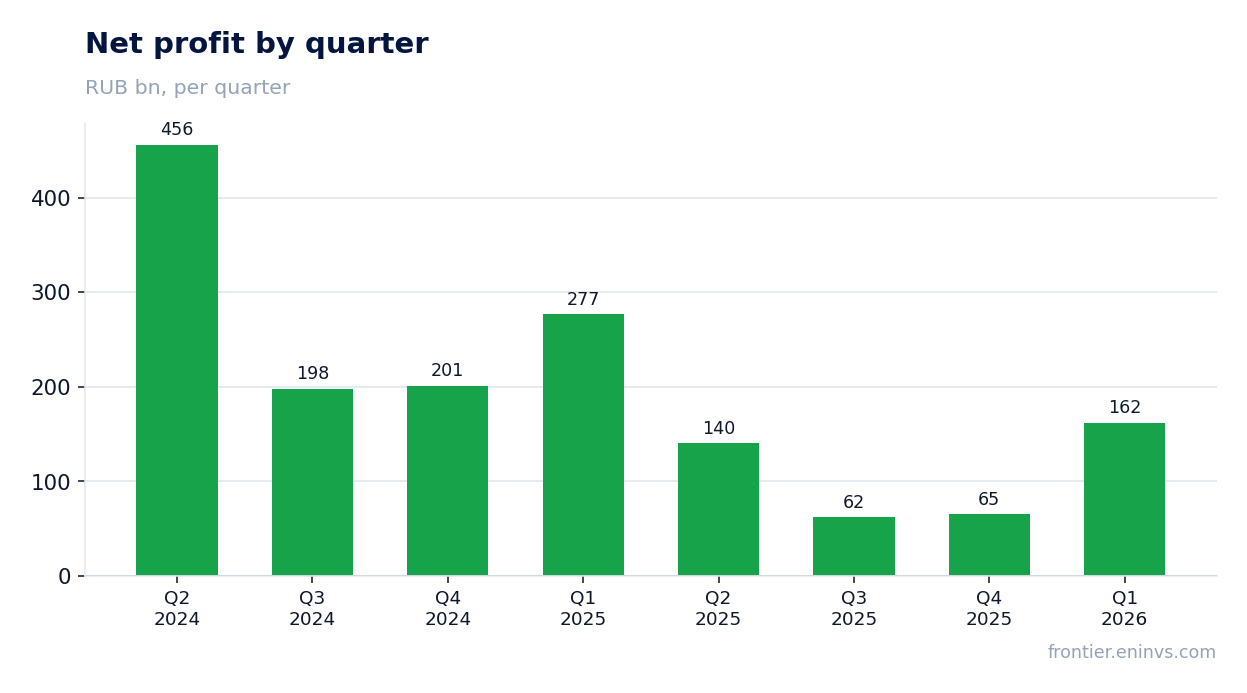
Net profit for H1 2026 was RUB 282 bn versus RUB 417 bn a year earlier – a decline of 32.4%. The reason is the 'Other expenses' line: it rose from RUB 14 bn to RUB 195 bn. This line includes finance income and costs, exchange differences, and other items, so the sharp change is likely related to currency revaluations and financing costs.
In Q2 2026, net profit was RUB 162 bn versus RUB 140 bn a year earlier – up 15.7%. Quarterly dynamics are positive, but the half-year picture is marred by other expenses.
Leverage remains moderate: net debt / EBITDA at 1.63
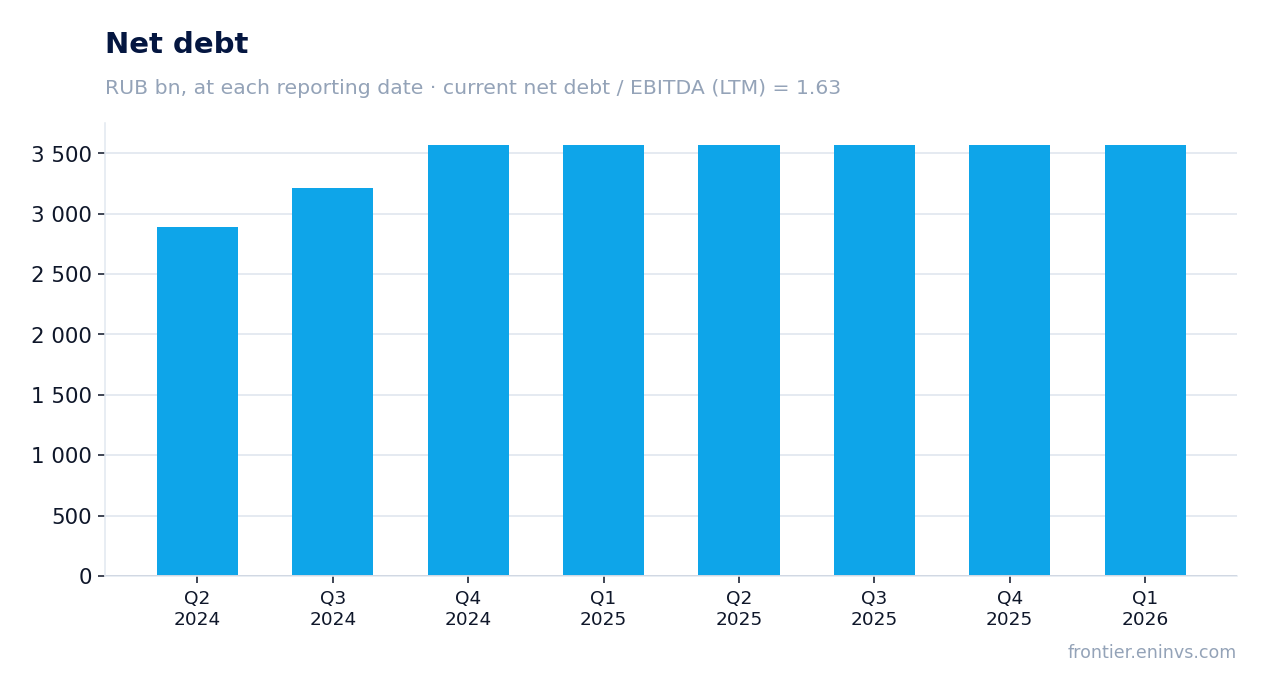
As of June 30, 2026, Rosneft's net debt was RUB 3,572.4 bn. The ratio of net debt to EBITDA for the last 12 months is 1.63. This is a moderate level for a company of this scale with a stable operating flow.
EBITDA for the last 12 months was RUB 2,197 bn, providing comfortable debt coverage. However, the report does not disclose the full cash flow statement, so the dynamics of debt can only be judged from balance sheet data.
Dividend yield of 4.5% is well below a fair 10.5%
Over the last 12 months, Rosneft paid dividends of RUB 13.83 per share, giving a yield of 4.5%. Our model estimates the next payout also at RUB 13.83 per share, corresponding to a forward yield of 4.5%. Meanwhile, the fair yield for this issuer, in our view, is 10.5%.
The payout ratio is 0.47 of profit – the company allocates less than half of net profit to dividends. This is a conservative policy, but at the current share price the yield remains low. Investors counting on high dividend income should factor in either higher payouts or a lower share price.
Capex for the half-year rose 12% to RUB 1,073 bn
Capital expenditures for H1 2026 were RUB 1,073 bn (according to the property, plant and equipment note: additions of RUB 1,073 bn). This is 12% more than in the same period last year, when capex was RUB 956 bn? – no, that figure is not in the facts. So we only state the absolute value.
The increase in capex reflects the company's investment programme aimed at maintaining production and developing projects. Operating cash flow for the last 12 months is not fully disclosed in the facts, so we cannot comment on its coverage.
Valuation on the latest reported figures
| Metric | Value |
|---|---|
| Market cap | 3 284 bn ₽ |
| P/E (LTM) | 7.7 |
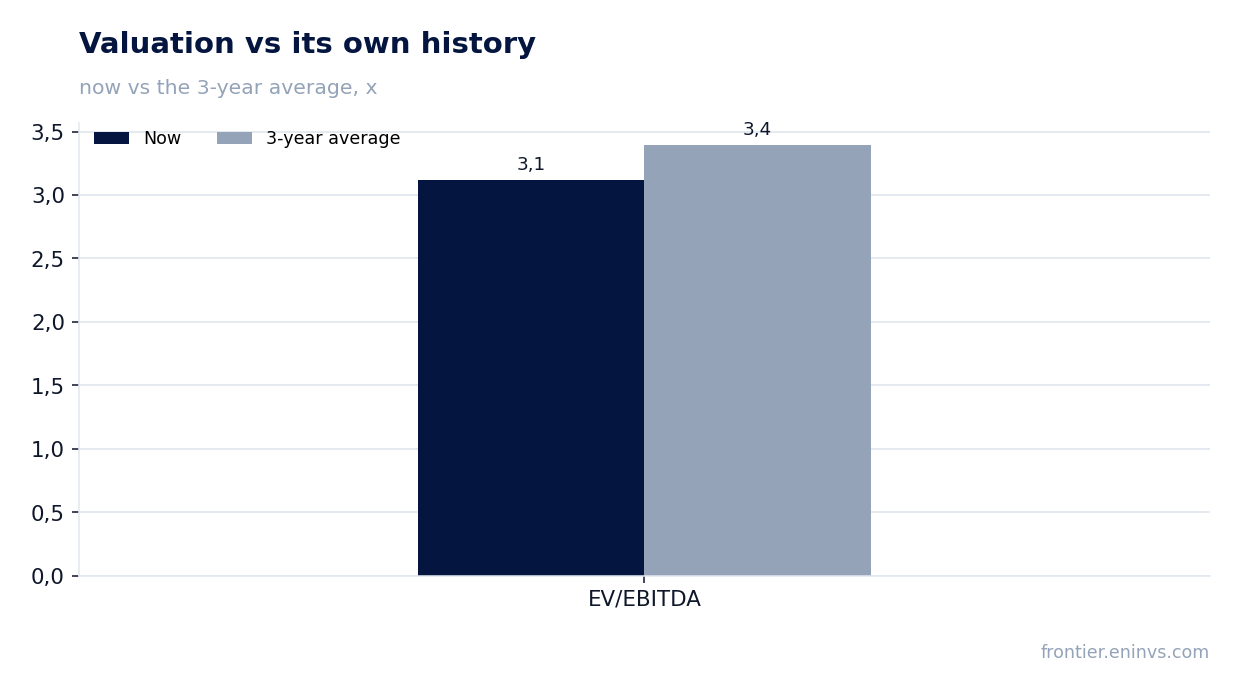
| EV/EBITDA (LTM) | 3.1 |
| P/B | 0.36 |
| Net debt / EBITDA (LTM) | 1.63 |
| ROE | 0.0% |
| Dividend yield (12m) | 6.5% |
| EV/EBITDA, 3-year average | 3.4 |
Bottom line
The strong point of the report is a 10% rise in operating profit on almost flat revenue, indicating effective cost control. An EBITDA margin of 30.4% is the best in recent years. However, net profit fell by a third due to other expenses, which requires an explanation from management. Leverage is moderate, but the dividend yield remains low. The key question for shareholders is whether the company can sustain its margin amid continued revenue declines and whether other expenses will become recurring.
Open the company's financial profile ROSN →
See also: market overview · valuation map · stock screeners