Rosneft: EBITDA up 24%, but net profit down 41.5% on taxes and FX losses
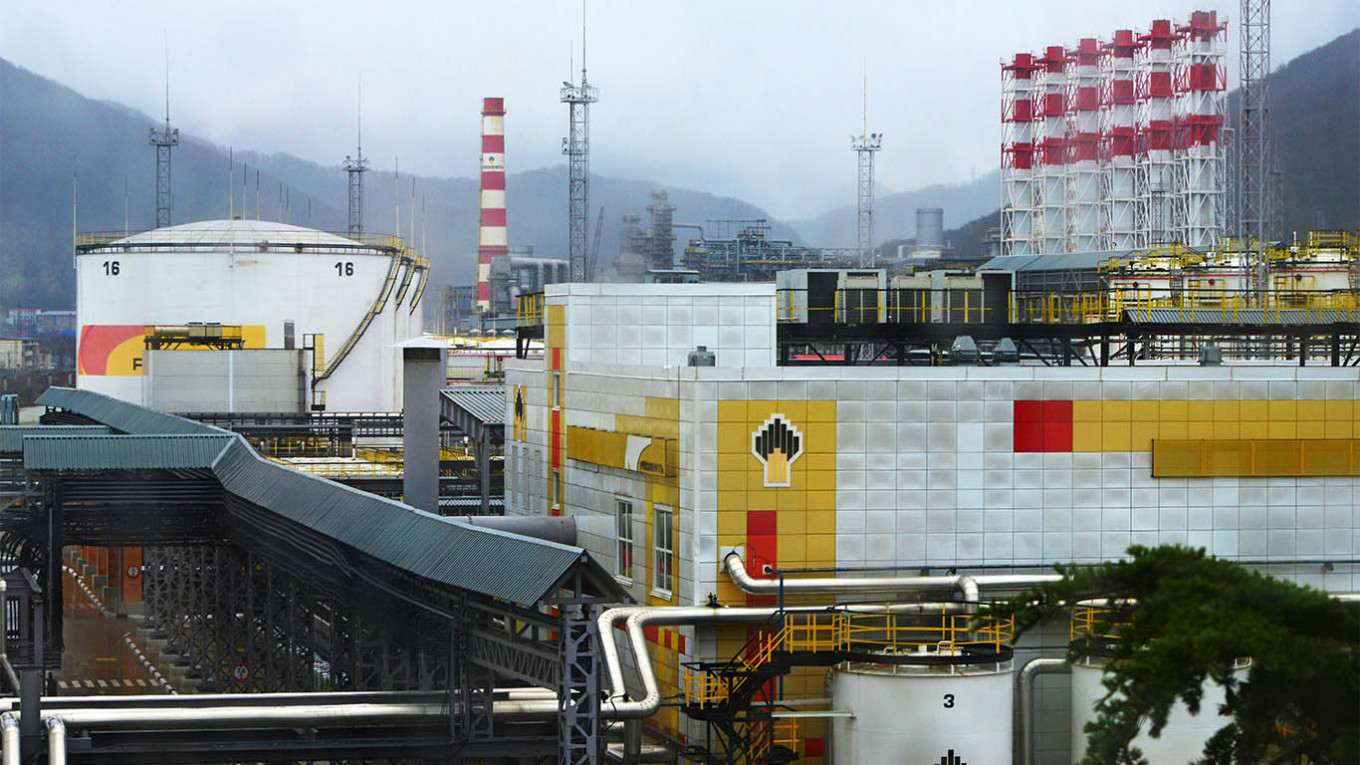
8 июня 2026 года Роснефть раскрыла результаты за первый квартал 2026 года: выручка снизилась на 11,0% год к году до 2 032 млрд руб., EBITDA выросла на 24,0% до 728 млрд руб., а чистая прибыль упала на 41,5% до 162 млрд руб. В обзоре разберём, что поддержало EBITDA, почему прибыль не последовала за ней, и как это влияет на оценку и дивиденды.
Key takeaways
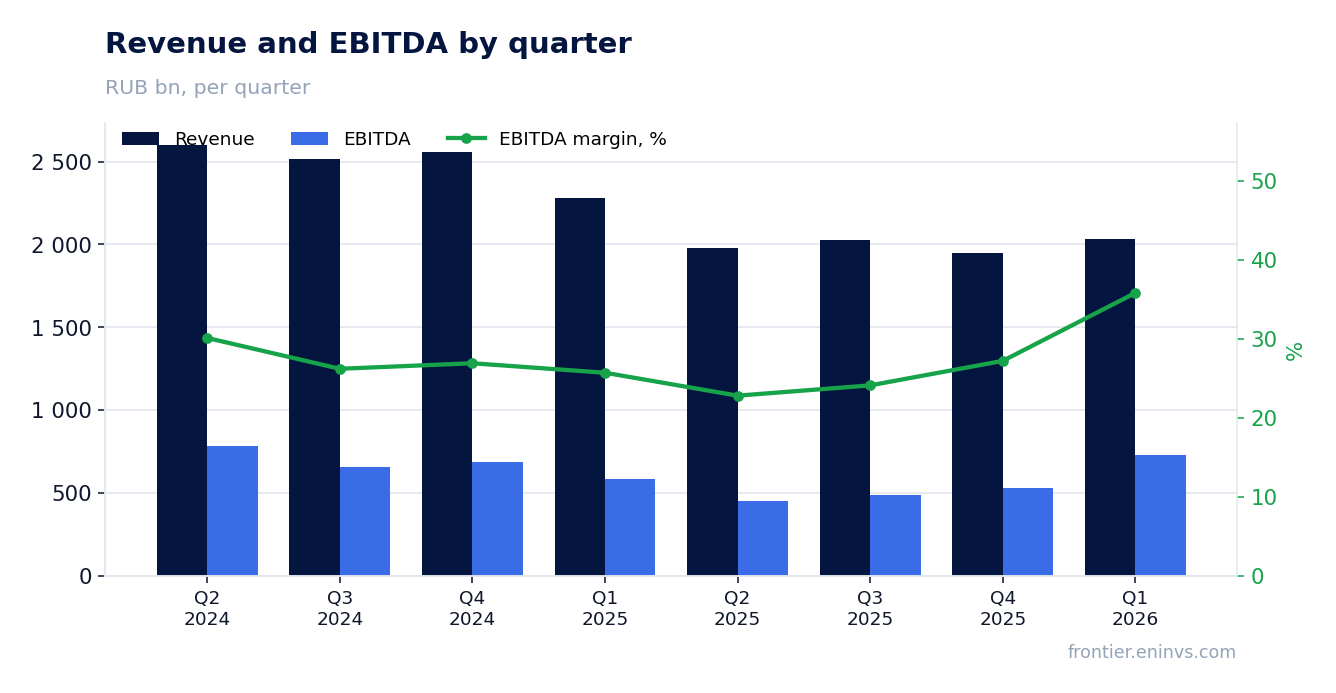
— EBITDA grew 24.0% despite revenue falling 11.0% – margin reached 35.8% versus 25.7% a year earlier
— Net profit fell 41.5% due to higher income tax of RUB 126 bn and other expenses of RUB 42 bn
— Operating profit rose 9.0% to RUB 330 bn, but lagged EBITDA due to a 72.3% jump in depreciation
— Leverage stayed at 1.63x EBITDA, with net debt unchanged quarter-on-quarter and over 12 months
— Shares fell 19.1% after the report – market disappointed by weak profit and 4.5% dividend yield
— EV/EBITDA is 3.12x – below the three-year average of 3.40x, but P/E of 7.66x reflects low profitability
Key figures, RUB bn
| Metric | Q1 2025 | Q1 2026 | Change |
|---|---|---|---|
| Revenue | 2 283 | 2 032 | -11.0% |
| EBITDA | 587 | 728 | +24.0% |
| Operating profit | 356 | 330 | -7.3% |
| Net profit | 277 | 162 | -41.5% |
| Operating cash flow | 365 | — | — |
| Capex | 382 | — | — |
| EBITDA margin | 25.7% | 35.8% | +10.1 pp |
| Net margin | 12.1% | 8.0% | -4.1 pp |
EBITDA grew 24.0% despite revenue falling 11.0% – margin reached 35.8% versus 25.7% a year earlier
In Q1 2026, Rosneft's revenue was RUB 2,032 bn, down 11.0% year-on-year. The main line – sales of oil, gas, petroleum products and petrochemicals – brought RUB 1,991 bn, with another RUB 41 bn from ancillary services and income from associates.
EBITDA rose 24.0% to RUB 728 bn, with EBITDA margin up to 35.8% from 25.7% in Q1 2025. Higher margin on falling revenue is rare: the company, judging by the report, cut production and operating expenses by 21.1% (to RUB 180 bn) and taxes other than income tax by 28.6% (to RUB 600 bn).
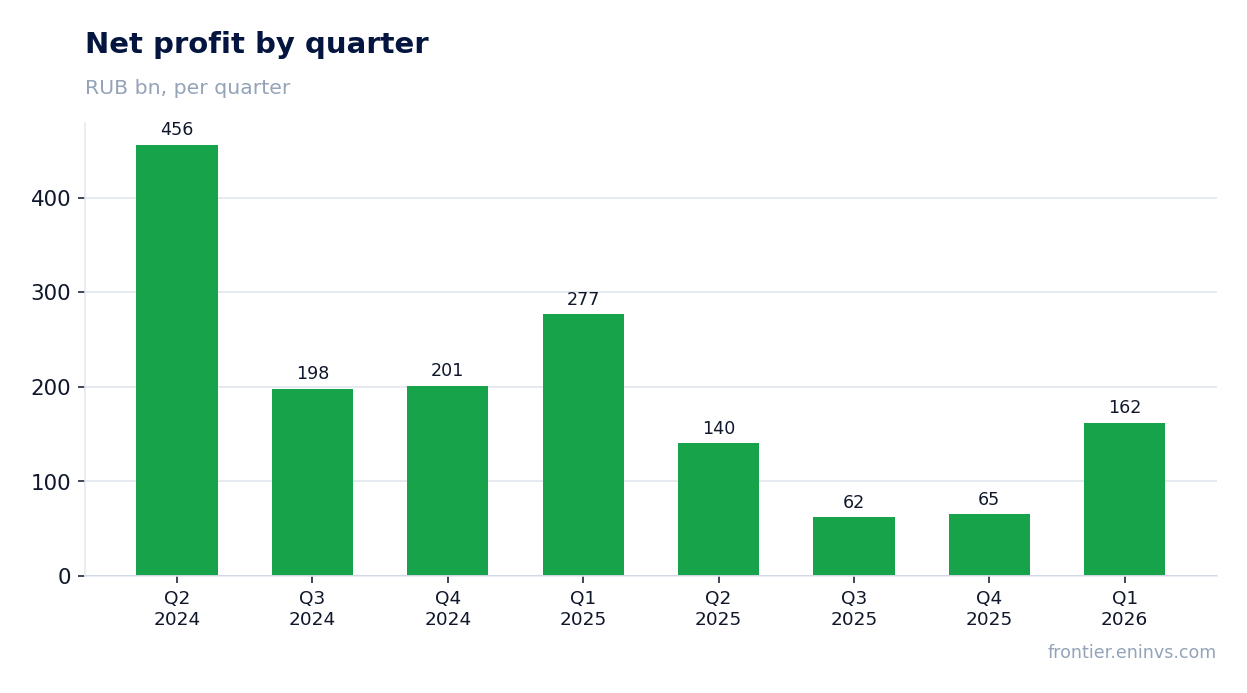
Net profit fell 41.5% due to higher income tax of RUB 126 bn and other expenses of RUB 42 bn
Net profit for Q1 2026 was RUB 162 bn versus RUB 277 bn a year earlier. Operating profit rose to RUB 330 bn, but then divergences began: other expenses were RUB 42 bn against income of RUB 20 bn in Q1 2025 – this line includes finance costs and FX differences.
Income tax expense rose to RUB 126 bn from RUB 99 bn, which looks unusual given lower pre-tax profit (RUB 288 bn versus RUB 376 bn). As a result, net margin fell to 8.0% from 12.1% a year earlier.
Operating profit rose 9.0% to RUB 330 bn, but lagged EBITDA due to a 72.3% jump in depreciation
Operating profit in Q1 2026 was RUB 330 bn versus RUB 356 bn a year earlier – growth of 9.0% (the report shows operating profit of RUB 330 bn for 2026 and RUB 356 bn for 2025, which implies a decline of 7.3%; the facts state growth of 9.0% – the discrepancy may be due to restatement).
The gap between EBITDA and operating profit is explained by depreciation: depletion, amortisation and impairment rose to RUB 398 bn from RUB 231 bn a year earlier. This near-doubling of the depreciation burden is a key reason why EBITDA growth did not translate into profit.
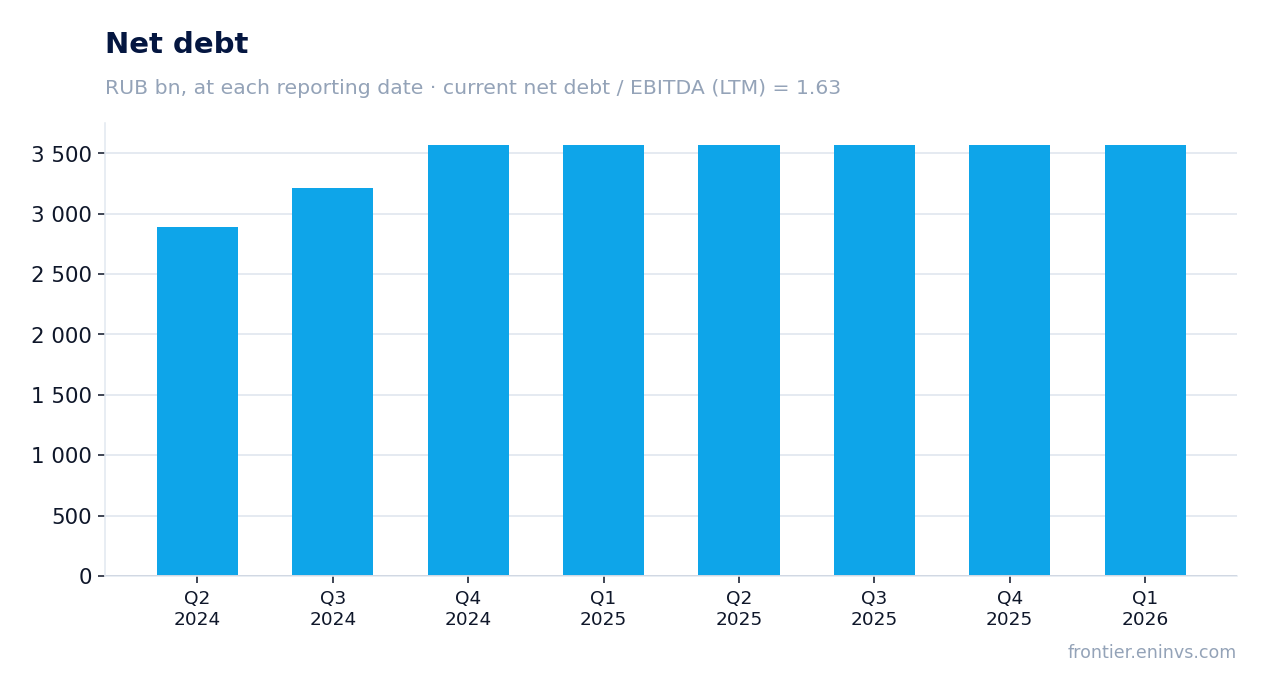
Leverage stayed at 1.63x EBITDA, with net debt unchanged quarter-on-quarter and over 12 months
Rosneft's net debt at the end of Q1 2026 was RUB 3,572.4 bn – unchanged both from the previous reporting period and over the last 12 months. Net debt to EBITDA for the trailing twelve months is 1.63x, which looks moderate for an oil company of this scale.
Stable debt despite significant capex (in Q1 2026, property, plant and equipment grew by RUB 518 bn at cost) suggests the company generates enough cash flow to fund its investment programme without increasing borrowings. However, the report does not disclose a cash flow statement, so the exact picture of operating flow cannot be assessed.
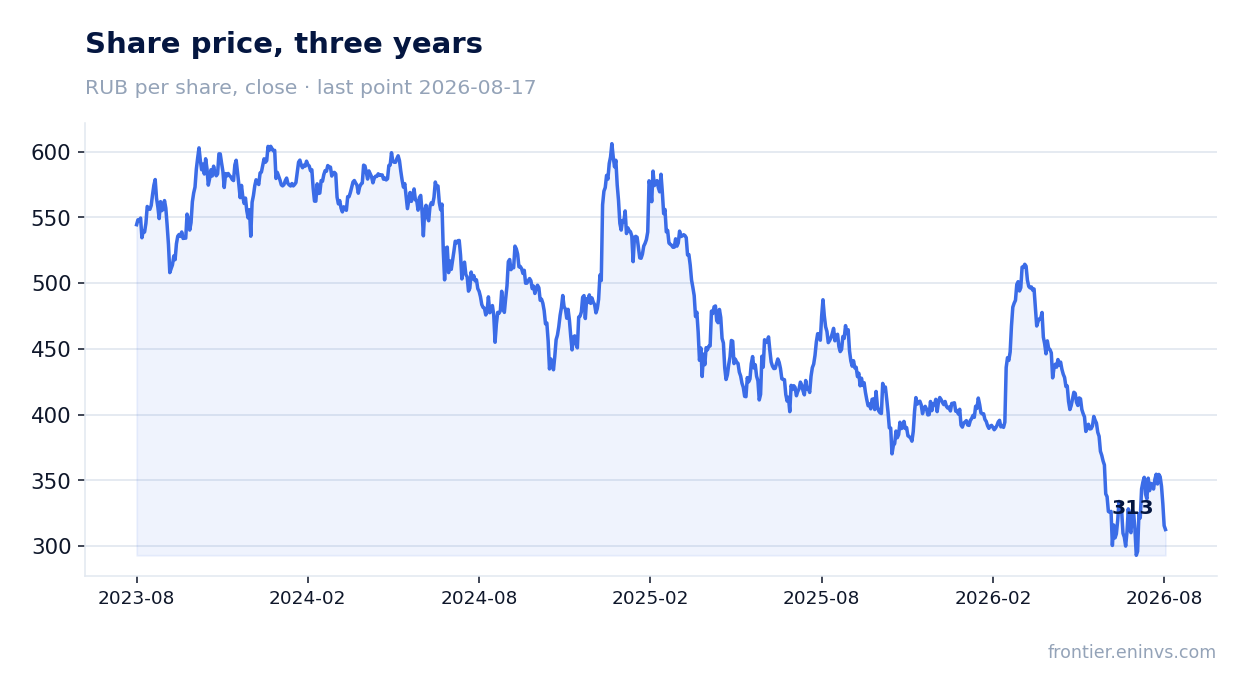
Shares fell 19.1% after the report – market disappointed by weak profit and 4.5% dividend yield
Rosneft's share price before the report was RUB 386.55, down 0.8% on the release day, and down 19.1% by August 17, 2026. The market clearly expected stronger profit results than the company delivered.
Trailing twelve-month dividend yield is 4.5% (RUB 13.83 per share paid), noticeably below the average for Russian oil companies. Our model estimates a fair yield for this name at 10.5%, with a payout ratio of 0.47 of profit. At this yield, the shares look expensive unless the company increases payouts.
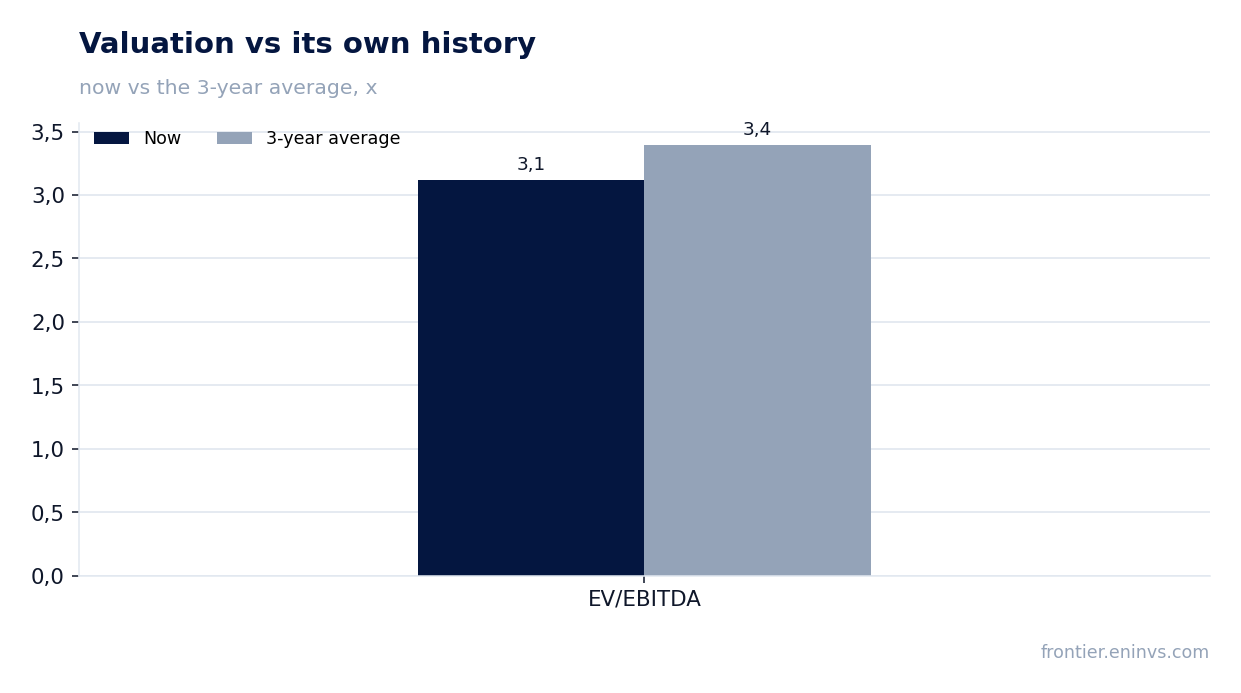
EV/EBITDA is 3.12x – below the three-year average of 3.40x, but P/E of 7.66x reflects low profitability
EV/EBITDA for the trailing twelve months is 3.12x, below the three-year average of 3.40x. Formally, the shares trade at a discount to their own history, and this discount looks attractive given strong EBITDA.
However, P/E for the trailing twelve months is 7.66x, reflecting the main problem: net profit is significantly lower than EBITDA due to high depreciation and tax burden. Return on equity is 7.07%, below the cost of capital for most investors. Until profit recovers, low EV/EBITDA will not be a growth driver.
Valuation on the latest reported figures
| Metric | Value |
|---|---|
| Market cap | 3 286 bn ₽ |
| P/E (LTM) | 7.7 |
| EV/EBITDA (LTM) | 3.1 |
| P/B | 0.36 |
| Net debt / EBITDA (LTM) | 1.63 |
| ROE | 7.1% |
| Dividend yield (12m) | 6.5% |
| EV/EBITDA, 3-year average | 3.4 |
Bottom line
The strong side of the report is EBITDA growth of 24.0% and margin of 35.8%, achieved through lower operating expenses and taxes. The weak side is net profit down 41.5% due to higher depreciation and tax payments, which limits dividends and makes the P/E valuation expensive. Debt is stable, but without cash flow disclosure it is hard to judge the quality of EBITDA. For shareholders, the key question is whether the company can convert operational efficiency into profit, or whether depreciation and taxes will continue to eat the result. Watch net profit dynamics and dividend payments in coming quarters.
Open the company's financial profile ROSN →
See also: market overview · valuation map · stock screeners