TBank: Q2 2026 profit fell 15.4% even as net interest income rose 31.2%

On 28 September TBank reported results for the second quarter of 2026. Net interest income rose 31.2% year on year to RUB 162.2 bn, while net profit fell 15.4% to RUB 39.5 bn, with an EBITDA margin of 45.3%. The bank remains a dividend story with a trailing yield of 6.3%, but rising provisions are eating the operating leverage. At the current price the share looks rather attractive for a dividend holder than for a bet on profit growth.
Key takeaways
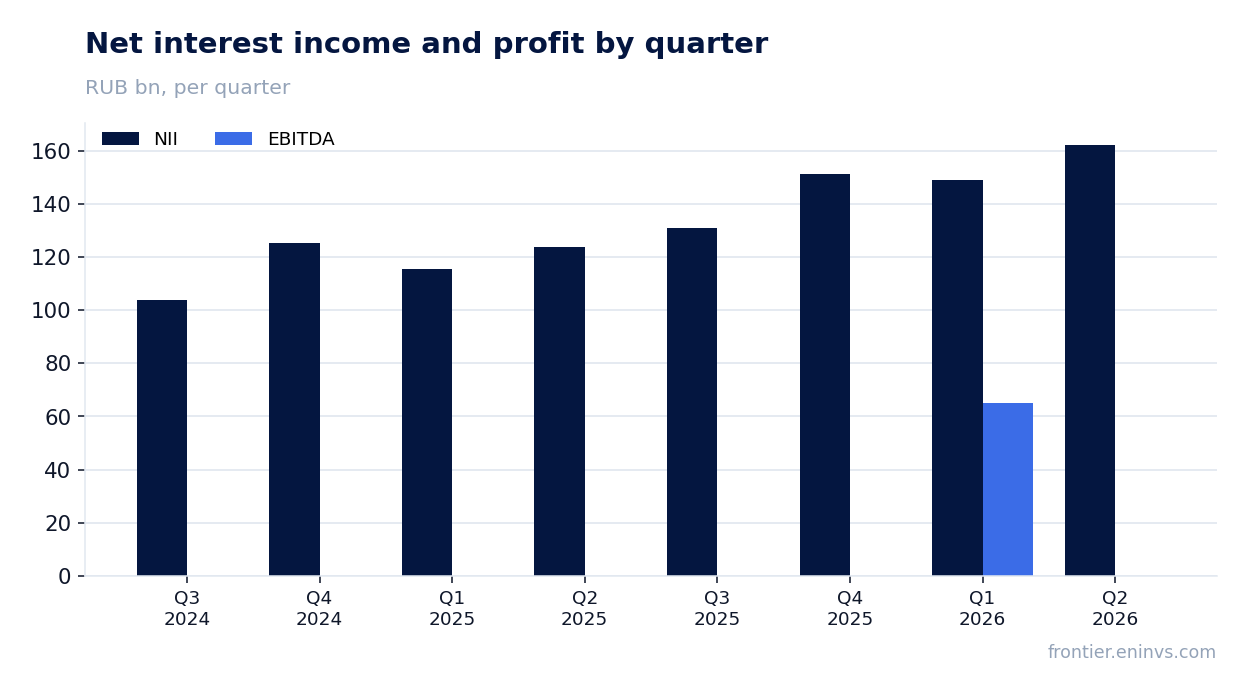
— Net interest income rose 31.2% year on year to RUB 162.2 bn, the cleanest growth signal
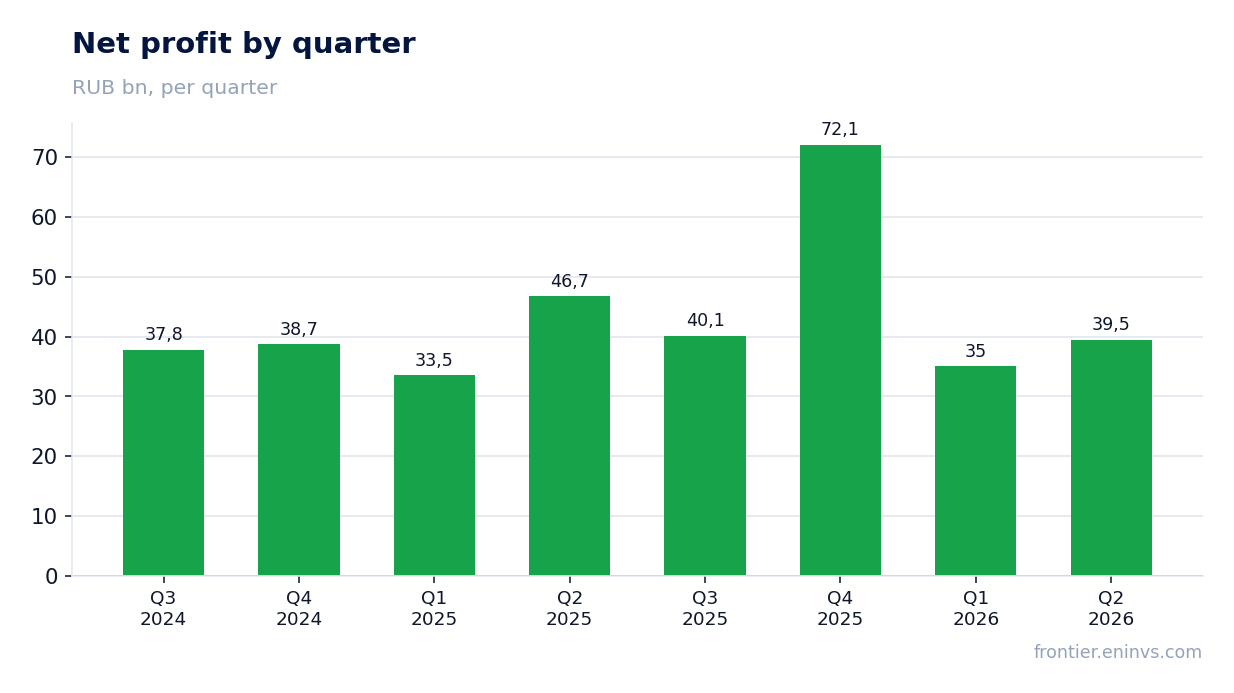
— Net profit fell 15.4% year on year to RUB 39.5 bn on higher provisions
— EBITDA margin was 45.3%, but provisions are eating profit
— Dividend for 2025 was RUB 10.0 per share, and we estimate RUB 17.4 per share for 2026
— Trailing yield of 6.3% is below the 10.5% yield we consider fair
— P/E LTM 3.75 and ROE 20.9% – valuation remains low
Attractiveness
Key figures, RUB bn
| Metric | Q2 2025 | Q2 2026 | Change |
|---|---|---|---|
| Net interest income | 124 | 162 | +31.2% |
| EBITDA | — | 73.4 | — |
| Operating profit | — | 61.1 | — |
| Net profit | 46.7 | 39.5 | -15.4% |
| Capex | 26.0 | 14.0 | -46.1% |
| EBITDA margin | — | 45.3% | — |
| Net margin | 37.8% | 24.4% | -13.4 pp |
Net interest income rose 31.2% year on year to RUB 162.2 bn, the cleanest growth signal
Net interest income in Q2 2026 was RUB 162.2 bn, up 31.2% year on year. This is an acceleration from Q1 2026, when growth was 29.2%. Interest income is growing faster than in recent quarters, indicating continued demand for the bank's credit products.
The main driver is growth in earning assets, along with a lower cost of funding. In Q1 2026 interest expenses fell 8% year on year as deposit costs declined following the key rate cut. This trend likely continued in Q2, supporting net interest income.
Net interest income is the key operating metric for a bank, and its dynamics show the core business is growing. However, bottom-line profit depends not only on it but also on provisions, which have been rising faster than income in recent quarters.
Net profit fell 15.4% year on year to RUB 39.5 bn on higher provisions
Net profit in Q2 2026 was RUB 39.5 bn, down 15.4% from the same period last year. This contrasts sharply with the 31.2% growth in net interest income. The reason is faster growth in loan loss provisions.
In Q1 2026 provisions rose 35% year on year to RUB 45.5 bn. If the trend continued in Q2, it explains the profit decline. Rising provisions signal deteriorating credit quality, a key risk for the bank.
Net profit as a share of net interest income fell to 24.4% from 37.8% a year earlier. This is not a margin but a measure of how much of net interest income reaches the bottom line after all costs and provisions. The decline shows pressure on profit has intensified.
EBITDA margin was 45.3%, but provisions are eating profit
EBITDA in Q2 2026 was RUB 73.4 bn, with an EBITDA margin of 45.3%. This is a high level, indicating strong operating efficiency. However, EBITDA does not account for provisions, which are a key factor for a bank.
Operating profit was RUB 61.1 bn, also confirming the resilience of the operating business. But net profit was significantly lower at RUB 39.5 bn. The difference is explained by provisions and taxes.
Thus, operating efficiency is high, but credit risk is eating a significant portion of profit. For an investor, this means that even with strong operating leverage, the bottom line can be weak due to asset quality.
Dividend for 2025 was RUB 10.0 per share, and we estimate RUB 17.4 per share for 2026
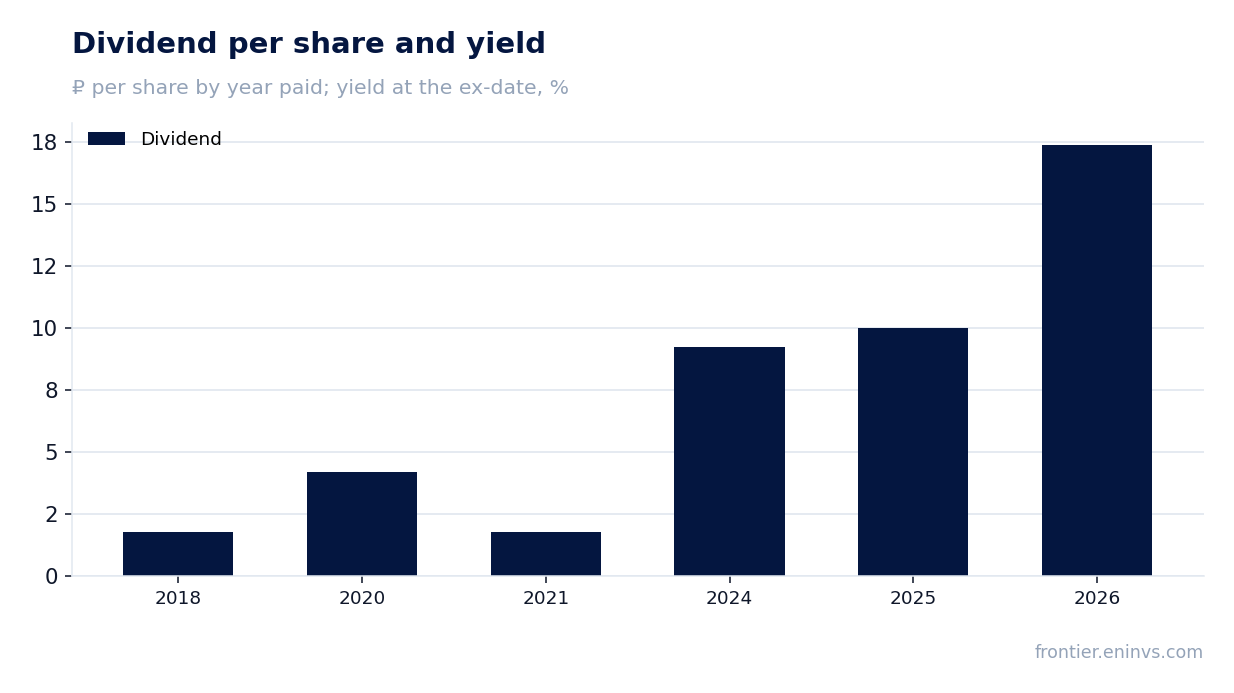
Over the last 12 months TBank paid RUB 16.2 per share, giving a trailing dividend yield of 6.3%. For the 2025 calendar year the payout was RUB 10.0 per share. Our model estimates the next dividend at RUB 17.4 per share, implying a forward yield of 6.7% at the current price.
The estimate is based on an expected payout ratio of 0.74 of profit. This means the bank pays out nearly three-quarters of net profit. Such a high payout ratio supports the yield but makes the dividend sensitive to profit: if profit falls, the payout may be cut.
The yield we consider fair for this name is 10.5%. The current forward yield of 6.7% is below that level, suggesting the market prices in lower dividend risk than we do. The central bank key rate is 14.0%, and the spread between the dividend yield and the key rate remains negative.
The dividend could be smaller if pressure on profit persists. Rising provisions already led to a 15.4% year-on-year decline in net profit in Q2. If this trend continues, full-year profit may be below our forecast, and a payout ratio of 0.74 would not support RUB 17.4 per share.
Trailing yield of 6.3% is below the 10.5% yield we consider fair
The trailing dividend yield is 6.3%, and the forward yield on our estimate is 6.7%. We consider a fair yield for this name to be 10.5%. The gap means the market either underestimates the risk of a dividend cut or expects higher profit growth than we do.
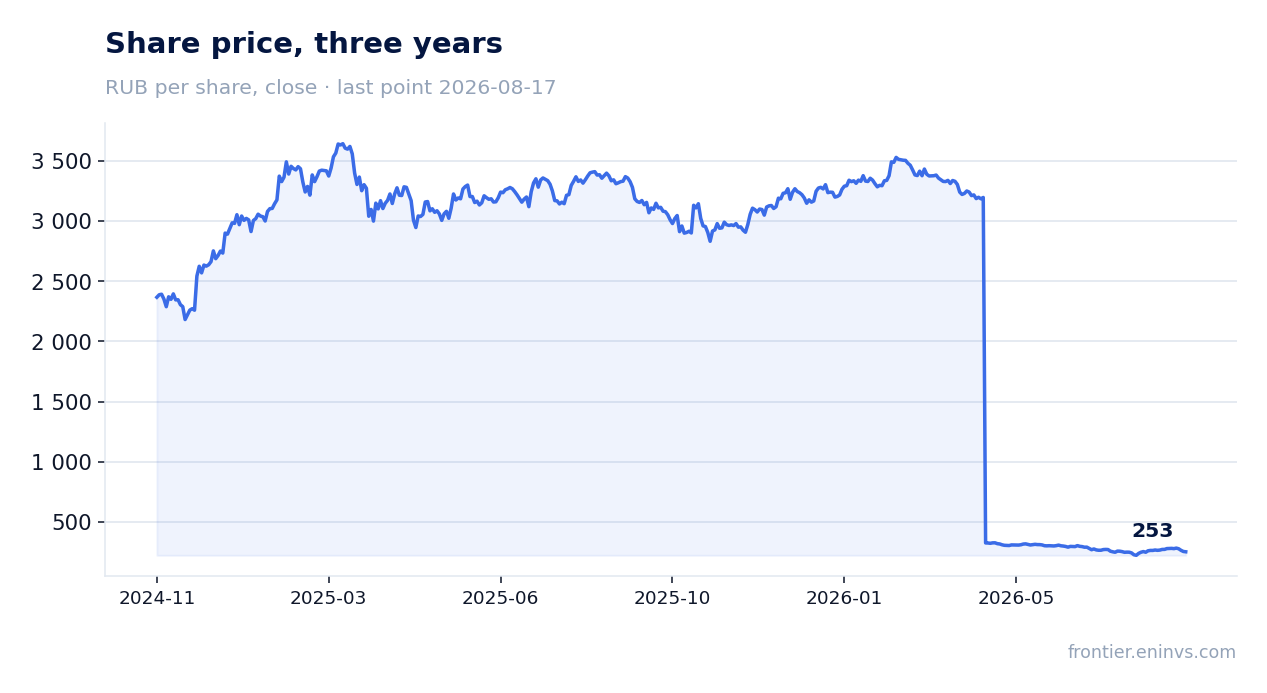
The historical yield at the 2025 ex-date was only 0.3% at a price of RUB 2979.2 per share. Since then the share price has fallen significantly, which has driven the yield up to the current 6.3%. However, even this higher yield remains below our fair estimate.
For a dividend investor, the key question is the bank's ability to sustain payouts. With a payout ratio of 0.74 and falling profit, room for manoeuvre is limited. If profit stabilises, a dividend of RUB 17.4 per share looks achievable, but this requires a slowdown in provision growth.
P/E LTM 3.75 and ROE 20.9% – valuation remains low
The share trades at a P/E LTM of 3.75 with a return on equity of 20.9%. This is a low multiple, reflecting high banking-sector risks and uncertainty over profit. For comparison, our model puts the upside to fair value at +33%.
Market capitalisation is RUB 699.7 bn. At the current price of RUB 278.88 per share (close before the release) and a dividend of RUB 17.4 per share, the forward yield of 6.7% looks modest against the key rate of 14.0%. However, if profit recovers, the multiple could remain low while the dividend grows.
The market reaction to the report was muted: the share added 1.6% on the release day but lost 10.6% from the release to 28 September. This suggests investors see significant downside risks to profit. A signal of stabilising provisions is needed to change sentiment.
Valuation on the latest reported figures
| Metric | Value |
|---|---|
| Market cap | 700 bn ₽ |
| P/E (LTM) | 3.7 |
| P/B | 1.02 |
| ROE | 20.9% |
| Dividend yield (12m) | 6.3% |
Dividend per share, ₽, and yield at the ex-date
| Year paid | Dividend | Yield |
|---|---|---|
| 2018 | 1.77 | — |
| 2020 | 4.18 | — |
| 2021 | 1.78 | — |
| 2024 | 9.25 | — |
| 2025 | 10.00 | 0.3% |
| 2026 | 17.40 | — |
Bottom line
The strong point of the report is the 31.2% year-on-year growth in net interest income to RUB 162.2 bn and a high EBITDA margin of 45.3%. The weak point is the 15.4% fall in net profit due to provisions eating the operating leverage. The dividend story remains attractive: we estimate RUB 17.4 per share, a 6.7% forward yield, but that is below the 10.5% we consider fair. Valuation at P/E LTM 3.75 and ROE 20.9% looks low, and the portal model points to +33% upside. For a dividend holder the share looks rather attractive, but the key question is the bank's ability to sustain profit and payouts amid rising provisions.
Open the company's financial profile T →
See also: market overview · valuation map · stock screeners