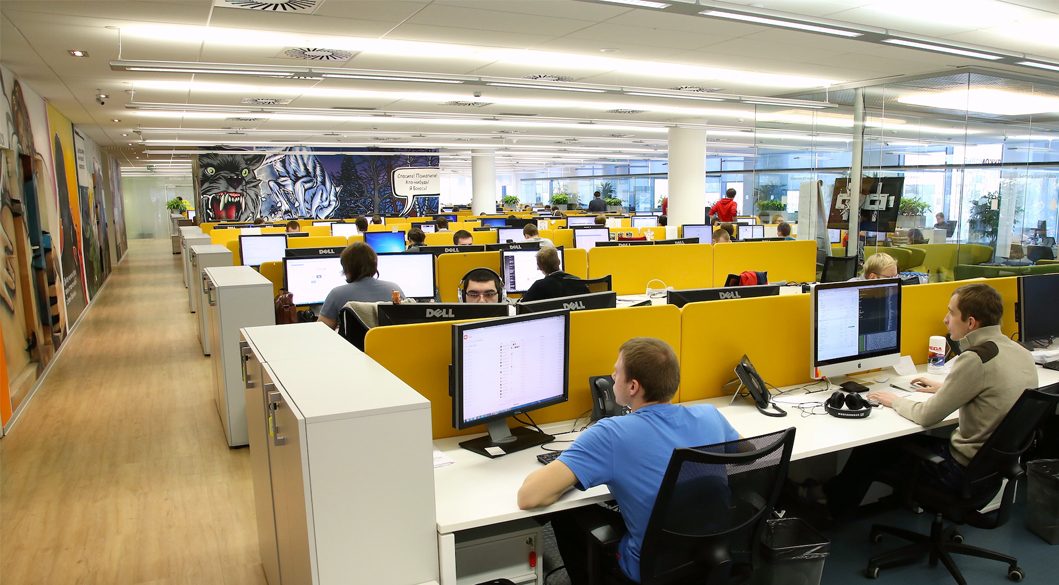
T-Technologies (T-Bank, formerly Tinkoff) is a Russian branchless digital bank and fintech ecosystem serving retail and small-business customers with cards, lending, brokerage, insurance and lifestyle services.
Sector: Financial Services
RU_T
Shares: connector/market_inputs
Monetary columns are in B RUB, one decimal; scale (K/M/B/T) keeps values readable. For the period (default) shows P&L and cash flow for that row’s reporting window: quarterly amounts when the feed uses quarter-duration facts (typical US 10-Q revenue and income), quarterly cash flows after stripping YTD where only cumulative tags exist, and an implied Q4 on 31 Dec FY rows (P&L: FY minus Q1–Q3; operating / investing cash flow: FY 12m minus 9M YTD to 30 Sep when sourced from SEC builder evidence) so they match 10-Q scale. Some issuers still use cumulative YTD minus the prior row in the same calendar year. As reported shows values stored on each row (e.g. full-year on FY). Balance sheet is always as reported. Source JSON may use millions etc.; conversion uses amounts_unit per row.
| Date | Period | Status | Net interest incomeB RUB | Net profitB RUB | AssetsB RUB | EquityB RUB | ROE (annualized) | Source |
|---|---|---|---|---|---|---|---|---|
| 2026-06-30 | Q2 2026 (3M) | OK | 162.2 y/y 31.2% | 39.5 y/y -15.4% | 6272.1 y/y 17.8% | 756.8 y/y 23.5% | 21.4% | Report (PDF) |
| 2026-03-31 | Q1 2026 (3M) | OK | 149.1 y/y 29.2% | 35.0 y/y 4.5% | 5933.2 y/y 25.4% | 719.7 y/y 27.2% | 20.0% | Report (PDF) |
| 2025-12-31 | Q4 2025 (3M) | OK | 150.3 y/y 20.2% | 72.1 y/y 86.2% | 6083.9 y/y 18.9% | 683.6 y/y 31.5% | 29.2% | Report (PDF) |
| 2025-09-30 | Q3 2025 (3M) | OK | 130.7 y/y 26.1% | 40.1 y/y 6.2% | 5700.4 y/y 14.8% | 633.7 y/y 26.5% | 8.6% | Report (PDF) |
| 2025-06-30 | Q2 2025 (3M) | OK | 123.6 y/y 59.1% | 46.7 y/y 99.1% | 5326.5 y/y 84.7% | 612.6 y/y 107.2% | 31.7% | Report (PDF) |
| 2025-03-31 | Q1 2025 (3M) | OK | 115.4 y/y 57.6% | 33.5 y/y 50.3% | 4731.5 y/y 94.1% | 565.7 y/y 103.0% | 24.7% | Report (PDF) |
| 2024-12-31 | Q4 2024 (3M) | OK | 125.0 y/y 37.7% | 38.7 y/y 14.4% | 5118.0 y/y 125.5% | 519.9 y/y 83.3% | 24.0% | Report (PDF) |
| 2024-09-30 | Q3 2024 (3M) | OK | 103.7 y/y 67.7% | 37.8 y/y 59.9% | 4967.5 y/y — | 500.9 y/y — | 12.7% | Report (PDF) |
| 2024-06-30 | Q2 2024 (3M) | OK | 77.7 y/y 152.2% | 23.4 y/y 224.9% | 2883.5 y/y — | 295.6 y/y — | 32.7% | Report (PDF) |
| 2024-03-31 | Q1 2024 (3M) | OK | 73.2 y/y 56.1% | 22.3 y/y 37.3% | 2437.9 y/y — | 278.7 y/y — | 31.7% | Report (PDF) |
| 2023-12-31 | Q4 2023 (3M) | OK | 90.8 y/y — | 33.8 y/y — | 2269.8 y/y — | 283.6 y/y — | — | Report (PDF) |
| 2023-09-30 | Q3 2023 (3M) | OK | 61.8 y/y — | 23.6 y/y — | — y/y — | — y/y — | — | Report (PDF) |
| 2023-06-30 | Q2 2023 (3M) | OK | 30.8 y/y — | 7.2 y/y — | — y/y — | — y/y — | — | Evidence |
| 2023-03-31 | Q1 2023 (3M) | OK | 46.9 y/y — | 16.2 y/y — | — y/y — | — y/y — | — | Evidence |
IFRS decomposition: interest, fee and trading result with provisions, costs and the recurring/non-recurring profit split (bn RUB). Source: eninvs.com.
| Item, bn RUB | 2023 | 2024 | 2025 | YoY |
|---|---|---|---|---|
| Interest income | 300 | 693 | 1 088 | +57% |
| Interest expense | -69.9 | -314 | -568 | -81% |
| Net interest income | 230 | 380 | 520 | +37% |
| Credit-loss provisions | -100 | -259 | -330 | -28% |
| NII after provisions | 130 | 120 | 190 | +57% |
| Fee & commission income | 128 | 182 | 235 | +29% |
| Fee & commission expense | -55.0 | -76.8 | -88.5 | -15% |
| Net fee & commission income | 73.1 | 106 | 146 | +38% |
| Financial instruments & investment result | 9.7 | 20.1 | 33.9 | +68% |
| Other operating income, net | -67.7 | -23.0 | -18.9 | +18% |
| Operating income | 358 | 562 | 755 | +34% |
| Administrative & other expenses (SG&A) | -123 | -198 | -276 | -39% |
| Profit before tax | 103 | 152 | 253 | +66% |
| Income tax | -22.4 | -30.1 | -61.0 | -103% |
| Net profit | 80.9 | 122 | 192 | +57% |
| of which recurring | 73.3 | 106 | 167 | +57% |
| of which non-recurring | 7.6 | 16.2 | 25.8 | +59% |
| Key ratios (annual) | ||||
| ROE | 37.8% | 30.4% | 32.0% | +1.6 pp |
| Cost of risk (CoR) | 12.77% | 14.77% | 11.58% | -3.2 pp |
| Cost-to-income (CIR) | 34.3% | 35.3% | 36.6% | +1.3 pp |
| Net interest margin (NIM) | 12.97% | 10.28% | 9.28% | -1.0 pp |
ROE = (net profit − perpetual bond coupons) ×4 / avg equity excl. perpetuals; CoR = provisions ×4 / avg credit portfolio; CIR = admin expense / operating income; NIM = NII ×4 / avg assets.
| Quarter | 24/09 Q3 | 24/12 Q4 | 25/03 Q1 | 25/06 Q2 | 25/09 Q3 | 25/12 Q4 | 26/03 Q1 | 26/06 Q2 |
|---|---|---|---|---|---|---|---|---|
| P&L, bn RUB | ||||||||
| Net interest income | 104 | 125 | 115 | 124 | 131 | 151 | 149 | 162 |
| Provisions | -83.9 | -87.0 | -67.4 | -92.1 | -92.1 | -78.9 | — | — |
| Net fee income | 29.5 | 33.7 | 30.0 | 34.0 | 38.5 | 43.6 | — | — |
| Financial instruments & investment | 16.0 | 4.2 | 43.4 | 36.1 | -1.1 | 23.0 | 41.0 | 66.1 |
| Operating income | 153 | 182 | 115 | 124 | 191 | 218 | 149 | 162 |
| Admin (SG&A) | -55.2 | -67.1 | -15.4 | -15.3 | -69.3 | -74.4 | -19.8 | -22.2 |
| Net profit | 37.8 | 38.7 | 33.5 | 46.7 | 40.1 | 72.1 | 35.0 | 39.5 |
| Balance (period-end), bn RUB | ||||||||
| Credit portfolio | 2 597 | 2 537 | 2 533 | 2 774 | 2 938 | 3 169 | 3 241 | 3 460 |
| Securities portfolio (bonds) | 526 | 532 | 557 | 746 | 730 | 755 | 852 | 946 |
| Customer deposits | 3 905 | 4 010 | 3 711 | 4 000 | 4 244 | 4 412 | 4 176 | 4 369 |
| Other assets | 1 845 | 2 049 | 1 641 | 1 806 | 2 032 | 2 160 | 1 840 | 1 867 |
| Total assets | 4 967 | 5 118 | 4 731 | 5 326 | 5 700 | 6 084 | 5 933 | 6 272 |
| Equity | 501 | 520 | 566 | 613 | 634 | 684 | 720 | 757 |
| Key ratios (annualised) | ||||||||
| ROE (annualised) | 38.0% | 30.3% | 24.7% | 31.7% | 25.8% | 43.8% | 20.0% | 21.4% |
| Cost of risk (CoR) | 17.73% | 13.56% | 10.64% | 13.88% | 12.90% | 10.33% | — | — |
| Cost-to-income (CIR) | 36.0% | 37.0% | 13.3% | 12.4% | 36.2% | 34.1% | 13.3% | 13.7% |
| Net interest margin (NIM) | 10.56% | 9.92% | 9.37% | 9.83% | 9.48% | 10.27% | 9.93% | 10.63% |
Our earnings breakdowns and investment notes on this issuer.
<div class='muted' style='font-size:.72rem;line-height:1.2'>13.8 bln mo</div> source: CBR
| Reported | Forecast | Monthly ×12 | |
|---|---|---|---|
| Reporting period | H1 2026 | ||
| RAS profit, quarter months | Jan 2026 19.4 bln Feb 2026 13.8 bln Mar 2026 17.3 bln Apr 2026 7.3 bln May 2026 15.9 bln Jun 2026 14.7 bln | Jan 2026 19.4 bln Feb 2026 13.8 bln Mar 2026 17.3 bln Apr 2026 7.3 bln May 2026 15.9 bln Jun 2026 14.7 bln | |
| RAS profit, following months | Jul 2026 19.1 bln Aug 2026 24.4 bln | ||
| Forecast profit change (×1.12) | +12% | ||
| Annualised profit, mln RUB | 149.0 bln | 166.6 bln | 293.0 bln |
| Book (equity) | 756.8 bln | 756.8 bln | 756.8 bln |
| ROE (annualised) | 20% | 22% | 39% |
| Price / Book | 0.96x | 0.96x | 0.96x |
| Potential [ROE / P/B] | +21% | +23% | +40% |
| Card headline: avg of Forecast & Monthly | +32% | ||
Potential = annualised net profit / market cap (= ROE / P/B). 'Reported' is the last IFRS quarter annualised; 'Forecast' adjusts it for seasonality from the latest monthly RAS data (multiplier X = profit of the most recent months / profit of the quarter's months); 'Monthly ×12' annualises the latest RAS month. RAS = parent bank charter, IFRS = group; the bases differ, so the forecast is a momentum indicator.
| Period | Net interest income (YTD) CBR Form 102 | Non-interest result (YTD) CBR Form 102 | Pre-tax profit (YTD) CBR Form 102 | Net profit (YTD) CBR Form 102 | Total comprehensive income CBR Form 102 |
|---|---|---|---|---|---|
| Aug 2026 | 241.3 bln +109.8% y/y · 34.4 bln mo +114.6% | -72.8 bln +4.6% y/y · -4.8 bln mo +21.7% | 168.5 bln +334.9% y/y · 29.6 bln mo +200.2% | 131.8 bln +296.1% y/y · 24.4 bln mo +216.2% | 127.8 bln +202.8% y/y · 23.1 bln mo +212.0% |
| Jul 2026 | 206.9 bln +109.0% y/y · 39.9 bln mo +107.8% | -67.9 bln +3.1% y/y · -16.1 bln mo -58.6% | 138.9 bln +380.8% y/y · 23.8 bln mo +163.3% | 107.3 bln +320.2% y/y · 19.1 bln mo +49.5% | 104.7 bln +200.8% y/y · 17.0 bln mo +33.2% |
| Jun 2026 | 166.9 bln +109.3% y/y · 28.4 bln mo +84.4% | -51.8 bln +13.6% y/y · -9.3 bln mo +12.8% | 115.2 bln +479.7% y/y · 19.1 bln mo +305.0% | 88.2 bln +591.1% y/y · 14.7 bln mo +280.7% | 87.7 bln +298.2% y/y · 12.9 bln mo +83.5% |
| May 2026 | 138.5 bln +115.2% y/y · 24.7 bln mo +84.2% | -42.5 bln +13.7% y/y · -4.5 bln mo +57.8% | 96.1 bln +534.0% y/y · 20.2 bln mo +624.7% | 73.6 bln +725.4% y/y · 15.9 bln mo ×93 | 74.8 bln +398.8% y/y · 16.2 bln mo ×15 |
| Apr 2026 | 113.8 bln +123.4% y/y · 36.0 bln mo +171.7% | -38.0 bln +1.6% y/y · -21.4 bln mo -149.2% | 75.9 bln +513.5% y/y · 14.6 bln mo +213.2% | 57.7 bln +560.1% y/y · 7.3 bln mo +215.7% | 58.6 bln +321.6% y/y · 9.1 bln mo turned + |
| Mar 2026 | 77.9 bln +106.5% y/y · 25.6 bln mo +70.2% | -16.6 bln +44.7% y/y · -4.5 bln mo +57.0% | 61.3 bln +694.5% y/y · 21.1 bln mo +360.7% | 50.4 bln +684.1% y/y · 17.3 bln mo +340.3% | 49.6 bln +232.7% y/y · 17.5 bln mo +493.4% |
| Feb 2026 | 52.3 bln +130.6% y/y · 25.9 bln mo +130.8% | -12.1 bln +38.2% y/y · -8.3 bln mo +7.7% | 40.2 bln ×13 y/y · 17.7 bln mo +677.5% | 33.1 bln ×13 y/y · 13.8 bln mo +737.8% | 32.1 bln +168.6% y/y · 13.1 bln mo +36.1% |
| Jan 2026 | 26.3 bln +130.4% y/y · 26.3 bln mo +130.4% | -3.8 bln +64.0% y/y · -3.8 bln mo +64.0% | 22.5 bln ×26 y/y · 22.5 bln mo ×26 | 19.4 bln ×22 y/y · 19.4 bln mo ×22 | 19.0 bln +724.2% y/y · 19.0 bln mo +724.2% |
| Dec 2025 | 221.1 bln +25.6% y/y · 28.8 bln mo | -87.1 bln +15.2% y/y · -639 mln mo | 134.0 bln +82.8% y/y · 28.1 bln mo | 112.1 bln +84.7% y/y · 24.2 bln mo | 121.7 bln +129.3% y/y · 26.8 bln mo |
| Nov 2025 | 192.3 bln 26.7 bln mo | -86.5 bln -2.5 bln mo | 105.9 bln 24.2 bln mo | 87.9 bln 20.3 bln mo | 94.9 bln 19.4 bln mo |
| Oct 2025 | 165.6 bln 29.1 bln mo | -83.9 bln -3.1 bln mo | 81.7 bln 26.0 bln mo | 67.6 bln 19.5 bln mo | 75.6 bln 19.6 bln mo |
| Sep 2025 | 136.5 bln 21.5 bln mo | -80.8 bln -4.6 bln mo | 55.6 bln 16.9 bln mo | 48.1 bln 14.9 bln mo | 56.0 bln 13.8 bln mo |
Bank of Russia form 0409135 · latest reporting date 01.09.2026 (August 2026) · systemically important
| Date | Н1.0, % (headroom) | Н1.2, % (headroom) | Н1.1, % (headroom) | Н20.0, % (headroom) | Н20.2, % (headroom) | Н20.1, % (headroom) | Н2, % | Н3, % | Н4, % | Status |
|---|---|---|---|---|---|---|---|---|---|---|
| 01.09.2026 | 12.97 (+2.97) | 11.07 (+3.07) | 8.82 (+2.32) | — | — | — | 98.89 | 153.82 | 35.82 | ok |
| 01.08.2026 | 12.55 (+2.55) | 11.00 (+3.00) | 8.82 (+2.32) | — | — | — | 107.38 | 176.65 | 35.82 | ok |
| 01.07.2026 | 12.55 (+2.55) | 11.30 (+3.30) | 9.09 (+2.59) | 12.93 (+2.93) | 11.62 (+3.62) | 9.40 (+2.90) | 103.00 | 230.56 | 36.38 | ok |
| 01.06.2026 | 12.47 (+2.47) | 11.44 (+3.44) | 9.28 (+2.78) | — | — | — | 146.52 | 205.30 | 36.29 | ok |
| 01.05.2026 | 12.36 (+2.36) | 11.58 (+3.58) | 9.35 (+2.85) | — | — | — | 150.38 | 217.18 | 35.68 | ok |
| 01.04.2026 | 12.67 (+2.67) | 11.83 (+3.83) | 9.49 (+2.99) | 12.99 (+2.99) | 12.05 (+4.05) | 9.70 (+3.20) | 110.11 | 177.46 | 35.57 | ok |
| 01.03.2026 | 12.48 (+2.48) | 11.32 (+3.32) | 9.00 (+2.50) | — | — | — | 137.58 | 124.82 | 35.00 | ok |
| 01.02.2026 | 12.45 (+2.45) | 11.43 (+3.43) | 9.10 (+2.60) | — | — | — | 144.51 | 130.81 | 34.88 | ok |
| 01.01.2026 | 12.41 (+2.41) | 11.45 (+3.45) | 9.08 (+2.58) | 12.46 (+2.46) | 11.78 (+3.78) | 9.40 (+2.90) | 118.52 | 151.62 | 34.65 | ok |
| 01.12.2025 | 11.88 (+2.63) | 11.37 (+4.12) | 9.39 (+3.64) | — | — | — | 148.43 | 134.70 | 34.64 | ok |
| 01.11.2025 | 11.55 (+2.30) | 10.21 (+2.96) | 8.19 (+2.44) | — | — | — | 186.94 | 109.48 | 33.94 | ok |
| 01.10.2025 | 11.44 (+2.19) | 10.25 (+3.00) | 8.20 (+2.45) | 11.81 (+2.56) | 10.50 (+3.25) | 8.45 (+2.70) | 169.23 | 116.74 | 33.08 | ok |
CBR reporting dates are the 1st of the month, i.e. the previous month's close. Figures in brackets are headroom over the minimum incl. buffers; «r» marks a value taken from the bank's own release (clickable). N20.x are banking-group ratios, N2/N3/N4 are liquidity ratios, N27 is the NSTLR.
Current 0.96x · 3-year median 1.44x
Current 3.9x · 3-year median 5.9x
P/B is market cap ÷ equity of the latest reported quarter, P/E is ÷ profit of the last four quarters. EV/EBITDA is not computed for financials: EBITDA is not a meaningful line for them and their net debt is operating liquidity, not leverage.
Group: Financial Services. Every peer trades on the same market, so no adjustment is needed.
| Company | Market | Cap, $bn | P/E |
|---|---|---|---|
| MTS Bank | Russia | 0.4 | 1.9x |
| Mosgorlombard | Russia | 0.0 | 2.2x |
| Bank VTB | Russia | 15.3 | 2.8x |
| Sovcombank | Russia | 2.8 | 2.8x |
| Sberbank | Russia | 80.3 | 3.5x |
| DOM.RF | Russia | 4.6 | 3.5x |
| Zaymer | Russia | 0.2 | 3.7x |
| Bank Sankt-Peterburg | Russia | 1.4 | 3.8x |
| CarMoney | Russia | 0.0 | 4.6x |
| Europlan | Russia | 1.0 | 10.6x |
| Credit Bank of Moscow | Russia | 4.1 | 14.9x |
| Group median | 3.5x | ||
| Group average | 4.9x | ||
| This company | Russia | 8.8 | 3.9x |
Group median 3.5x; this company 3.9x — a 9% premium.
Group average 4.9x; against the average this company is at a 22% discount. The average sits 40% above the median: Credit Bank of Moscow (14.9x) skews the group.
At the adjusted group median the market cap would be -9% versus today.
The gap and the implied upside are measured against the median: one richly priced peer moves an average, not a median. The market adjustment uses our coverage medians (US 28.3x, Russia 5.9x, South Africa 11.1x, Kazakhstan 9.2x, India 27.4x, Indonesia 7.3x); it is about where a name is listed, not what it does. Peer multiples come from the nightly rebuild of 2026-10-22; the company's own is live.
Dividend-model upside: -37%
The payout is forecast from smoothed profit × payout ratio, capped by free cash flow (developers exempt — escrow) and floored at the recent actual dividend (companies hold payouts while profitable). Fair yield = key rate + the historical yield-spread to the rate (so growers that historically traded below the rate score higher). Upside = fair price / current − 1.
| 1 · Forecast dividend (per policy) | |
| Smoothed net profit (median YTD-ann./LTM/FY) | 187 bn RUB |
| Payout ratio | 24% |
| Free cash flow (FY, OCF − capex) | -200 bn RUB |
| Recent actual dividend (3-yr median) | 17.40 ₽ |
| = Forecast dividend per share | 17.40 ₽ |
| 2 · Fair yield (spread to key rate) | |
| CBR key rate | 14.0% |
| Historical yield spread to rate (3-yr median) | -12.4 pp |
| = Fair dividend yield (bank floor ≈ rate−3.5) | 10.5% |
| 3 · Valuation → upside | |
| Current price | 270 ₽ |
| Forecast dividend yield | 6.4% |
| Fair price (dividend-based) | 170 ₽ |
Forecast, not investment advice. Earnings annualization and policy assumptions are estimates.
Expected IRR: +40% (bear +16% … bull +63%)
price in 3 years 638 ₽ (+136% к 270 ₽); dividends along the way 77.65 ₽ (+29% цены); base — LTM на 2026-06-30 (H1)
| Metric, RUB mln | LTM, actual 12m to 30.06.2026 | 2027 12m to 30.06 | 2028 12m to 30.06 | 2029 12m to 30.06 |
|---|---|---|---|---|
| Assets | 6.27 trn | 8.47 trn | 10.34 trn | 11.88 trn |
| Asset growth | — | +35% | +22% | +15% |
| Return on assets | 2.98% | 2.89% | 2.85% | 2.85% |
| Opening equity | 756.8 bn | 756.8 bn | 943.4 bn | 1.17 trn |
| ROE | 23.7% | 32.3% | 31.3% | 29.0% |
| Net profit | 186.7 bn | 244.5 bn | 295.2 bn | 339.3 bn |
| Closing equity | — | 943.4 bn | 1.17 trn | 1.43 trn |
| Equity to assets | — | 11.1% | 11.3% | 12.0% |
| Dividend per share | 17.40 ₽ | 21.60 ₽ | 26.07 ₽ | 29.98 ₽ |
| Yield on current price | 6.4% | 8.0% | 9.7% | 11.1% |
| Revenue-growth source | weight | growth: yr 1 · 2 · 3 |
|---|---|---|
| Realised pace (acceleration/deceleration) LTM YoY +44%; acceleration +21.0pp; capped: no other source corroborates it LTM г/г по отчётности | 100% | +35% · +22% · +15% |
| Exit multiple | P/B 1.20x (0.96x…1.75x) |
| Partial re-rating: the mean of today's P/B 0.96 and the three-year median 1.44. For banks this base is measurably better — on our daily series (14 names, 5,163 observations) the median three-year error is 0.42 against 0.45 for today's multiple and 0.50 for the median alone, and the odds of ending above today's are 48%. Full re-rating to 1.75 is the bull case | |
| Key rate by year | 13.2% · 9.8% · 8.1% (averaged over the 12 months to each model year end, not over the calendar year) |
| Cost inflation | 6.2% · 5.6% · 5.3% |
| Dividend policy | 24% of net profit |
| Current CPI (actual) | 6.3%, на 2026-09-30 |
| Governance | no flags: the dividend has not faded against profit, payouts were not suspended, no audit qualification and no manual penalty — quality multiplier 1.00 |
| Line | model | analysts | gap |
|---|---|---|---|
| 2027 Консенсус, houses: 7.0 · blended from 50% 2026 + 50% 2027 | |||
| Net profit | 244.5 bn | 245.6 bn | 1.00x |
| 2028 Консенсус, houses: 4.0 · blended from 50% 2027 + 50% 2028 | |||
| Net profit | 295.2 bn | 300.8 bn | 0.98x |
The comparison runs on financial results, not target prices: a target depends on the multiple and horizon, while revenue and EBITDA forecasts compare directly.
| Historical forecast check | obs | median error | bias | ±20% |
|---|---|---|---|---|
| Net profit | 9 | 21% | 0.84x | 44% |
The model is anchored at each past reporting date with only the data available then, and its one-year-ahead forecast is compared with the actual. Rates and inflation are actuals, so this checks the operating forecast, not macro guessing.
Independent one-year estimates: eninvs Company_Forecast — 384 ₽; eninvs DividendPrediction — 77.50 ₽; Frontier див-модель — 170 ₽. Ours on the same horizon — 422 ₽
A forecast, not investment advice. Related-market prices are held at today's level, so the model answers what the business earns and is worth if markets stay here — it does not predict prices.
Paid, trailing 12-mo: 17.40 RUB/sh · 6.4%
| Pay year | Dividend /sh | |
|---|---|---|
| 2026 | 17.40 ₽ | |
| 2025 | 10.00 ₽ | |
| 2024 | 9.25 ₽ | |
| 2021 | 1.78 ₽ | |
| 2020 | 4.18 ₽ | |
| 2018 | 1.77 ₽ | |
| 2017 | 4.47 ₽ | |
| 2016 | 1.30 ₽ |
| Period | Last day to buy | /sh |
|---|---|---|
| 2026 q4 | 2026-10-09 | 4.70 ₽ |
| 2026 q3 | 2026-08-07 | 4.60 ₽ |
| 2026 q2 | 2026-05-22 | 4.50 ₽ |
| 2026 q1 | 2026-01-06 | 3.60 ₽ |
| 2025 q4 | 2025-10-03 | 3.50 ₽ |
| 2025 q3 | 2025-07-16 | 3.30 ₽ |
| 2025 q2 | 2025-05-15 | 3.20 ₽ |
| 2024 q4 | 2024-11-22 | 9.25 ₽ |
| 2021 q1 | 2021-03-24 | 1.78 ₽ |
| 2020 q4 | 2020-11-23 | 1.91 ₽ |
No dividend rows found for this issuer.
Share of volume initiated by buyers (crossing the spread):
1d: 49% buy — balanced5d: 51% buy — balanced20d: 51% buy — balanced
Iceberg levels last session: 2 bid / 1 ask; largest — bid 269.5 (filled ×3.6 of displayed, 36 refills).
Robot clips (recurring characteristic order size): 2 bid / 2 ask; largest — bid 321 lots ×278 appearances across 78 price levels. Ping probes (1-2 lots, typical iceberg hunting): ask ×358.
| Day | Buyer initiative | Icebergs bid/ask | Robots bid/ask | Trades |
|---|---|---|---|---|
| 22.10 | 49% | 2/1 | 2/2 | 24,667 |
| 21.10 | 48% | 0/0 | 2/4 | 34,026 |
| 20.10 | 48% | 3/0 | 3/2 | 36,268 |
| 19.10 | 53% | 0/0 | 4/6 | 57,045 |
| 16.10 | 52% | 1/0 | 3/2 | 27,554 |
Source: L2 order book + trade tape (TQBR main session, ~23 liquid names). Trade side = the aggressor crossing the spread. Iceberg = level filled a multiple of its displayed size with regular refills. Robot clip = a non-round order size recurring hundreds of times across dozens of price levels (an algo's fingerprint migrating with price); ping = 1-2 lot probe orders. Updated nightly.
Substantive mentions last 7 days: 1, last 30 days: 12 (5 positive, 1 negative) across tracked channels, broker research and shows. 25 passing mentions (digests, calendars) hidden.
Sources: Telegram channels (bloggers — blue chip, broker research — green), YouTube shows via transcripts (orange). Tone (▲/▼) is an automatic assessment in the stock's context. Quotes are fragmentary; authors' views are not our recommendations.
| 02.10.26 | Filing | ★ ▲ Дата определения (фиксации) лиц, имеющих право на осуществление прав по ценным бумагам эмитента Компания 'Т-Технологии' установила дату фиксации прав по акциям на 12 октября 2026 года, что позволит акционерам получить дивиденды за первое полугодие 2026 года. Протокол общего собрания акционеров был составлен 2 октября 2026 года. |
| 02.10.26 | AGM / Board | ★ ▲ Решения общих собраний участников (акционеров) На внеочередном собрании акционеров МКПАО «Т-Технологии» было решено выплатить дивиденды в размере 4,7 руб. на акцию по результатам полугодия 2026 года. Дивиденды будут выплачены до 26 октября 2026 года для номинальных держателей и до 17 ноября 2026 года для других акционеров. |
| 01.10.26 | AGM / Board | ★ Решения совета директоров (наблюдательного совета) Совет директоров МКПАО «Т-Технологии» утвердил денежную оценку имущества, которое будет использовано для размещения дополнительных акций, составившую 84,8 млрд. руб. Цена размещения дополнительных акций установлена на уровне 320 руб. за акцию. |
| 25.09.26 | Filing | ★ ▼ Проведение заседания совета директоров (наблюдательного совета) и его повестка дня 30 сентября 2026 года состоится заседание совета директоров МКПАО «Т-Технологии», на котором будет обсуждаться оценка имущества для размещения ценных бумаг, установление цены размещения дополнительных акций и утверждение условий размещения. Также будут затронуты вопросы, связанные с акциями, зарегистрированными под номером 1-01-16784-А. |
| 22.09.26 | Filing | ★ ▼ Принятие решения о размещении ценных бумаг Компания 'Т-Технологии' приняла решение о размещении 550 млн. дополнительных акций через закрытую подписку. Преимущественное право на приобретение акций будет предоставлено акционерам, и дата определения лиц с этим правом - 25.08.2026. |
| 11.09.26 | Filing | ★ ▲ Присвоение или изменение рейтинга эмитента рейтинговым агентством или иной организацией на основании договора 11 сентября 2026 года Международная компания публичное акционерное общество 'Т-Технологии' получила кредитный рейтинг А+(RU) от Аналитического Кредитного Рейтингового Агентства (АКРА). Рейтинг был присвоен на основе методологии для холдинговых компаний в России. |
| 21.05.26 | Filing | ★ ▲ Созыв общего собрания участников (акционеров) Внеочередное общее собрание акционеров МКПАО «Т-Технологии» состоится 30 июля 2026 года с заочным голосованием. В повестке дня - вопрос о выплате дивидендов за первый квартал 2026 года. Акционеры могут ознакомиться с материалами собрания с 7 по 30 июля 2026 года. |
Source: e-disclosure material filings over the last 180 days; ★ — flagged important by the classifier; summaries are automatic.
Disclosed in the top-10 of 11 of 17 funds, ≈3,8 млрд ₽ combined. Last month: added — 1, trimmed — 1, left top-10 — 1.
| Fund | Manager | Weight | ≈Position | Δ weight m/m | Disclosure |
|---|---|---|---|---|---|
| TITR Т-Капитал Акции роста | Т-Капитал | 9.10% | 28 млн ₽ | +0.62 pp | 31.08.2026 |
| AMRE АТОН – Российские акции + | Атон-менеджмент | 8.79% | 76 млн ₽ | -0.96 pp | 31.08.2026 |
| AKME Альфа-Капитал Управляемые акции | Альфа-Капитал | 8.63% | 1,2 млрд ₽ | — | 31.08.2026 |
| GROD ДОХОДЪ Индекс акций роста | ДОХОДЪ | 7.26% | 14 млн ₽ | — | 31.08.2026 |
| AKIE Альфа-Капитал Управляемые акции с выплатой дохода | Альфа-Капитал | 7.03% | 26 млн ₽ | — | 31.08.2026 |
| BCSR БКС Индекс Российского рынка | Брокеркредитсервис | 6.83% | 24 млн ₽ | — | 31.08.2026 |
| SBPS Первая – Фонд Моя цель 2035 | Первая | 5.96% | 8 млн ₽ | — | 31.08.2026 |
| EQMX ВИМ - Индекс МосБиржи | ВИМ Инвестиции | 4.99% | 664 млн ₽ | — | 31.08.2026 |
| AKUP Альфа-Капитал Умный портфель | Альфа-Капитал | 4.98% | 16 млн ₽ | — | 31.08.2026 |
| SBMX Первая - Фонд Топ Российских акций | Первая | 4.96% | 1,0 млрд ₽ | — | 31.08.2026 |
| TMOS Т-Капитал Индекс МосБиржи | Т-Капитал | 4.91% | 733 млн ₽ | — | 31.08.2026 |
| TRND Т-Капитал Трендовые акции | Т-Капитал | left top-10 (was 3.83%) | 31.08.2026 | ||
Source: monthly fund portfolio disclosures (investfunds); NAV is daily. Disclosures list each fund's top-10 only, so absence does not mean no position. Weight changes mix revaluation with trading. Fund flows and betas live in the fund monitor on the RU region page.
Reporting forms detected in loaded periods: ✓ ✓ ✓ (Balance sheet / Profit or loss (P&L) / Cash flows)
Financial results, valuation multiples (P/E, P/B), profitability and dividend yield of TBank — from primary filings.
| Issue | YTM | Coupon | Price, % | 1D | Volume today, ₽ | Avg vol. 20D, ₽ | Maturity |
|---|---|---|---|---|---|---|---|
| ТбанкБ12 | — | 13.5% | 105.00 | +0.00% | 2K | 2K | 12.2026 |
| ТбанкБ11 | — | 13.5% | 112.21 | +0.00% | 3K | 5K | 12.2026 |
| ТБанкИС1-8 | — | 0.01% | 4.00 | +0.00% | 40K | 15K | 07.2027 |
| ТБ-1ST2-01 | — | 18% | — | — | — | — | 09.2033 |
Price, YTM and turnover from MOEX; 1D is the current price vs the previous session close; floaters have no fixed YTM. Not investment advice.
See also: The Cheapest Bank Stocks in the World (2026): Where Global Banks Trade Below Book · The Cheapest Stocks in the World (2026): What Value Investing Says About Buying Cheap · global valuation map