ACUITY INC. (DE): profit jumped by half, but one-off items did almost all the work

On October 1, ACUITY INC. (DE) reported results for the fourth quarter of fiscal 2026 ended August 31. Revenue came in at $1,244.4 million (+2.9% year-on-year), net profit at $173.0 million (+51.8%), and EBITDA at $248.8 million (+9.6%). The profit jump looks strong but rests on $44.9 million of tariff refunds and the absence of last year's one-off charges; without them adjusted EBITDA grew only 3.4%. With an EV/EBITDA of 11.4 against its own three-year average of 12.0 and the portal model pointing to just +11% upside to fair value, the share looks neutral rather than attractive.
Key takeaways
— Revenue added 2.9% – slower than the prior quarter, but an acceleration from +1.6% in Q3
— The 51.8% profit jump was almost entirely driven by one-off items, not operating momentum
— EBITDA margin rose to 20.0% on tariff refunds and lower one-off charges
— Adjusted EBITDA grew only 3.4% – that is the real pace of operating growth
— Leverage at 0.68 EBITDA LTM is comfortable, but the direction of change is not disclosed
— Adjusted EPS rose 11.0% – notably more modest than the GAAP figure
— The portal model implies +11% upside to fair value with the multiple below its own three-year average
Attractiveness
Key figures, USD bn
| Metric | Q3 2025 | Q3 2026 | Change |
|---|---|---|---|
| Revenue | 1.21 | 1.24 | +2.9% |
| EBITDA | 0.23 | 0.25 | +9.6% |
| Operating profit | 0.18 | 0.23 | +25.7% |
| Net profit | 0.11 | 0.17 | +51.8% |
| Operating cash flow | 0.20 | — | — |
| Capex | 0.02 | — | — |
| EBITDA margin | 18.8% | 20.0% | +1.2 pp |
| Net margin | 9.4% | 13.9% | +4.5 pp |
Revenue added 2.9% – slower than the prior quarter, but an acceleration from +1.6% in Q3
Revenue for the fourth quarter of fiscal 2026 was $1,244.4 million, up 2.9% year-on-year. That is slower than the +4.9% in Q2 but faster than the +1.6% in Q3. Quarter-on-quarter, growth accelerated from 1.6% to 2.9%.
The core Acuity Brands Lighting segment contracted 0.4% to $958.7 million. Acuity Intelligent Spaces provided support: its revenue rose 16.6% to $297.6 million. Without this segment, total revenue would have been below last year's level.
Within ABL, the independent sales network added 3.8% to $729.2 million, while the direct sales channel fell 24.2% to $79.8 million. Retail and OEM also declined. AIS growth fully offset the weakness in the traditional business.
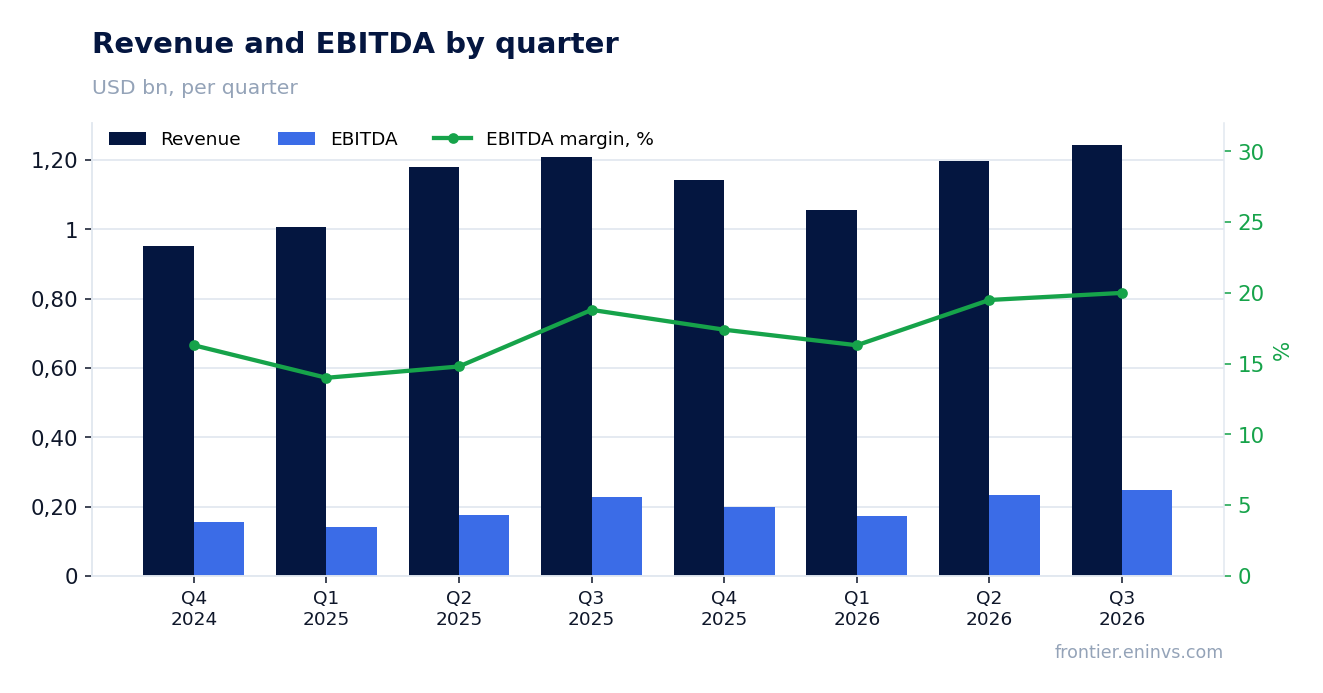
The 51.8% profit jump was almost entirely driven by one-off items, not operating momentum
Net profit for the reported quarter was $173.0 million versus $114.0 million a year earlier – a 51.8% increase. However, the company received $44.9 million in tariff refunds during the quarter, which were excluded from adjusted figures. In addition, last year's profit included one-off charges that are absent now.
Adjusted net income grew only 8.3% to $177.6 million. Adjusted EPS added 11.0% to $5.77. The gap between GAAP EPS ($5.63, +56.0%) and adjusted EPS ($5.77, +11.0%) shows how large the role of one-off factors is.
Operating profit rose 25.7% to $227.0 million, but here too a significant part of the gain is tied to tariff refunds and the absence of special charges. Without them, adjusted operating profit would have grown only 3.4%.
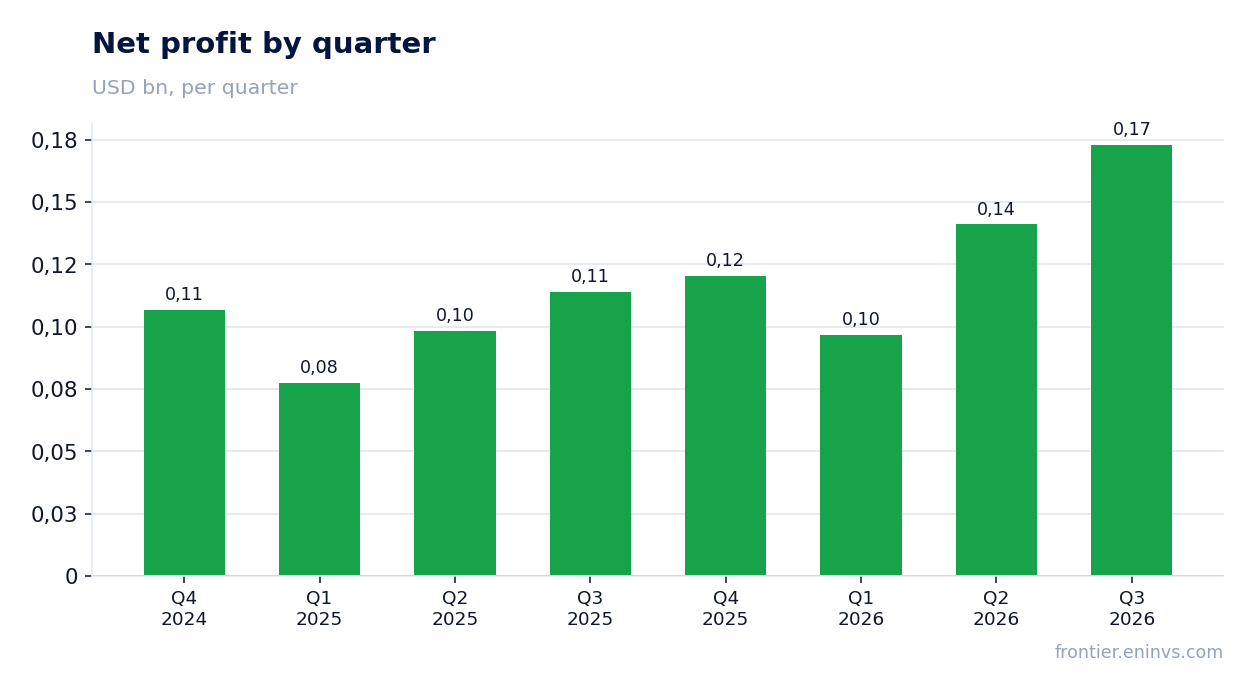
EBITDA margin rose to 20.0% on tariff refunds and lower one-off charges
EBITDA margin in the reported quarter was 20.0% versus 18.8% a year earlier. The 1.2 percentage point increase looks positive but is largely due to $44.9 million in tariff refunds that boosted EBITDA and the absence of last year's one-off charges.
Adjusted EBITDA margin was 20.0% versus 19.9% a year earlier – an increase of just 0.1 pp. This shows that without one-off items, profitability was virtually unchanged. Adjusted operating margin rose 0.1 pp to 18.7%.
In the ABL segment, adjusted operating margin fell 1.3 pp to 18.8% because tariff refunds were excluded from the calculation. In AIS, adjusted margin rose 3.5 pp to 24.9%, partially offsetting the pressure in the core segment.
Adjusted EBITDA grew only 3.4% – that is the real pace of operating growth
Adjusted EBITDA for the reported quarter was $248.8 million, up 3.4% year-on-year. That is significantly more modest than the 37.5% growth in GAAP EBITDA and reflects the exclusion of tariff refunds and one-off items.
Adjusted operating profit rose 3.4% to $232.9 million. Adjusted net income added 8.3% to $177.6 million. These rates are close to the 2.9% revenue growth, indicating stable but not accelerating operating momentum.
Growth in adjusted figures was held back by a decline in the ABL segment, where adjusted operating profit fell 7.1% to $179.8 million. The AIS segment showed 35.7% growth in adjusted operating profit to $74.1 million, but its scale is not yet sufficient to radically change the overall picture.
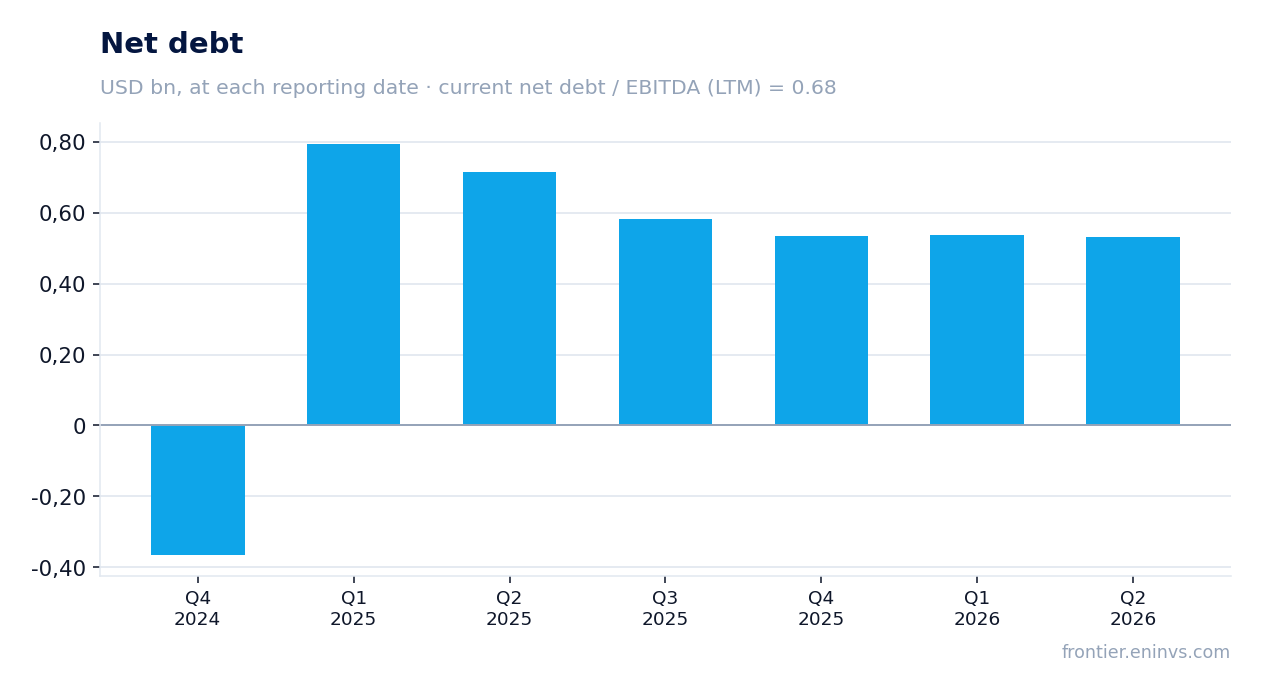
Leverage at 0.68 EBITDA LTM is comfortable, but the direction of change is not disclosed
Net debt at the latest balance sheet date was $581.9 million, corresponding to 0.68 EBITDA for the trailing twelve months. This is a low level for a company with a market capitalisation of $9.2 billion and stable operating cash flow.
Over the trailing twelve months, the company generated $825.6 million in operating cash flow and $747.9 million in free cash flow. This comfortably covers debt service and dividends. During the year, the company repaid $200 million on its term loan and repurchased $287.2 million of stock.
The direction of change in leverage is not disclosed in the provided data, so we refrain from assessing whether it rose or fell. The 0.68 EBITDA level remains comfortable and does not create risks to financial stability.
Adjusted EPS rose 11.0% – notably more modest than the GAAP figure
GAAP diluted EPS was $5.63, up 56.0% year-on-year. Adjusted EPS rose 11.0% to $5.77. The gap is explained by tariff refunds and the absence of last year's one-off charges.
The diluted share count fell from 31.533 million to 30.755 million, adding about 2.5% to EPS. The company repurchased over 940,000 shares for $287.2 million during the year, supporting the per-share metric.
Adjusted EPS of $5.77 is the level to focus on when assessing earnings sustainability. It is growing slower than revenue, reflecting margin pressure in the core segment.
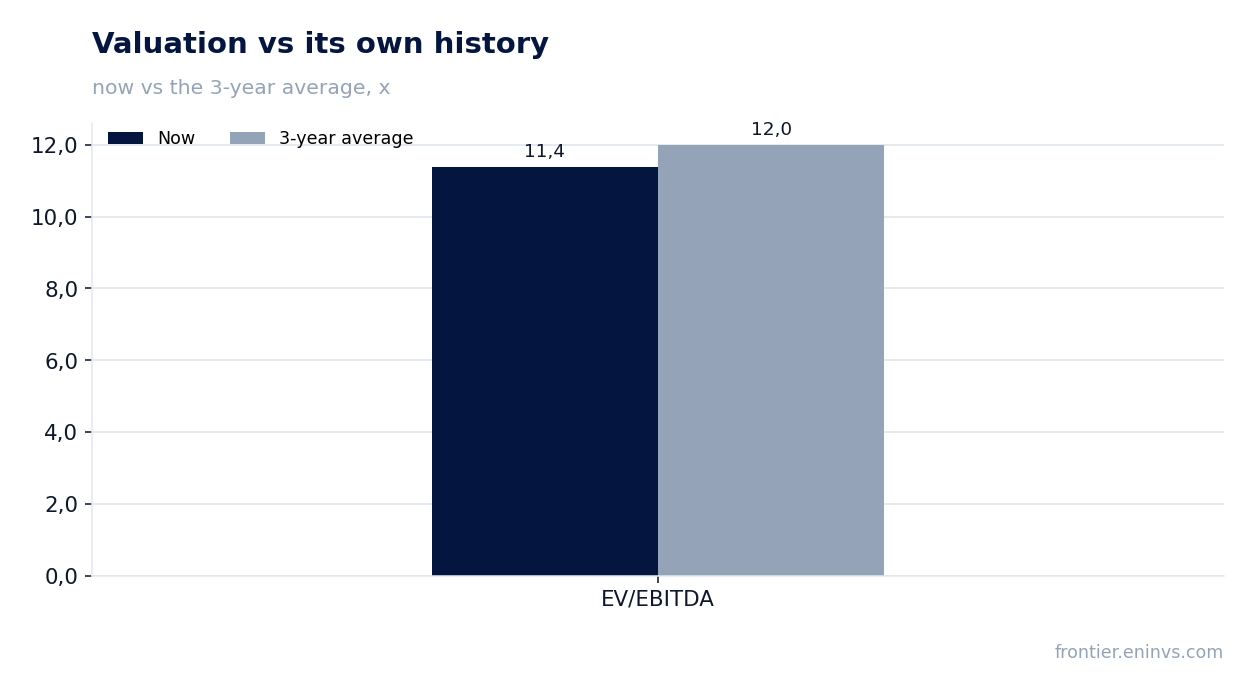
The portal model implies +11% upside to fair value with the multiple below its own three-year average
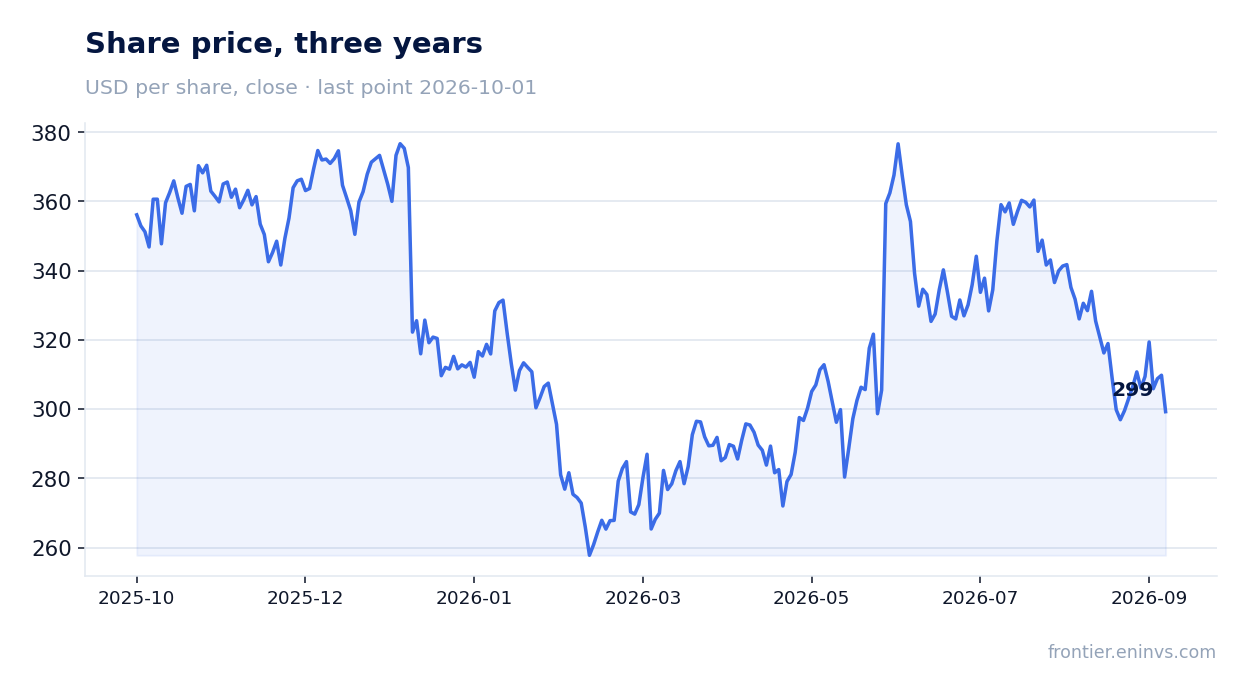
The trailing twelve-month EV/EBITDA multiple is 11.4 against its own three-year average of 12.0. The share trades below its historical valuation, partly compensating for modest operating growth. The price-to-earnings ratio is 17.3.
According to the portal model, which compares EBITDA growth with a target multiple and market capitalisation, the upside to fair value is estimated at +11%. This is moderate upside that does not imply a significant upward re-rating.
The trailing twelve-month dividend yield is only 0.26%, which is insignificant for an income-oriented investor. The company raised its dividend by 18% during the year, but the absolute payout remains small relative to the share price.
Valuation on the latest reported figures
| Metric | Value |
|---|---|
| Market cap | 9.19 bn USD |
| P/E (LTM) | 17.3 |
| EV/EBITDA (LTM) | 11.4 |
| P/B | 3.37 |
| Net debt / EBITDA (LTM) | 0.68 |
| ROE | 23.8% |
| Dividend yield (12m) | 0.3% |
| EV/EBITDA, 3-year average | 12.0 |
Bottom line
The report showed stable but unimpressive growth: revenue added 2.9%, while adjusted EBITDA grew only 3.4%. GAAP profit rose 51.8%, but that jump was driven by tariff refunds and the absence of last year's charges, not by operational improvement. Leverage is comfortable, free cash flow is strong, but the dividend yield is insignificant. The share trades below its three-year average EV/EBITDA, and the portal model implies +11% upside to fair value. At the current price, the stock looks neutral: upside is limited, and operating momentum does not justify an upward re-rating.
Open the company's financial profile AYI →
See also: market overview · valuation map · stock screeners