Datadog: revenue grows 35%, but interest income, not the business, lifted profit
On November 4, Datadog, Inc. reported results for the third quarter of 2026. Revenue reached $1,197.1 million, up 35.2% year over year, operating profit was $74.7 million, net income $118.3 million and operating cash flow $290.0 million. Growth was roughly the same pace as the 35.6% seen in the second quarter, yet the stock fell 14.5% on the release, and at 258.5 times trailing twelve-month earnings the share looks expensive against its own history – a neutral verdict.
Key takeaways
— Revenue rose 35.2% year over year, and the pace was roughly the same as the 35.6% a quarter earlier
— Net income grew 3.5 times, but $53.1 million of it came from interest income on cash, not from operations
— Operating margin rose to 6% from minus 1% a year earlier, helped by slow expense growth rather than cuts
— Free cash flow of $250.6 million was $39.3 million below operating cash flow because of capitalised development
— Net debt rose over the quarter from minus $3.7 billion to $0.4 billion, though it was lower a year earlier
— Customers with ARR of $100,000 or more reached about 4,860, up 20% from a year earlier
— At 258.5 times trailing twelve-month earnings, the valuation leaves no room for error at roughly 35% revenue growth
Attractiveness
Key figures, USD bn
| Metric | Q3 2025 | Q3 2026 | Change |
|---|---|---|---|
| Revenue | 0.89 | 1.20 | +35.2% |
| EBITDA | 0.01 | 0.09 | +1142.9% |
| Operating profit | -0.01 | 0.07 | to profit |
| Net profit | 0.03 | 0.12 | +249.2% |
| Operating cash flow | 0.25 | 0.29 | +15.3% |
| Capex | 0.02 | 0.01 | -35.2% |
| EBITDA margin | 0.8% | 7.8% | +7.0 pp |
| Net margin | 3.8% | 9.9% | +6.1 pp |
Revenue rose 35.2% year over year, and the pace was roughly the same as the 35.6% a quarter earlier
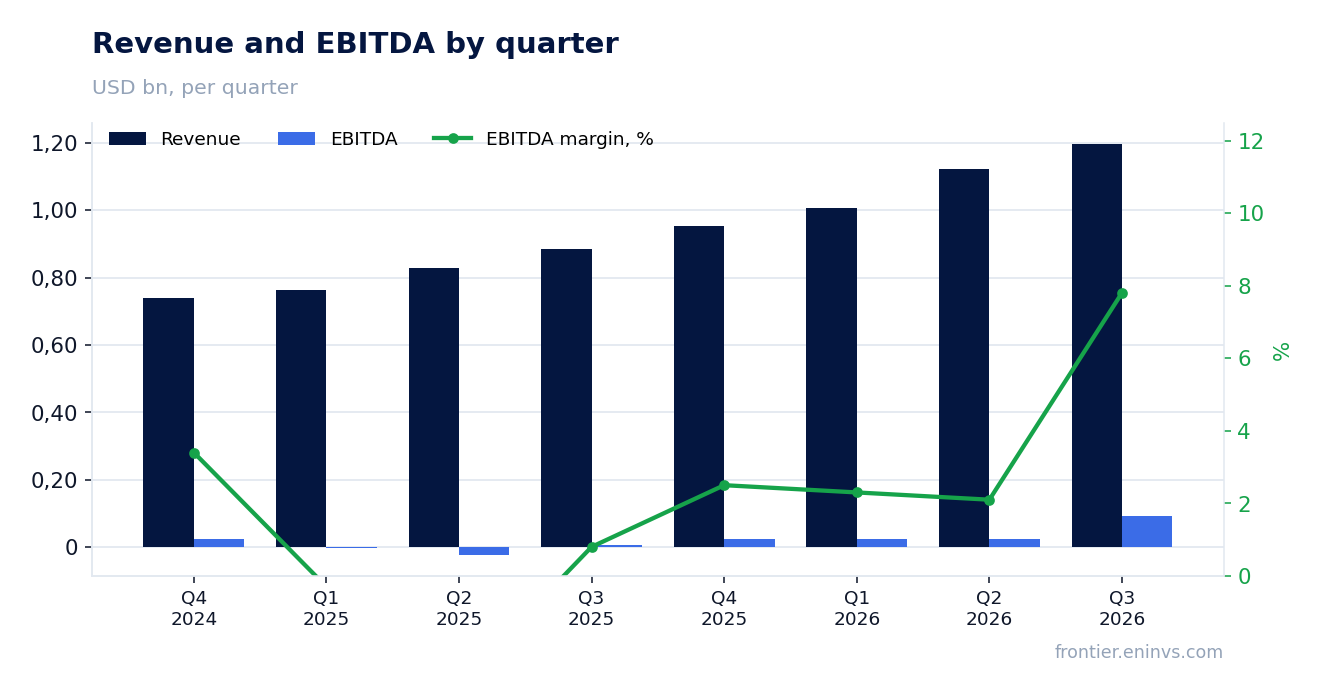
Third-quarter 2026 revenue was $1,197.1 million, up 35.2% from a year earlier. Growth was 35.6% in the second quarter, so the pace was roughly the same: the company has held above 35% for three quarters in a row after 32.2% in the first quarter and 29.2% in the fourth quarter of 2025.
The base of large customers provides support. The number of customers with annual revenue of $100,000 or more reached about 4,860, up 20% from about 4,060 a year earlier. Such customers generate the bulk of revenue, and their growth explains why the top line is not slowing despite the maturity of the observability market.
The company ties demand to scaling digital operations and the use of artificial intelligence. The release mentions the launch of the Scout 1.0 model for investigating production incidents, already powering Bits Investigation. That is more a confirmation of the product agenda than a source of quarterly revenue, but it shows where development spending goes.
Net income grew 3.5 times, but $53.1 million of it came from interest income on cash, not from operations
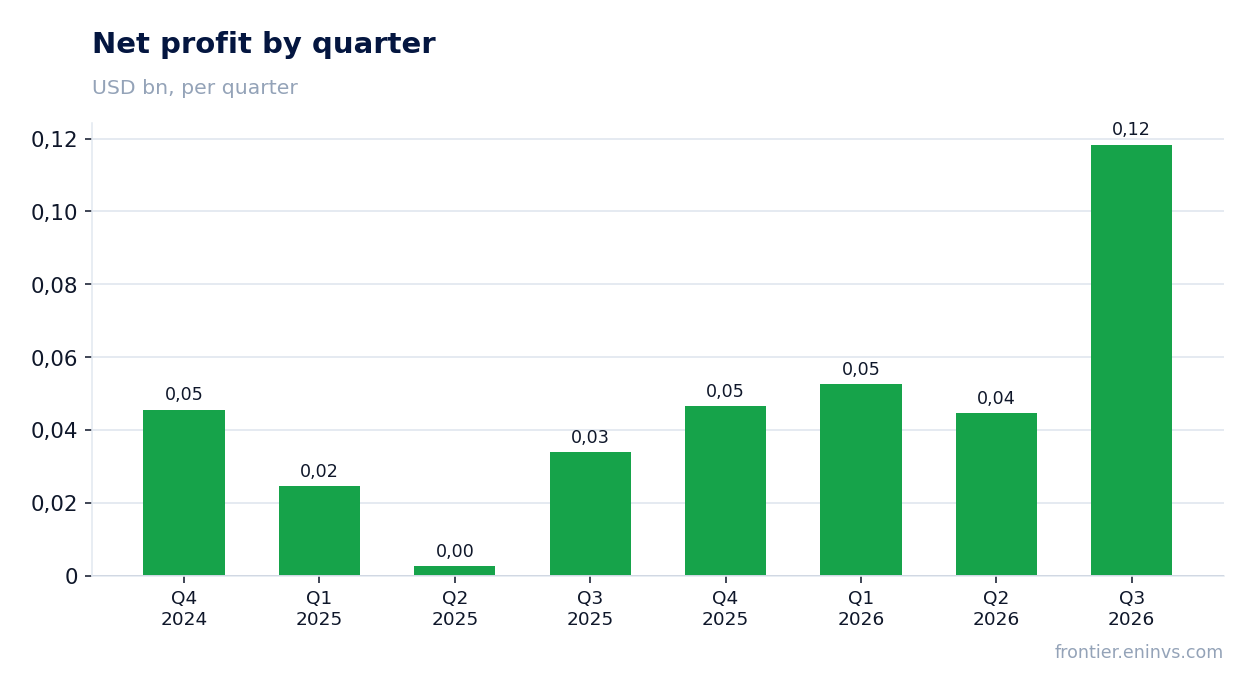
Third-quarter net income was $118.3 million against $33.9 million a year earlier, up 249.2%. Operating profit contributed only $74.7 million, while interest and other income added $53.1 million. In other words, almost half of net income came not from sales but from placing cash.
Cash and marketable securities at the end of September totalled $5.2 billion. With such a cushion, interest income is a stable line, but it does not grow with the business and does not characterise the quality of operations. Against trailing twelve-month net income of $262.0 million, this is a material adjustment.
Operating profit of $74.7 million against a loss of $5.8 million a year earlier is a genuine shift. It reflects both revenue growth and the fact that research and development, sales and administrative expenses grew slower than revenue. But the $43.6 million gap between operating and net income shows how important non-operating income is.
Operating margin rose to 6% from minus 1% a year earlier, helped by slow expense growth rather than cuts
GAAP operating margin was 6% against minus 1% a year earlier. Gross margin stayed at 80%, meaning cost of revenue grew in proportion to revenue. The entire shift came from operating expenses: on revenue of $1,197.1 million they were $885.2 million, against $715.0 million a year earlier on revenue of $885.7 million.
Within expenses, research and development grew fastest: $491.6 million against $402.0 million. Sales and marketing rose to $303.3 million from $238.7 million, and administrative costs to $90.3 million from $74.3 million. None of these lines was cut, but their combined growth lagged revenue growth, and that was enough to swing to profit.
Non-GAAP operating income, excluding stock-based compensation and one-off items, was $334.3 million at a 28% margin against 23% a year earlier. The $74.7 million gap to GAAP profit is almost entirely explained by $237.2 million of stock-based compensation. For an investor this means operating leverage exists, but a significant part of profit goes to equity compensation.
Free cash flow of $250.6 million was $39.3 million below operating cash flow because of capitalised development
Third-quarter operating cash flow was $290.0 million against $251.5 million a year earlier. The company calculates free cash flow as operating cash flow minus capital expenditure and capitalised development: it was $250.6 million. The $39.3 million difference is mainly $28.4 million of capitalised development and $10.9 million of equipment purchases.
The free cash flow margin fell to 21% from 24% a year earlier. The reason is not a drop in operating cash flow but the rise in capitalised development to $28.4 million from $20.7 million. The company is investing more in its own products, and that reduces the cash result at the same operating cash flow.
For the nine months, operating cash flow was $940.4 million and free cash flow $818.4 million. That is a solid base for funding development and possible acquisitions: $3.3 million went to business purchases in the third quarter and $115.6 million over nine months. Cash flow remains the main source of funds, since the company's debt is represented by convertible notes.
Net debt rose over the quarter from minus $3.7 billion to $0.4 billion, though it was lower a year earlier
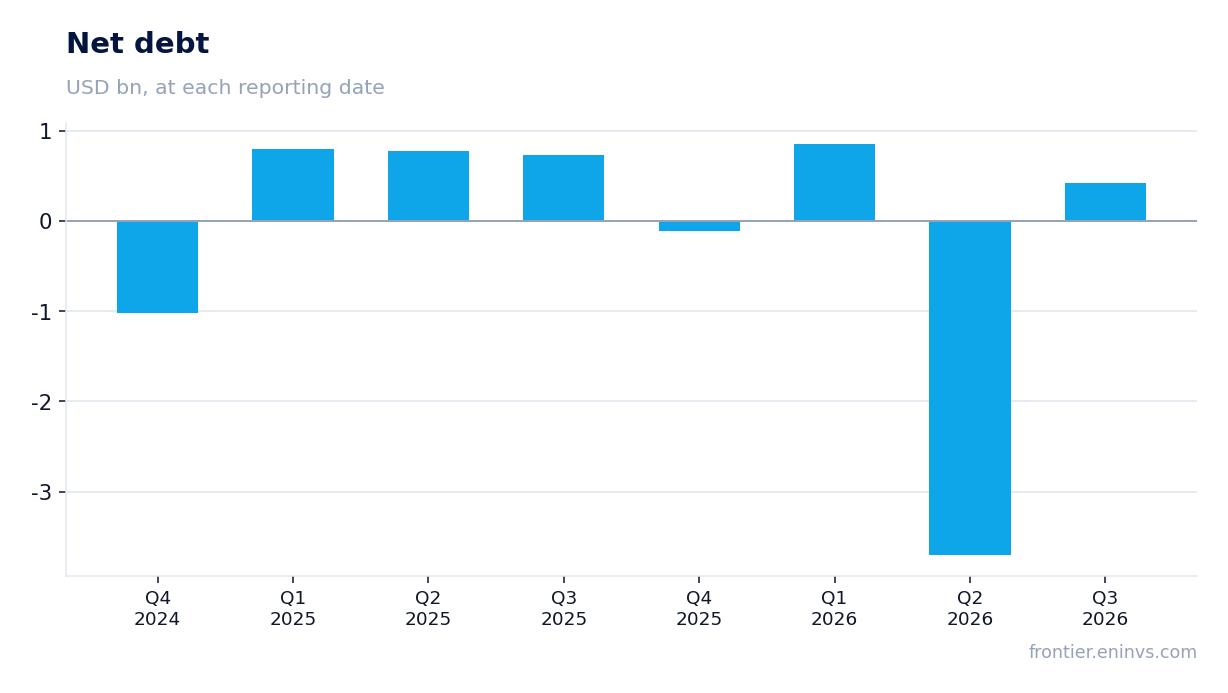
Net debt at September 30, 2026 was $0.4 billion. At June 30 it was minus $3.7 billion, so the change over the quarter was plus $4.1 billion. A year earlier, at September 30, 2025, net debt was $0.7 billion, and over 12 months it fell by $0.3 billion.
Such a jump over a quarter is explained by the balance-sheet structure: $5.2 billion of cash and marketable securities against $986.6 million of convertible notes. The company holds a lot of liquidity, and its revaluation or movement between lines strongly changes net debt. Interest expense is small at $3.2 million for the quarter, since the notes carry a zero coupon.
For assessing leverage, what matters more is that the debt is convertible paper due in 2029, and cash far exceeds it. Refinancing risk is low, and interest income of $53.1 million for the quarter exceeds interest expense. Net debt of $0.4 billion against trailing twelve-month revenue of $4.3 billion poses no threat to stability.
Customers with ARR of $100,000 or more reached about 4,860, up 20% from a year earlier
The number of customers with annual revenue of $100,000 or more rose to about 4,860 from about 4,060 a year earlier, or 20%. That is slower than total revenue growth of 35.2%, which means revenue is growing not only through new large customers but also through expanded consumption by existing ones.
The company also earned a Leader designation in the Forrester Wave for AIOps platforms for the second consecutive year and was named the "Company to Beat" in Gartner's AI Vendor Race report. These assessments do not affect revenue directly but support its positioning among large customers, on whom the base rests.
The company's fourth-quarter guidance is revenue of $1.19 billion to $1.20 billion, implying growth of about 25% over the fourth quarter of 2025 at $953.2 million. For the full year 2026 it expects revenue of $4.515 billion to $4.525 billion. That is a cautious marker: it allows for a slowdown in growth at year-end, and that is exactly what the next report should test.
At 258.5 times trailing twelve-month earnings, the valuation leaves no room for error at roughly 35% revenue growth
With a market capitalisation of $67.7 billion and trailing twelve-month net income of $262.0 million, the price-to-earnings ratio is 258.5. That is a very high level, and it rests on profit almost half of which in the third quarter came from interest income on cash rather than from operations.
Return on equity is 10.4%. At such a valuation the market is paying for future growth, not for current profit. The portal's model, which compares EBITDA growth with a target multiple, puts the upside of the share to fair value at just +4%. This is our own calculation, not a market consensus and not a target price.
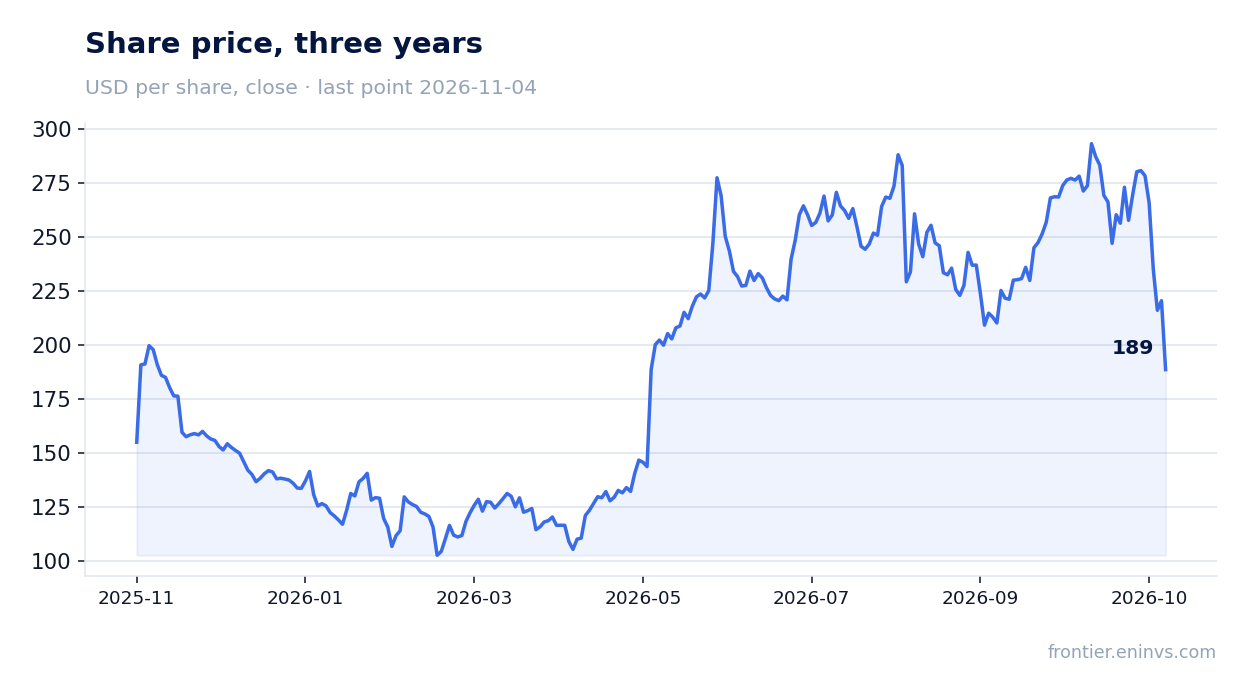
The stock closed at $220.52 before the release and lost 14.5% on the publication day, and by November 4 the decline since the release was the same 14.5%. The market reacted to cautious fourth-quarter guidance and to the fact that growth did not accelerate. At 258.5 times earnings, even a small slowdown in revenue growth can strongly change the valuation.
Valuation on the latest reported figures
| Metric | Value |
|---|---|
| Market cap | 67.7 bn USD |
| P/E (LTM) | 258.5 |
| P/B | 18.15 |
| Operating cash flow (LTM) | 1.27 bn |
| ROE | 10.4% |
Bottom line
What was genuinely strong was the core: revenue rose 35.2%, the pace was roughly unchanged, and operating margin swung to 6% from minus 1% a year earlier. But a significant part of net income of $118.3 million came from interest income on cash rather than from operations, and free cash flow of $250.6 million was below operating cash flow because of capitalised development. At 258.5 times trailing twelve-month earnings the valuation leaves no room for error, and the portal's model shows only +4% to fair value. The verdict is neutral: the business is growing fast, but the price already reflects that growth, and a better assessment needs either a higher growth rate or a materially lower multiple.
Open the company's financial profile DDOG →
See also: market overview · valuation map · stock screeners