EOG Resources: oil up a third, and the company earned more than the price implied
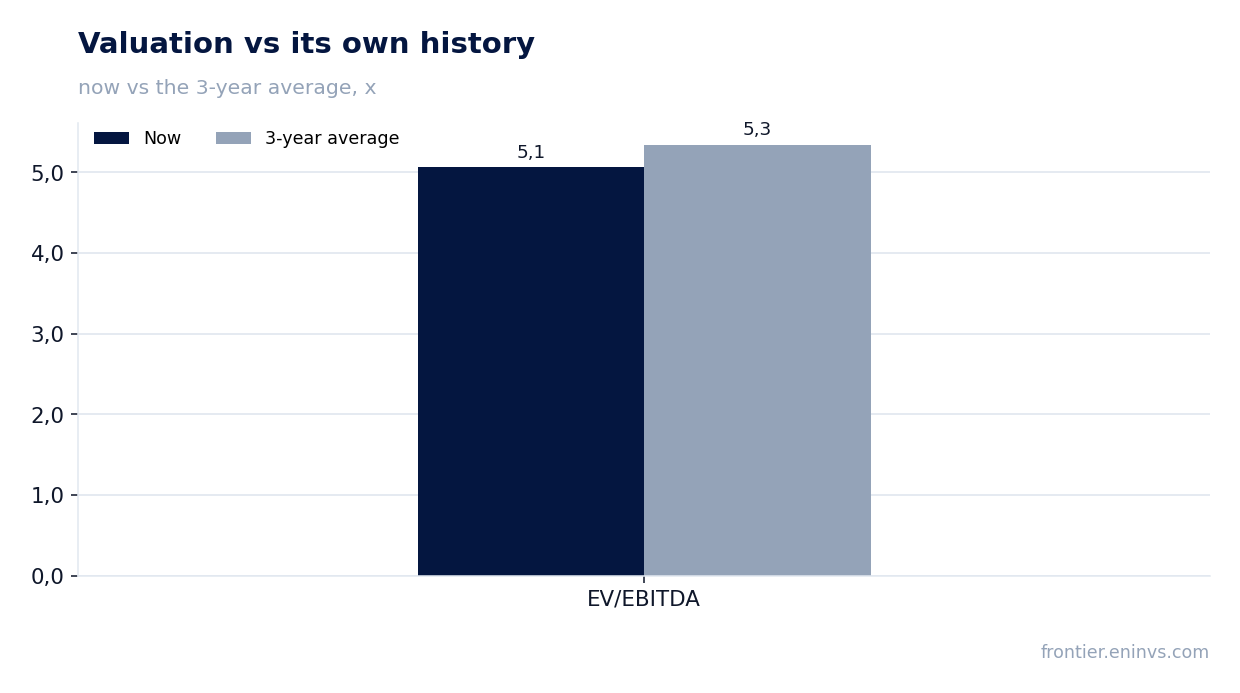
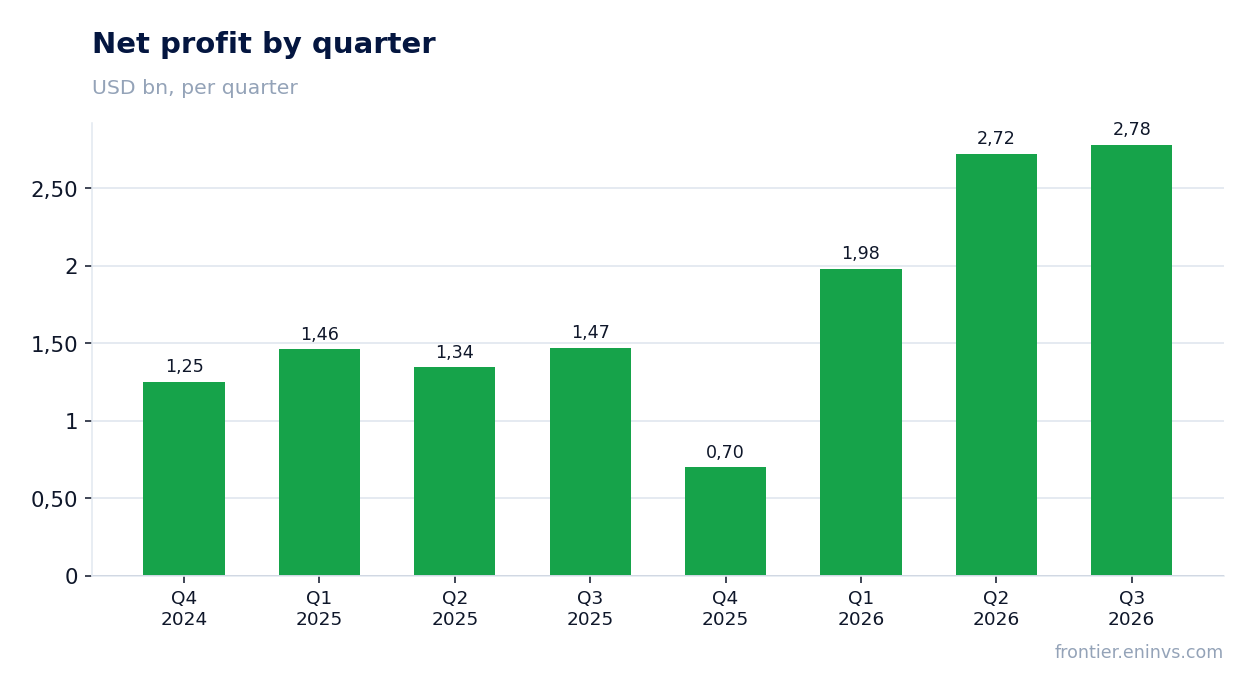
On 6 November EOG Resources, Inc. reported results for the third quarter of 2026. The average Brent price in the period was USD 91.3 versus USD 68 a year earlier, Henry Hub – USD 2.893 versus USD 3.083. Revenue reached USD 8,549m (+49.2% year on year), EBITDA – USD 4,878m (+68.8%), net profit – USD 2,781m (+89.1%). At the year-ago volumes and costs and moving only prices, our calculation gives revenue of USD 6,871.5m and EBITDA of USD 4,029.5m, so the company earned USD 848.5m more than the price backdrop implied. At an EV/EBITDA of 5.1 against its own three-year average of 5.3 and a dividend yield of 2.8%, the share looks rather attractive, although the portal's model at current prices puts fair value 31% below the market.
Key takeaways
— Brent rose 34.2% year on year while Henry Hub fell 6.2% – oil carried the top line
— The company earned USD 848.5m more than prices implied at year-ago volumes and costs
— Quarter on quarter revenue beat the price-implied level by 3.0% and EBITDA by 10.1%
— EBITDA margin rose to 57.1% from 50.4%, a consequence of price rather than cost cuts
— Net profit grew 89.1%, faster than EBITDA, as depreciation and interest lagged revenue
— Net debt fell from USD 4.6bn on 30 September 2025 to USD 2.5bn on 30 September 2026
— A 2.8% dividend yield at an EV/EBITDA of 5.1 against its own three-year average of 5.3 leaves room
Attractiveness
Key figures, USD bn
| Metric | Q3 2025 | Q3 2026 | Change |
|---|---|---|---|
| Revenue | 5.73 | 8.55 | +49.2% |
| EBITDA | 2.89 | 4.88 | +68.8% |
| Operating profit | 1.72 | 3.59 | +108.5% |
| Net profit | 1.47 | 2.78 | +89.1% |
| Operating cash flow | 3.11 | 3.81 | +22.6% |
| Capex | 1.66 | — | — |
| EBITDA margin | 50.4% | 57.1% | +6.7 pp |
| Net margin | 25.7% | 32.5% | +6.8 pp |
Brent rose 34.2% year on year while Henry Hub fell 6.2% – oil carried the top line
The average Brent price in the third quarter of 2026 was USD 91.3 versus USD 68 a year earlier, up 34.2%. US gas moved the other way: Henry Hub averaged USD 2.893 versus USD 3.083, down 6.2%. In the portal's model oil accounts for 62% of revenue and gas for 20%, so the oil leg set the tone of the report.
Quarter on quarter oil also fell, from USD 96.8 to USD 91.3, down 5.6%, and gas from USD 2.926 to USD 2.893, down 1.1%. Even so, quarterly revenue rose to USD 8,549m from USD 8,620m in the second quarter, a decline of only 0.8%. The downward price move did not reverse the annual growth.
Brent now stands at USD 99.1, 8.5% above the period average, and Henry Hub at USD 2.95, 2.0% above. For the next quarter that means a higher realised oil price if it holds.
Commodity prices: period average and now
| Benchmark | Year ago | Q3 2026 | YoY | Spot 2026-11-06 |
|---|---|---|---|---|
| Brent, USD | 68,0 | 91,3 | +34,2% | 99,1 |
| Henry Hub, USD | 3,08 | 2,89 | -6,2% | 2,95 |
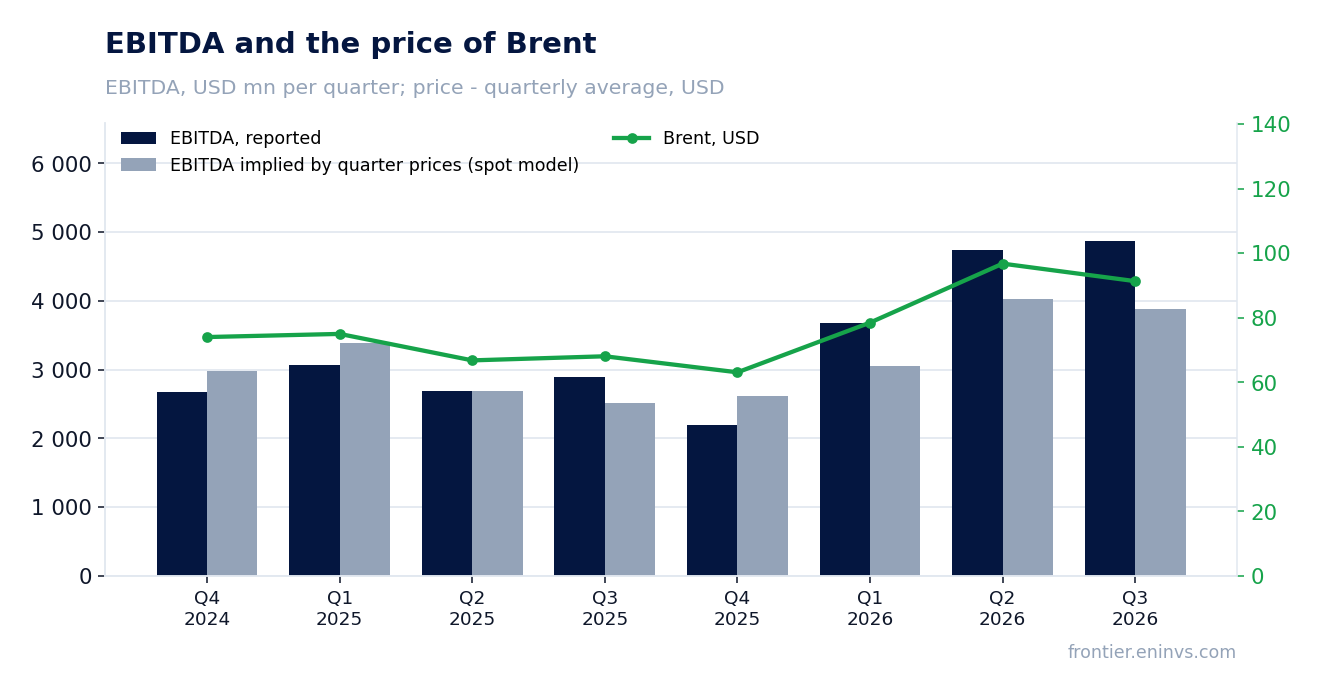
The company earned USD 848.5m more than prices implied at year-ago volumes and costs
At the volumes and costs of the third quarter of 2025 and moving only prices, our calculation gives revenue of USD 6,871.5m and EBITDA of USD 4,029.5m. The company actually reported USD 8,549m of revenue and USD 4,878m of EBITDA. The gap is USD 1,677.5m on revenue (+24.4%) and USD 848.5m on EBITDA (+21.1%).
The price effect in that calculation is USD 1,140.5m, or 19.9% of revenue. The rest came from volumes, realised price against the benchmark, unit costs and other items the facts do not break out. We do not attribute the gap to a cause the source does not give.
The portal's spot model, built from the average of the previous four quarters, expected EBITDA of USD 3,881.6m and revenue of USD 7,299.9m. The actual beat the model by 25.7% on EBITDA and 17.1% on revenue. In the four prior periods the deviation was +14.6%, -16.3%, +20.2% and +18.0%, so this is the largest overshoot of the five.
What the prices implied and what the company earned
| Base (Q3 2025) | Implied at period prices | Reported | Reported vs implied | |
|---|---|---|---|---|
| Revenue, USD mn | 5 731 | 6 872 | 8 549 | +24,4% |
| EBITDA, USD mn | 2 889 | 4 030 | 4 878 | +21,1% |
| EBITDA, portal spot model, USD mn | — | 3 882 | 4 878 | +25,7% |
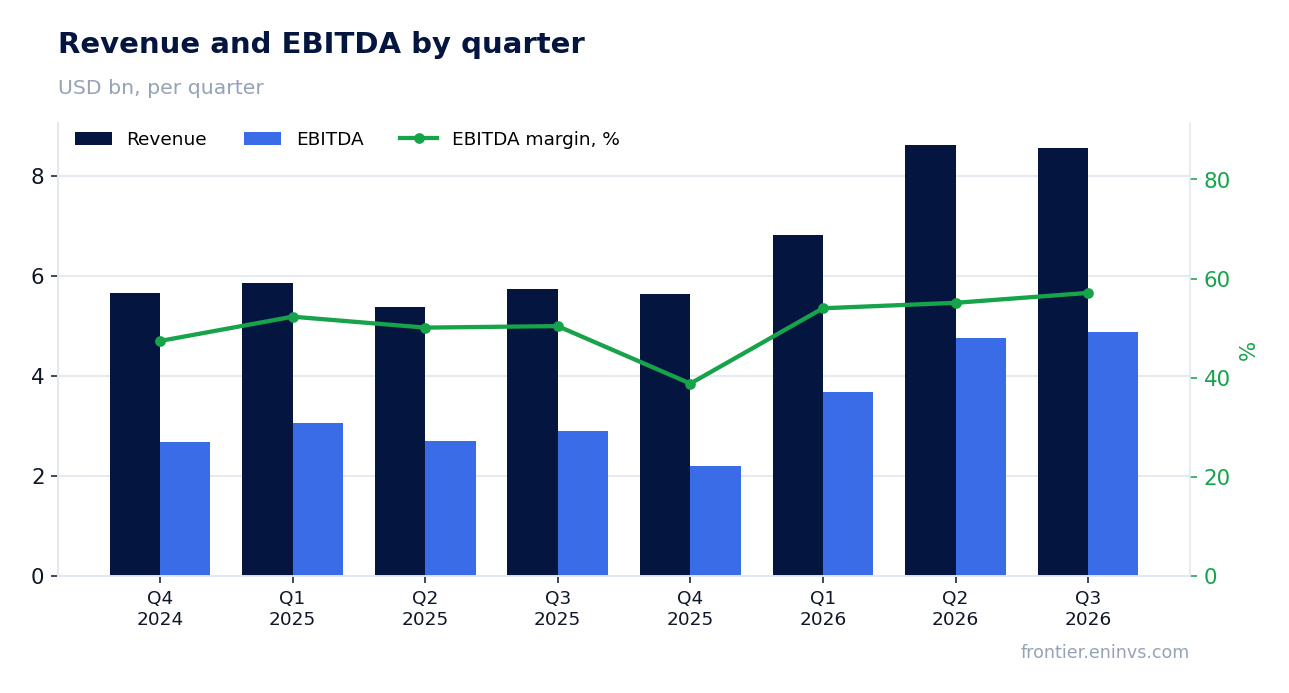
Quarter on quarter revenue beat the price-implied level by 3.0% and EBITDA by 10.1%
At the volumes and costs of the second quarter of 2026 and moving only prices, our calculation gives revenue of USD 8,301.6m – a price effect of minus USD 318.4m, or -3.7%. Actual revenue was USD 8,549m, USD 247.4m (+3.0%) above the implied level.
The EBITDA gap is wider still: an implied USD 4,428.6m against an actual USD 4,878m, plus USD 449.4m (+10.1%). With the quarterly oil price falling, the company not only held but improved its result relative to what the price promised.
Annual revenue growth decelerated: +49.2% in the third quarter against +60.5% in the second. The deceleration reflects the high base of the second quarter and the quarter-on-quarter fall in the oil price, not a deterioration of the business itself.
EBITDA margin rose to 57.1% from 50.4%, a consequence of price rather than cost cuts
EBITDA in the reported period was USD 4,878m on revenue of USD 8,549m, a margin of 57.1%. A year earlier the margin was 50.4%. The 6.7 percentage point gain came with oil up 34.2%: revenue rose 49.2% while EBITDA rose 68.8%, so operating costs grew more slowly than revenue.
The net margin rose to 32.5% from 25.7%. Net profit was USD 2,781m against USD 1,471m a year earlier, up 89.1%. EBITDA in our facts is operating profit of USD 3,586m plus depreciation of USD 1,292m; items below operating profit are not in it and explain net profit only.
Unit costs are not disclosed in the facts, so we do not name a cause for their movement. What is visible is that with oil a third more expensive the margin widened faster than revenue grew – that is the main operating result of the quarter.
Net profit grew 89.1%, faster than EBITDA, as depreciation and interest lagged revenue
Net profit in the third quarter was USD 2,781m against USD 1,471m a year earlier, up 89.1%. EBITDA over the same period grew 68.8%, so less relative cost sat below operating profit than a year ago.
Depreciation within EBITDA was USD 1,292m against operating profit of USD 3,586m. Interest and other items below operating profit are not disclosed in the facts, so we do not name their contribution. The difference between EBITDA growth and net profit growth is their combined effect.
The facts give no one-off items to strip out of profit. We do not attribute a one-off character to profit that the source does not confirm.
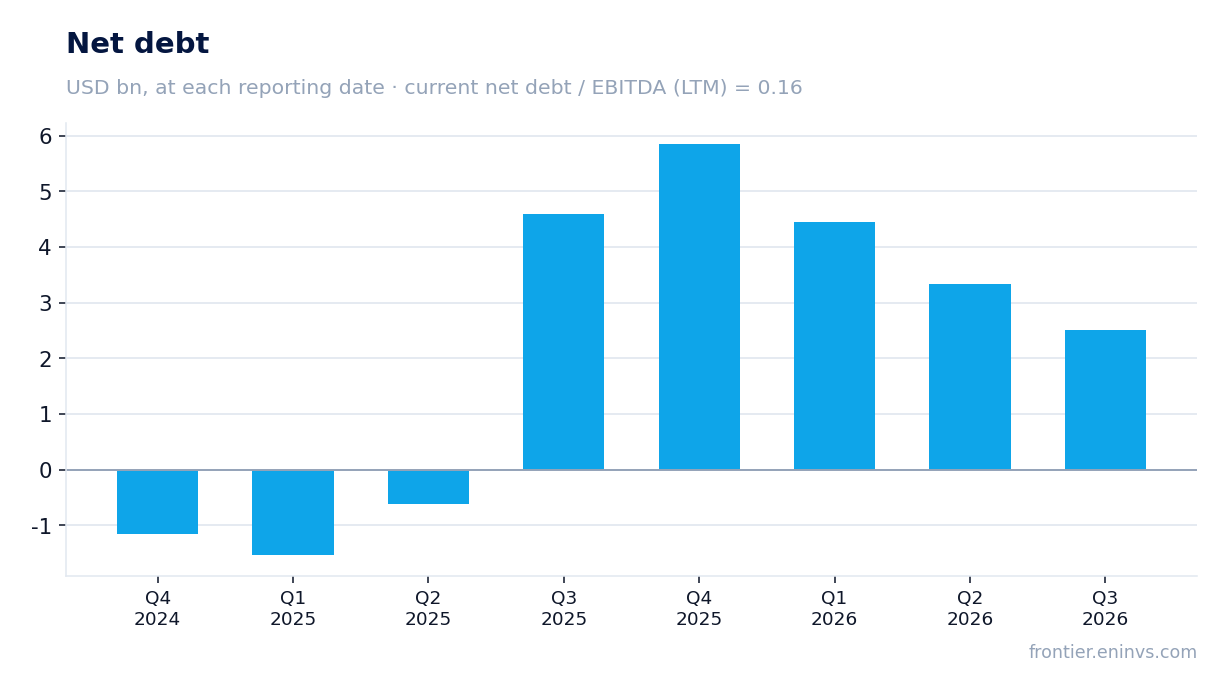
Net debt fell from USD 4.6bn on 30 September 2025 to USD 2.5bn on 30 September 2026
Net debt on 30 September 2026 was USD 2,515m. A year earlier, on 30 September 2025, it was USD 4.6bn, a fall of USD 2.1bn. Over the quarter it declined from USD 3.3bn on 30 June 2026 to USD 2.5bn on 30 September 2026, minus USD 0.8bn.
Net debt to EBITDA over the last twelve months is 0.16. That is a level, not a direction: the earlier value is not in the facts, so we do not speak of leverage rising or falling. At current prices the ratio is 0.14.
Operating cash flow in the quarter was USD 3,813m against USD 3,111m a year earlier. Over the last twelve months it was USD 14,060m. With quarterly EBITDA of USD 4,878m, cash flow covers both capital spending and dividends with room to spare.
A 2.8% dividend yield at an EV/EBITDA of 5.1 against its own three-year average of 5.3 leaves room
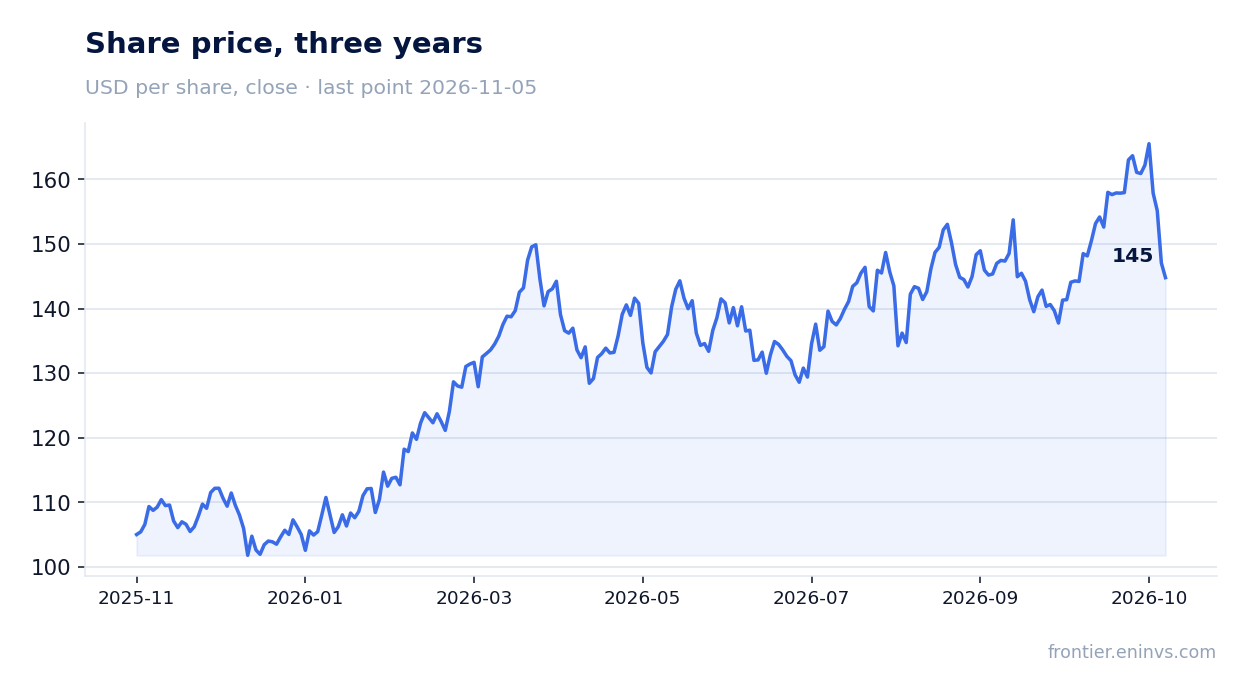
The trailing twelve-month dividend yield is 2.8% on the current price. With net profit of USD 8,186m over the last twelve months and a market capitalisation of USD 75.9bn, the payout is covered by profit, and operating cash flow of USD 14,060m leaves room for capital spending too. The facts do not give the payout for a specific year, so we do not name it.
The trailing twelve-month EV/EBITDA is 5.1. Its own three-year average is 5.3, so the share trades 5% below its history. The trailing P/E is 9.3 and return on equity is 34.2%.
At current commodity prices the portal's spot model gives annual EBITDA of USD 17,914.7m against USD 15,491m over the last twelve months, 15.6% more. EV/EBITDA at current prices is 4.4 and net debt to EBITDA 0.14. On the portal's model fair value is 31% below the market – our own estimate, not a consensus.
Reserve life at the current production rate is 11.5 years. That is the cushion that lets the payout survive lower prices, though it does not remove its dependence on oil.
Valuation on the latest reported figures
| Metric | Value |
|---|---|
| Market cap | 75.9 bn USD |
| P/E (LTM) | 9.3 |
| EV/EBITDA (LTM) | 5.1 |
| P/B | 2.55 |
| Net debt / EBITDA (LTM) | 0.16 |
| Operating cash flow (LTM) | 14.1 bn |
| ROE | 34.2% |
| Dividend yield (12m) | 2.8% |
| EV/EBITDA, 3-year average | 5.3 |
Bottom line
What was genuinely strong is that the company earned USD 848.5m more than prices implied at year-ago volumes and costs, and 25.7% more than the portal's spot model expected. EBITDA margin rose to 57.1% from 50.4%, net profit grew 89.1%, and net debt fell to USD 2.5bn at 0.16 times EBITDA. The facts show no one-offs in profit, but the source does not disclose the cause of the beat against the price-implied level – that is the main question for the next report. The share trades 5% below its own three-year EV/EBITDA average with a 2.8% dividend yield, which outweighs the cautious read of the portal's model. The verdict is rather attractive.
Open the company's financial profile EOG →
See also: market overview · valuation map · stock screeners