Robinhood Markets, Inc.: revenue growth slowed while profit fell – the margin rests on costs, not on the bottom line

On 27 October Robinhood Markets, Inc. released its results for the third quarter of 2026. Revenue came in at 1,424.0 million dollars, up 11.8% year on year, EBITDA at 808.0 million (+23.2%), and net profit at 468.0 million (–15.8%). Revenue growth slowed from 32.3% in the second quarter, and profit fell even as EBITDA rose: the EBITDA margin improved to 56.7% from 51.5%, while the net margin dropped to 32.9% from 43.6%. At an EV/EBITDA of 33.3 against its own three-year average of 37.2 the share is cheaper than its history, and on the portal's model the upside to fair value is +13%, so the stock looks rather attractive than neutral.
Key takeaways
— Revenue rose 11.8% year on year, but that is half the 32.3% pace of a quarter earlier
— EBITDA added 23.2%, and the margin rose to 56.7% from 51.5%
— Net profit fell 15.8%, and the margin compressed to 32.9% from 43.6%
— Operating cash flow for the quarter was 1,225.0 million dollars
— Leverage on net debt to LTM EBITDA is –1.66, meaning net debt is negative
— EV/EBITDA of 33.3 is 11% below its own three-year average of 37.2
— On the portal's model the upside to fair value is +13%
Attractiveness
Key figures, USD bn
| Metric | Q3 2025 | Q3 2026 | Change |
|---|---|---|---|
| Revenue | 1.27 | 1.42 | +11.8% |
| EBITDA | 0.66 | 0.81 | +23.2% |
| Operating profit | 0.63 | — | — |
| Net profit | 0.56 | 0.47 | -15.8% |
| Operating cash flow | -1.58 | 1.23 | to profit |
| Capex | 0.00 | — | — |
| EBITDA margin | 51.5% | 56.7% | +5.2 pp |
| Net margin | 43.6% | 32.9% | -10.7 pp |
Revenue rose 11.8% year on year, but that is half the 32.3% pace of a quarter earlier
In the third quarter of 2026 revenue was 1,424.0 million dollars, 11.8% more than a year earlier. That is a slowdown from the second quarter, when growth reached 32.3%: the pace of revenue expansion more than halved.
The deceleration is visible in the annual series too: revenue grew 100.0% in the third quarter of 2025, 26.5% in the fourth, 15.1% in the first quarter of 2026 and 32.3% in the second. The current 11.8% is the slowest year-on-year increase in the last five quarters.
Still, the absolute level of revenue is the highest in the company's history: 1,424.0 million dollars against 1,308.0 million in the second quarter and 1,274.0 million in the third quarter of 2025. The company is not losing ground, it is simply growing more slowly than a year earlier, when the base was low.
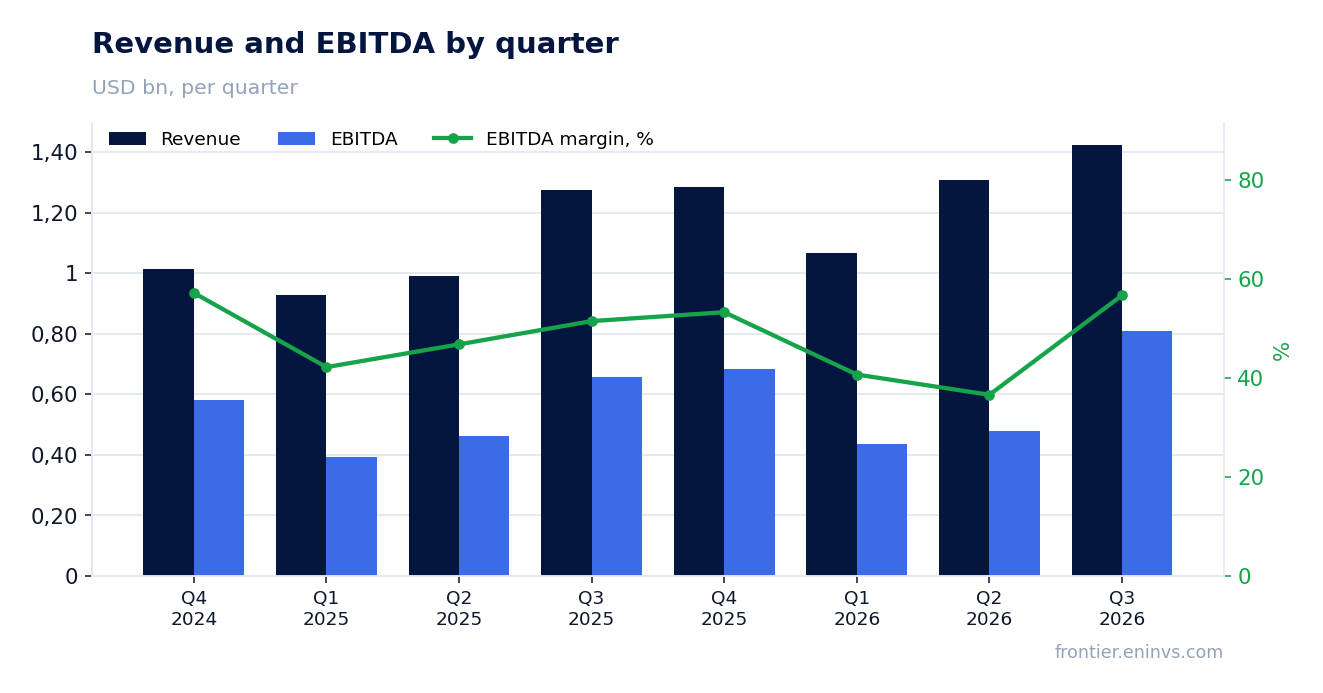
EBITDA added 23.2%, and the margin rose to 56.7% from 51.5%
EBITDA for the third quarter of 2026 was 808.0 million dollars, 23.2% more than a year earlier. EBITDA growth outpaced revenue growth, so the EBITDA margin rose to 56.7% from 51.5% in the third quarter of 2025.
EBITDA growing faster than revenue on slower revenue growth means the costs included in EBITDA rose more slowly than revenue. The report does not disclose which cost line produced the saving, so we state only the fact: the margin rose by 5.2 percentage points.
For comparison, EBITDA was 479.0 million dollars in the second quarter of 2026 and 656.0 million in the third quarter of 2025. The current level is the highest in the last five quarters, and it was achieved on revenue that grew more slowly than a year earlier.
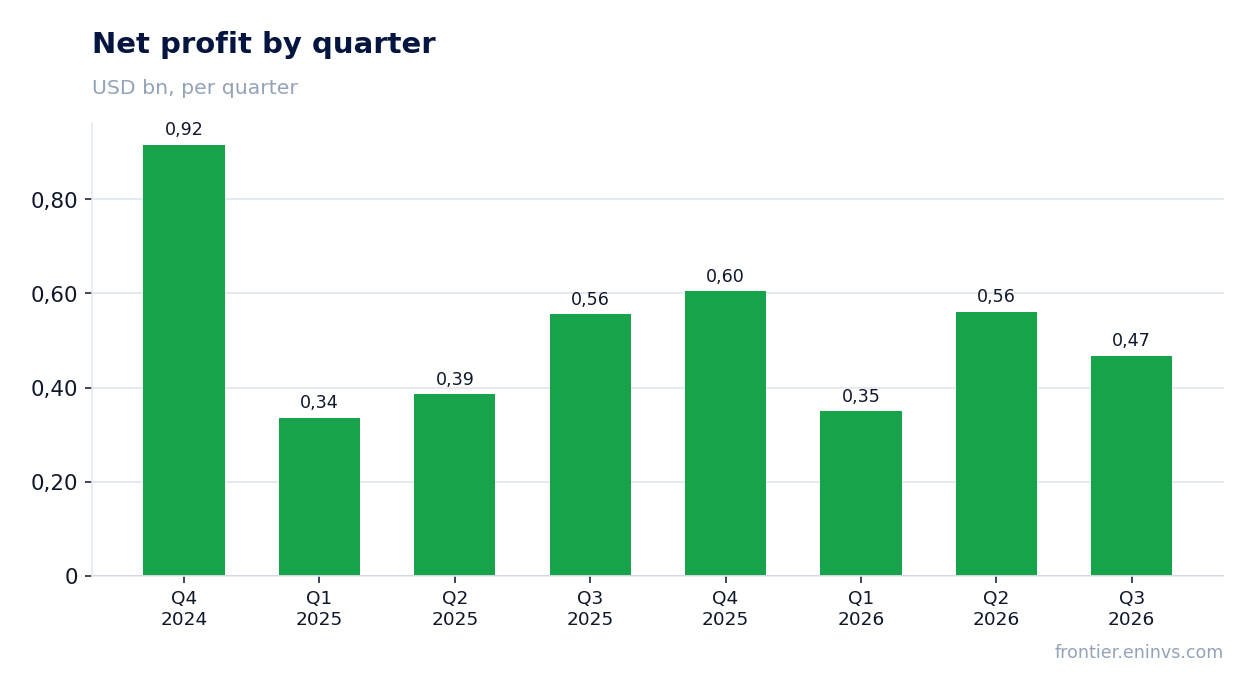
Net profit fell 15.8%, and the margin compressed to 32.9% from 43.6%
Net profit for the third quarter of 2026 was 468.0 million dollars, 15.8% less than a year earlier. EBITDA grew 23.2% and revenue 11.8%, so the profit decline did not originate at the operating level.
The net margin fell to 32.9% from 43.6% a year earlier. The gap between EBITDA growth and the profit decline means that below the operating line there were costs or losses that were absent or smaller a year earlier. The report does not disclose the cause, so we record the divergence itself rather than its source.
Over the last twelve months net profit was 1,984.0 million dollars. That is a level, not a third-quarter result: the annual figure spans four quarters and cannot be compared with quarterly dynamics.
Operating cash flow for the quarter was 1,225.0 million dollars
Operating cash flow for the third quarter of 2026 was 1,225.0 million dollars. That is a positive figure, and it exceeds net profit for the same quarter (468.0 million), so the cash result was better than the accounting one.
For a broker, operating cash flow largely reflects the movement of client funds and positions rather than the result of operations alone. Its level is therefore neither a signal of strength nor of weakness – it shows the direction of funding.
Over the last twelve months operating cash flow was 3,046.0 million dollars. That is an annual level, and it includes quarters with different signs: for example, the flow was negative in the third quarter of 2025 (–1,576.0 million) and positive in the second quarter of 2025 (3,509.0 million).
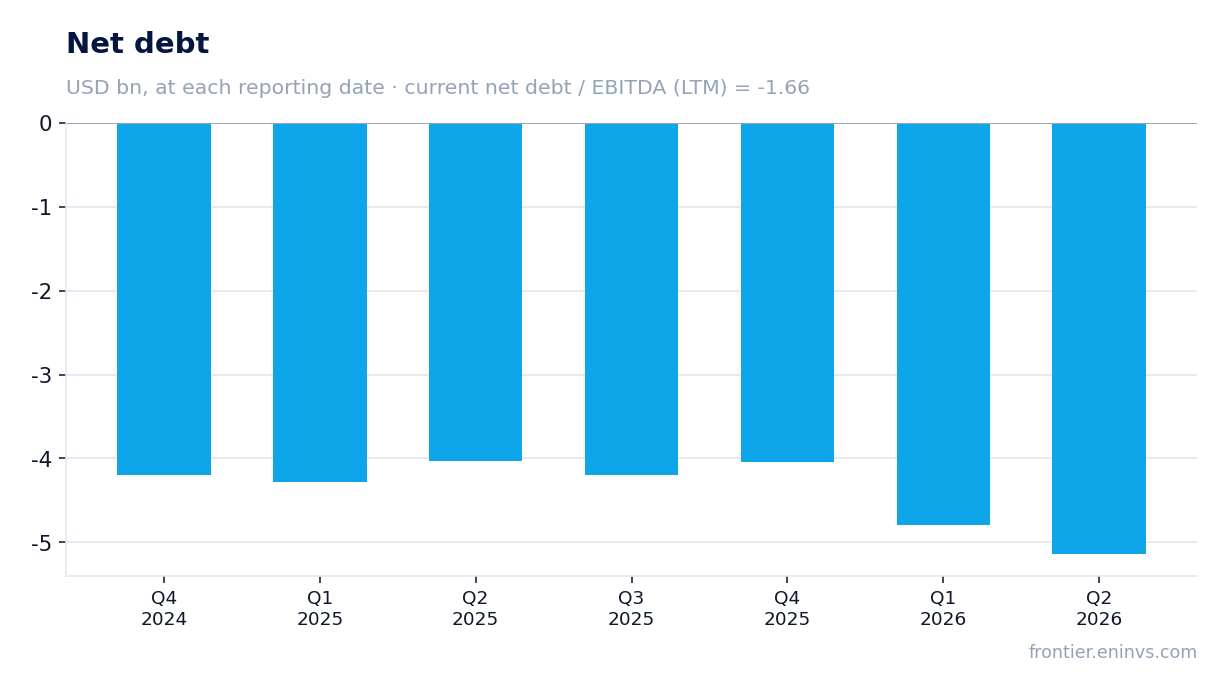
Leverage on net debt to LTM EBITDA is –1.66, meaning net debt is negative
Net debt at the latest annual reporting date was –4,040.0 million dollars, meaning cash exceeds debt obligations. The ratio of net debt to EBITDA over the last twelve months is –1.66: the company holds net cash rather than debt.
Negative net debt means the company carries no debt burden in the usual sense. That removes interest-rate and refinancing risk, but it says nothing about how the company uses its excess cash.
The net debt to EBITDA ratio is given as a level at the latest reporting date. An earlier value of this ratio is not in the facts, so we do not claim that leverage rose or fell.
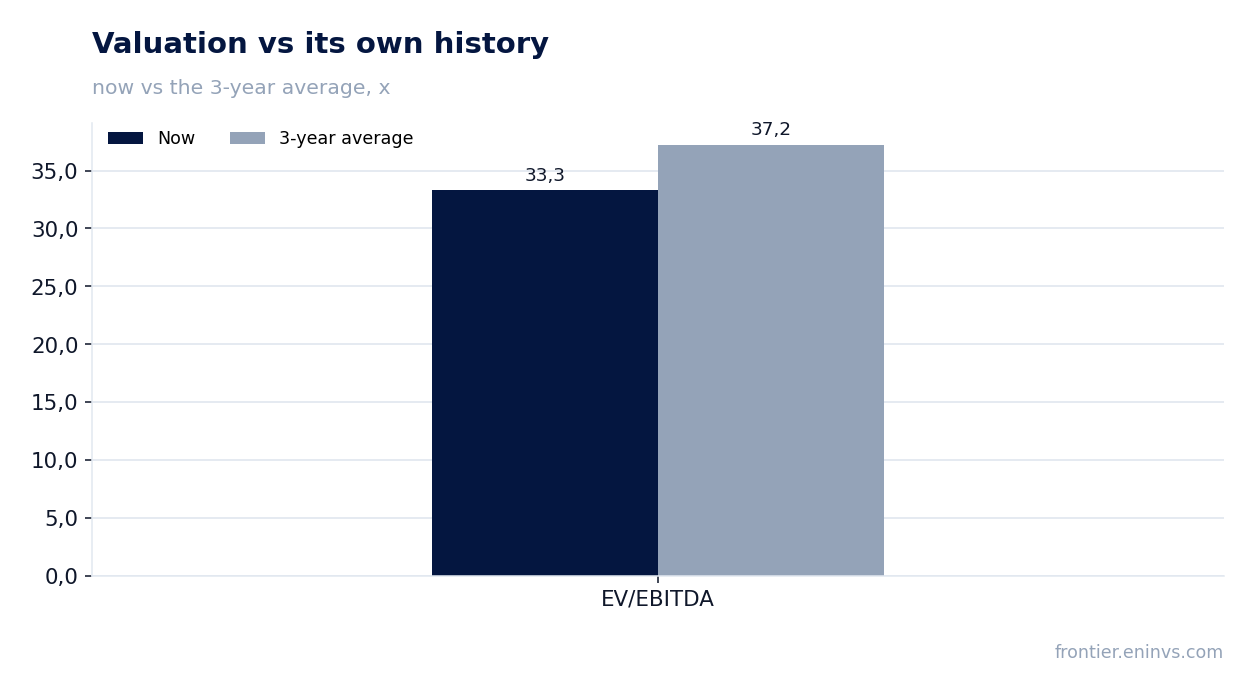
EV/EBITDA of 33.3 is 11% below its own three-year average of 37.2
The EV/EBITDA multiple over the last twelve months is 33.3 against its own three-year average of 37.2. The share trades 11% cheaper than its three-year average, so on this multiple it is cheaper than its history.
The P/E over the last twelve months is 42.96. That is a high level, but it reflects annual profit rather than a quarter, and it cannot be compared with quarterly profit dynamics.
On the portal's model the upside to fair value is estimated at +13%. That is our own estimate, not a market consensus and not a target price: it is built on EBITDA growth and a target multiple.
On the portal's model the upside to fair value is +13%
On the portal's model the fair value of the share exceeds the current market price by 13%. The model relies on EBITDA growth and a target multiple, not on market consensus or analyst target prices.
Market capitalisation is 85,229.6 million dollars. At that capitalisation and an EV/EBITDA of 33.3 the model records a gap to fair value, but the gap is modest and sensitive to changes in EBITDA.
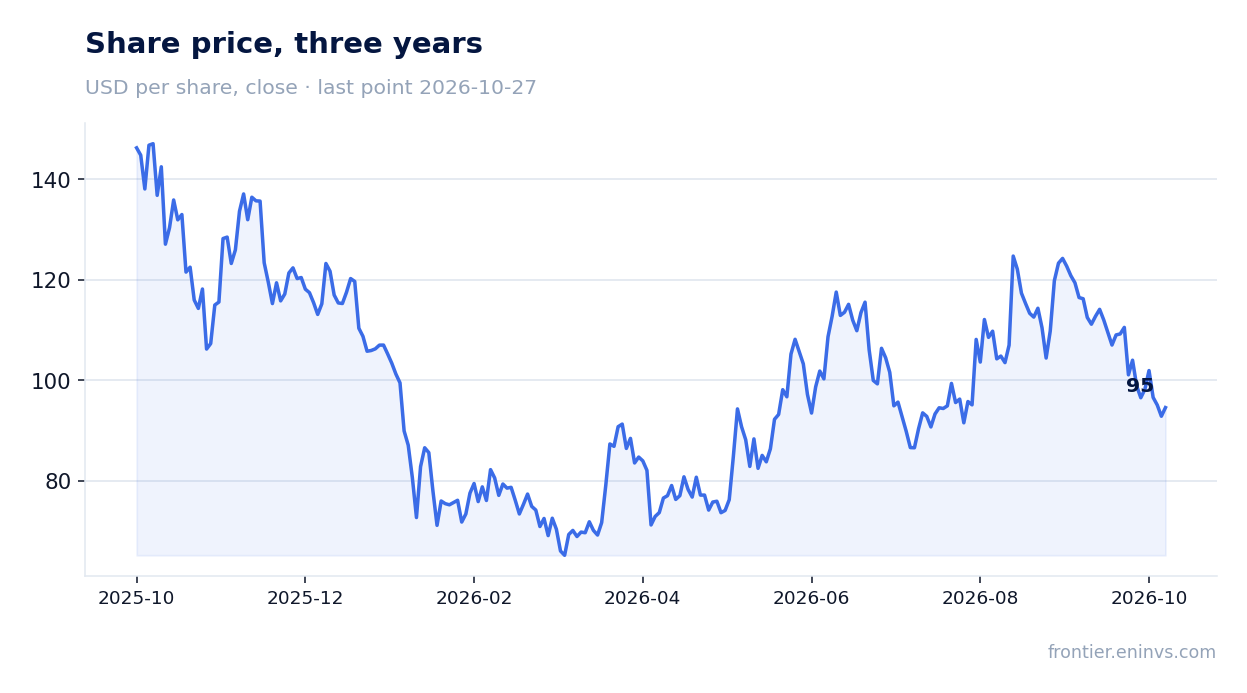
The share closed at 92.84 dollars before the release, added 1.9% on the release day and a further 1.9% from the release to 27 October. The market reaction was restrained and positive.
Valuation on the latest reported figures
| Metric | Value |
|---|---|
| Market cap | 85.2 bn USD |
| P/E (LTM) | 43.0 |
| EV/EBITDA (LTM) | 33.3 |
| P/B | 9.31 |
| Net debt / EBITDA (LTM) | -1.66 |
| Operating cash flow (LTM) | 3.05 bn |
| ROE | 6.4% |
| EV/EBITDA, 3-year average | 37.2 |
Bottom line
The strength of the quarter was EBITDA: 808.0 million dollars, up 23.2%, with a margin of 56.7% against 51.5% a year earlier. The weakness was net profit: 468.0 million, down 15.8%, with a margin of 32.9% against 43.6%, and the report does not disclose the reason for the divergence from EBITDA. Revenue grew 11.8%, but that is a slowdown from 32.3% in the second quarter. Leverage is negative (–1.66 on net debt to LTM EBITDA), and the EV/EBITDA of 33.3 is 11% below its own three-year average of 37.2. On the portal's model the upside to fair value is +13%, so at the current price the share looks rather attractive, but the key question for a holder is why profit is falling while EBITDA rises.
Open the company's financial profile HOOD →
See also: market overview · valuation map · stock screeners