INTERNATIONAL BUSINESS MACHINES CORP: revenue accelerated to +4.7% and profit is up a quarter — but almost none of it is operating
On 21 October INTERNATIONAL BUSINESS MACHINES CORP reported third-quarter 2026 results: revenue of $17,103m (+4.7% year on year), adjusted EBITDA of $4,900m (+32.0%) and net profit of $2,190m (+25.6%). Revenue growth accelerated from +1.1% in the second quarter, but profit grew mainly because the effective tax rate fell from 28.2% to 11.9%, not because of operations. At EV/EBITDA of 17.6 the share is cheaper than its own three-year average of 20.5, the dividend yield is 2.7% and the portal model puts upside to fair value at +24% — on that valuation and dividend the share looks rather attractive than neutral.
Key takeaways
— Revenue accelerated to +4.7% — software and infrastructure carried it, consulting stood still
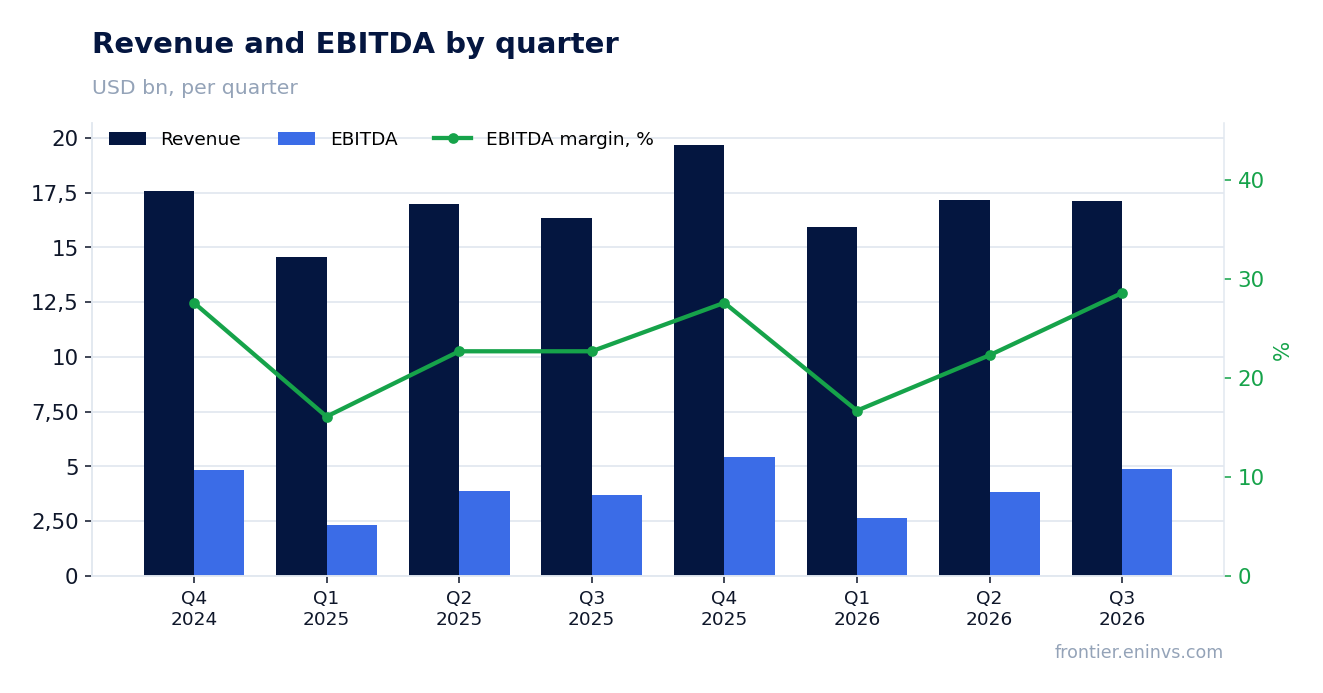
— EBITDA rose 32.0% on 4.7% revenue growth — the margin climbed to 28.6% from 22.7%
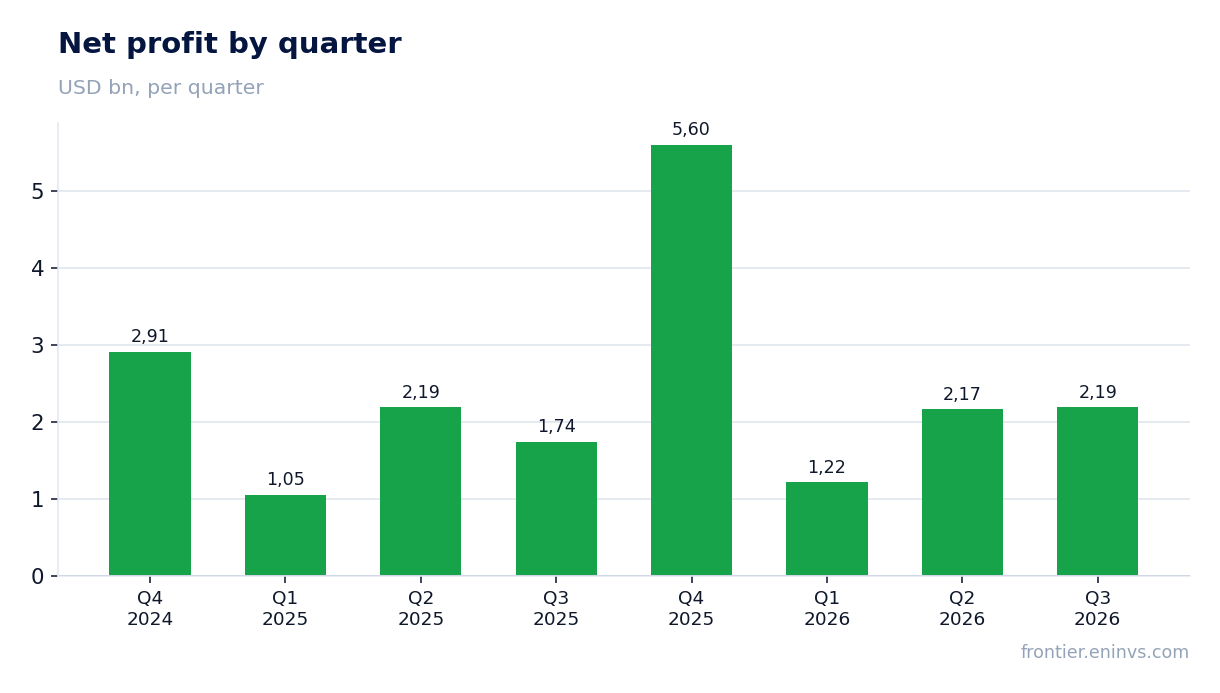
— Net profit grew 25.6% mainly because the effective tax rate fell to 11.9%
— Nine-month free cash flow of $7,787m is $606m above last year
— The $1.69 dividend at a 2.7% yield rests on cash flow, not on profit
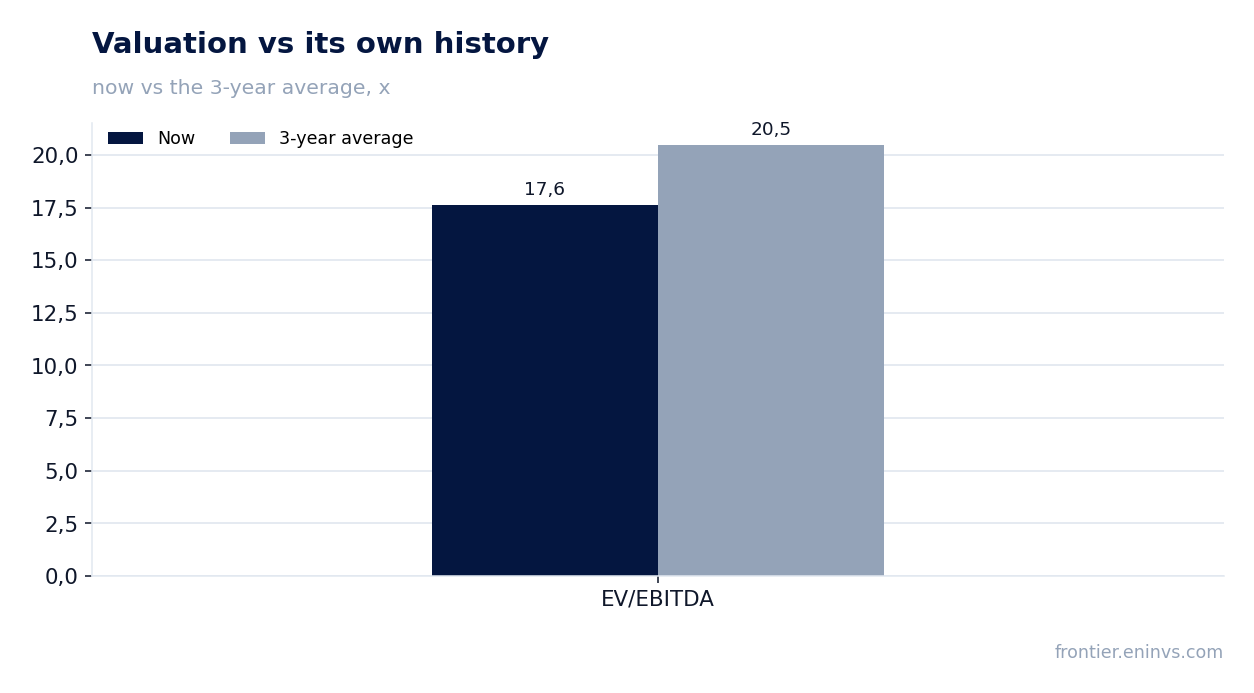
— EV/EBITDA of 17.6 against its own three-year average of 20.5 — the share is 14% cheaper than its history
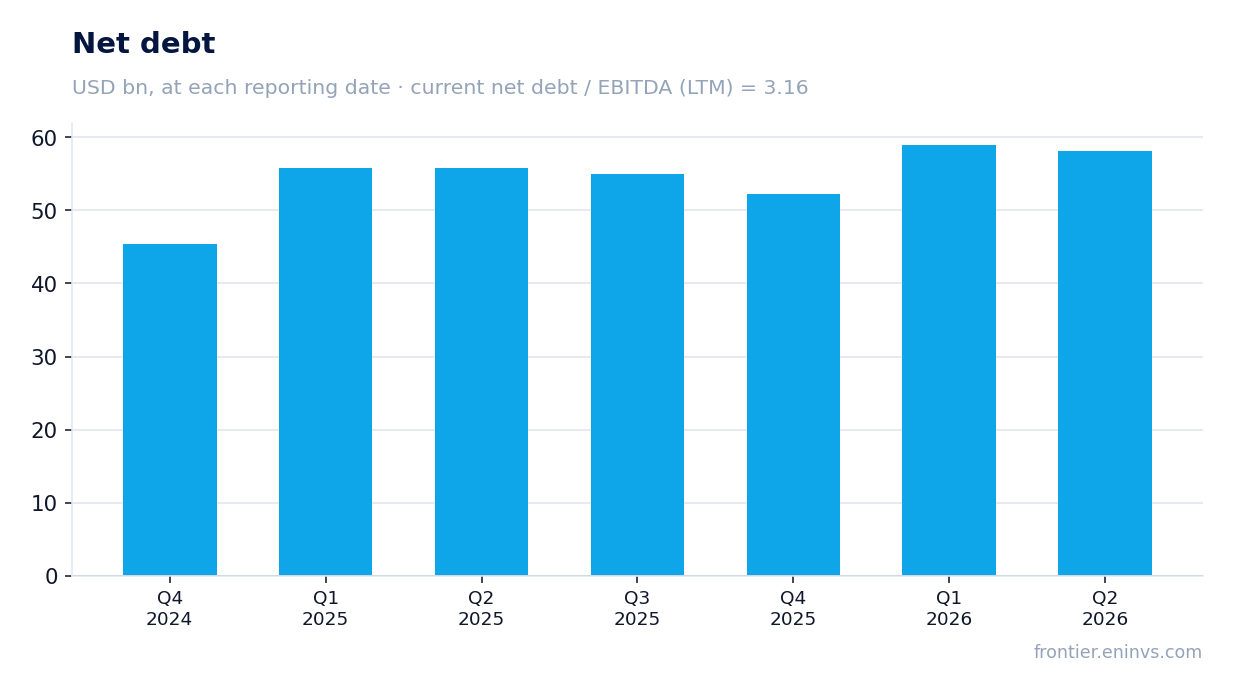
— Leverage of 3.16x EBITDA is a level without direction, but debt rose to $63.8bn
Attractiveness
Key figures, USD bn
| Metric | Q3 2025 | Q3 2026 | Change |
|---|---|---|---|
| Revenue | 16.3 | 17.1 | +4.7% |
| EBITDA | 3.71 | 4.90 | +32.0% |
| Operating profit | 2.43 | — | — |
| Net profit | 1.74 | 2.19 | +25.6% |
| Operating cash flow | 3.08 | 4.03 | +30.6% |
| Capex | 0.26 | — | — |
| EBITDA margin | 22.7% | 28.6% | +5.9 pp |
| Net margin | 10.7% | 12.8% | +2.1 pp |
Revenue accelerated to +4.7% — software and infrastructure carried it, consulting stood still
Third-quarter revenue was $17,103m, up 4.7% year on year and an acceleration from +1.1% in the second quarter. At constant currency growth was 6%: currency worked against reported figures this quarter, and the company says the currency effect will be neutral for the full year.
Software brought in $7,804m (+8.2%), and within it Data grew fastest at +19%, Hybrid Cloud (Red Hat) added 11% and Transaction Processing 9%. Automation fell 3% — the only large software line with negative dynamics.
Consulting delivered $5,335m, up 0.2%: Strategy and Technology grew 2%, Intelligent Operations fell 2%. Infrastructure added 4.2% to $3,707m, but with a wide spread inside: Distributed Infrastructure +31%, while IBM Z fell 20% as the mainframe cycle passed its peak.
The structure is clear: growth rests on software and distributed infrastructure, while two large lines — consulting and mainframes — drag. What matters for the next quarter is whether Data and Distributed Infrastructure hold up once the low base in mainframes fades.
EBITDA rose 32.0% on 4.7% revenue growth — the margin climbed to 28.6% from 22.7%
Adjusted EBITDA for the quarter was $4,900m, up 32.0% year on year, with a margin of 28.6% against 22.7% a year earlier. That gap between revenue and EBITDA growth means costs barely moved: SG&A fell from $4,748m to $4,620m, and other income and expense contributed positively.
Gross margin, by contrast, declined to 56.8% from 57.3%. The pressure came from consulting (27.4% against 29.3%) and financing (40.7% against 45.6%), while software held 82.5%. So the EBITDA margin was pulled up not by gross profitability but by savings on operating costs and one-off items below the gross line.
Operating (non-GAAP) pre-tax income rose 9% to $3,295m, a 19.3% margin against 18.6%. That is a more modest gain than EBITDA and a better picture of what happened: the company earns slightly more on slightly lower costs rather than making a step change.
Net profit grew 25.6% mainly because the effective tax rate fell to 11.9%
Net profit for the quarter was $2,190m, up 25.6% year on year, with a net margin of 12.8% against 10.7%. Pre-tax income grew only 3% to $2,497m, while tax fell from $686m to $298m. The effective rate dropped from 28.2% to 11.9% — that, not operating dynamics, produced most of the profit increase.
One-off items also show in the income statement: the quarter includes a $10m loss from discontinued operations, and so do the nine months. Income from continuing operations for the nine months was $5,581m against $4,992m a year earlier.
For a holder this means the quarter's profit cannot be carried forward as a sustainable level: an 11.9% tax rate is below what the company paid last year, and a return to a more normal rate would eat into profit even if operating momentum holds.
Nine-month free cash flow of $7,787m is $606m above last year
Operating cash flow for the quarter was $4,025m against $3,081m a year earlier. Free cash flow was $3,027m against $2,373m, and for the nine months $7,787m against $7,181m. The company raised its full-year free cash flow guidance to growth of more than $1bn year on year.
Over the nine months the company spent $11,364m on acquisitions — the largest investing item and the main cash outflow. Capex was modest at $793m for the nine months, with another $467m in software investment. Free cash flow therefore rests not on asset savings but on operations generating more than the company spends to keep the business running.
Dividends for the nine months cost $4,762m — more than half of free cash flow. The flow covers the payment, but the cushion is thin, and any deterioration in operations or a new wave of acquisitions would shrink it.
The $1.69 dividend at a 2.7% yield rests on cash flow, not on profit
The board declared a quarterly dividend of $1.69 per share, payable on 10 December 2026. The company has paid dividends every quarter without interruption since 1916 — part of its investment profile, and the release highlights it.
The trailing twelve-month yield is 2.7%. Over the nine months dividends cost $4,762m against free cash flow of $7,787m: the payment is covered about 1.6 times. Net profit for the last twelve months was $11,171m, so dividends absorb roughly 43% of profit. That is a moderate payout ratio and leaves room for acquisitions, on which $11,364m has already gone this year.
Our estimate for the current year's dividend is growth within the declared quarterly rate — about $6.76 per share on four payments of $1.69. That is our estimate, and it hinges on two things: free cash flow staying above $7bn and no acquisitions beyond those already made. If the company keeps buying businesses at this pace, the payment remains covered but the cushion narrows.
A 2.7% yield is below what an investor can get on risk-free instruments, which is normal for a share with revenue growth and a stable payout. The dividend here is not the main source of return but confirmation that the business generates cash.
EV/EBITDA of 17.6 against its own three-year average of 20.5 — the share is 14% cheaper than its history
On EV/EBITDA the share trades at 17.6 against its own three-year average of 20.5 — 14% below its history. That is the only valid comparison: we do not compare with the sector or peers, as no such data is in the facts.
Trailing P/E is 21.4, which with net profit of $11,171m and a market cap of $238,554m gives the same picture of a moderate valuation. Return on equity of 8.3% is not high, but for a company with $74,916m of goodwill and a large share of acquired intangibles that is expected.
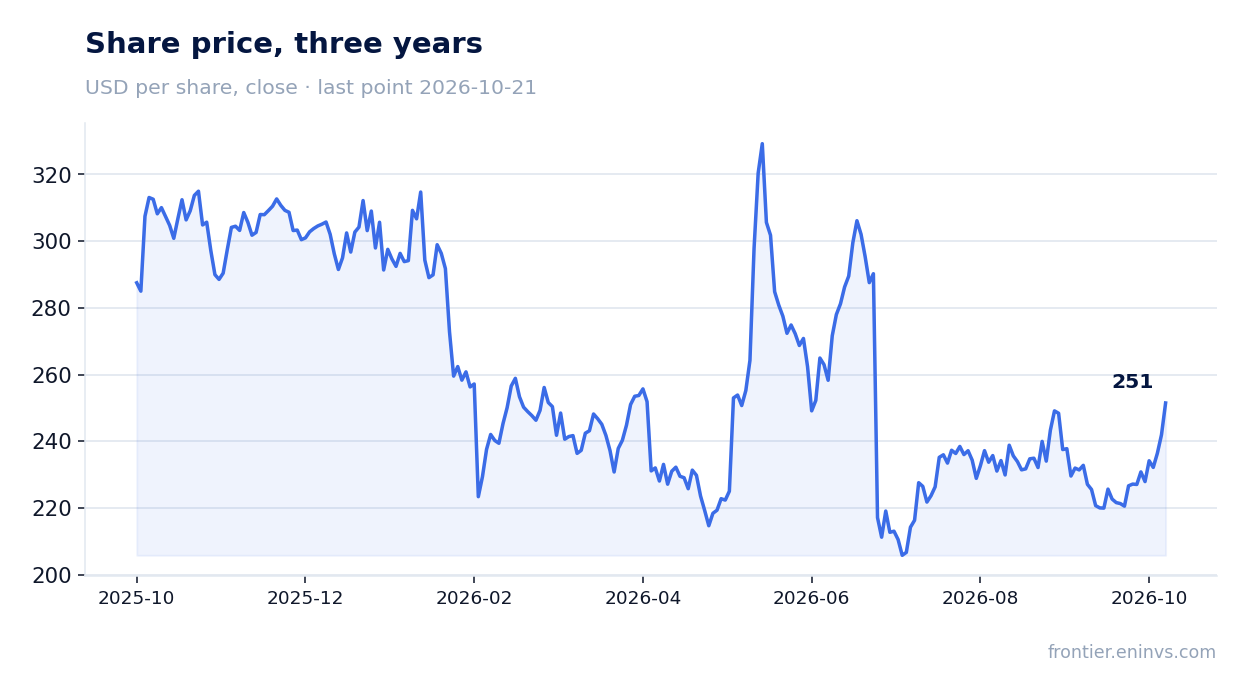
The portal model puts upside to fair value at +24%: it takes EBITDA growth times the target multiple against the current market cap. That is our own estimate, not a market consensus or a target price. The market reaction to the report was restrained: the share added 3.9% on the release day and the same from the release to 21 October.
Leverage of 3.16x EBITDA is a level without direction, but debt rose to $63.8bn
Net debt at the latest annual balance-sheet date was $52,173m, and the ratio to trailing twelve-month EBITDA is 3.16. That is a level, not a direction: no earlier value of the ratio is in the facts, so we say nothing about leverage rising or falling.
Total debt, including $12,700m at the financing unit, stood at $63,800m at quarter-end — $2,600m more than at the start of the year. The increase is tied to acquisitions: $11,364m went on them over nine months, partly funded by borrowing. Quarterly interest expense was $491m, almost unchanged from a year earlier.
Leverage of 3.16x EBITDA is moderate for a company with steady cash flow and a long dividend record, but not low. With nine-month free cash flow of $7,787m, debt service creates no strain, but new large acquisitions would require either more borrowing or trimming payouts.
Valuation on the latest reported figures
| Metric | Value |
|---|---|
| Market cap | 239 bn USD |
| P/E (LTM) | 21.4 |
| EV/EBITDA (LTM) | 17.6 |
| P/B | 7.31 |
| Net debt / EBITDA (LTM) | 3.16 |
| Operating cash flow (LTM) | 15.8 bn |
| ROE | 8.3% |
| Dividend yield (12m) | 2.7% |
| EV/EBITDA, 3-year average | 20.5 |
Bottom line
What was strong in the report was revenue acceleration to +4.7% and free cash flow of $7,787m for nine months — the company raised its full-year cash flow guidance. What was weak was that profit grew 25.6% mainly because of an 11.9% tax rate rather than operations, and that consulting stood still. The real question for a holder now is whether the 28.6% EBITDA margin holds once the tax rate normalises, and whether software keeps growing at double digits. At EV/EBITDA of 17.6 against its own average of 20.5 and a 2.7% dividend yield, the share looks rather attractive, but with little room for error in operating momentum.
Open the company's financial profile IBM →
See also: market overview · valuation map · stock screeners