JABIL INC: revenue up 11.8% but the market took off 10% — profit tripled while the stock fell
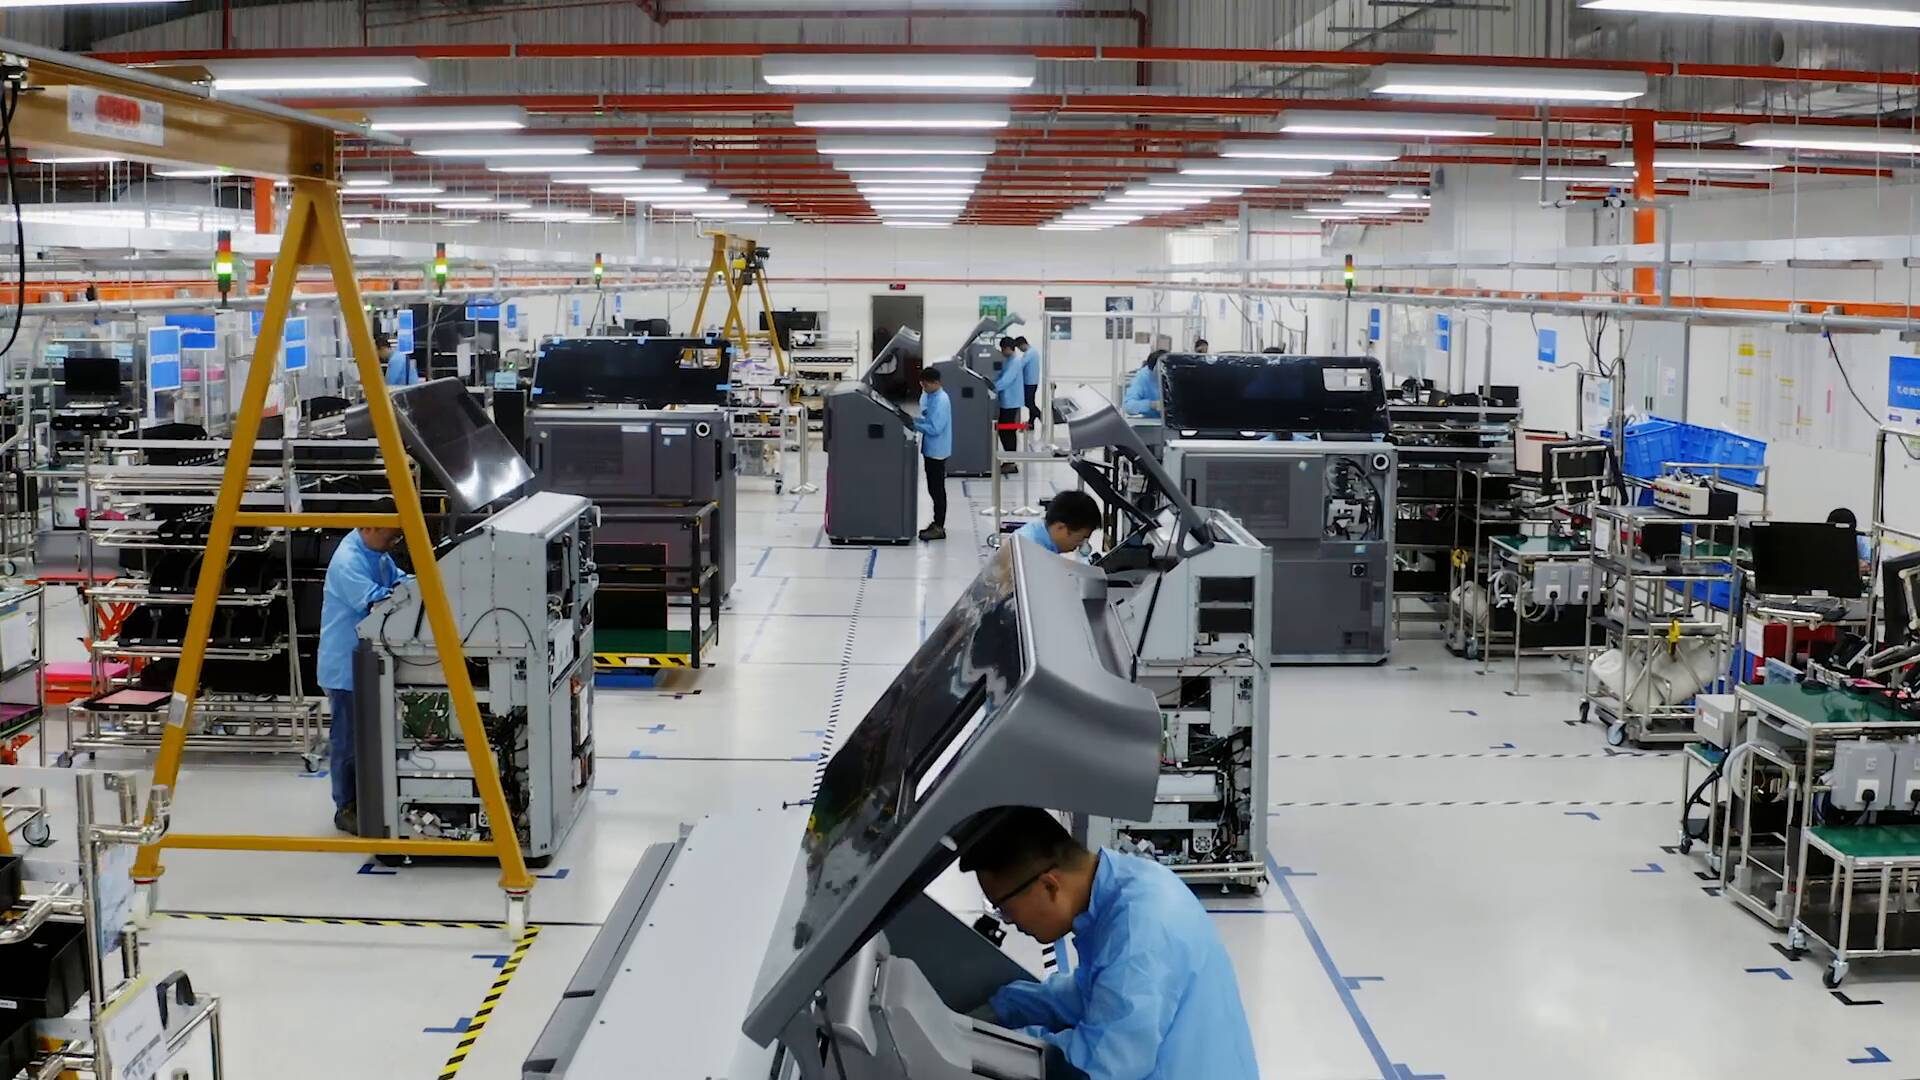
On September 30, JABIL INC reported results for the fourth quarter and the full fiscal year 2026 ended August 31. Quarterly revenue was $10,616 million, operating profit $602 million, net profit $398 million at a 3.7% margin. Year on year revenue rose 11.8%, slower than the 23.1% a quarter earlier — a deceleration. On the release day the stock lost 10%, and at the current price it looks rather attractive: EV/EBITDA of 14.0 against its own three-year average of 7.8, but the portal's model puts the upside to fair value at +20%, while the dividend yield of 0.11% is small.
Key takeaways
— Revenue rose 11.8% year on year, but that is a deceleration from 23.1% a quarter earlier
— Operating profit of $602 million at a 5.7% margin — the strongest quarter of the year in absolute terms
— Net profit of $398 million, almost all of it earned rather than coming from one-off items
— For the full fiscal year 2026 revenue was $35,954 million and adjusted free cash flow $1,532 million
— Leverage at 0.77x LTM EBITDA is moderate, but EV/EBITDA of 14.0 is twice its own three-year average of 7.8
— The 0.11% dividend yield is not an argument to buy, and the payout remains minimal
— The portal's model puts the upside to fair value at +20%, the main counterweight to the market's caution
Attractiveness
Key figures, USD bn
| Metric | — | Q3 2026 | Change |
|---|---|---|---|
| Revenue | — | 10.6 | — |
| Operating profit | — | 0.60 | — |
| Net profit | — | 0.40 | — |
| Net margin | — | 3.7% | — |
Revenue rose 11.8% year on year, but that is a deceleration from 23.1% a quarter earlier
In the fourth quarter of fiscal 2026 JABIL INC revenue was $10,616 million versus $8,252 million a year earlier, a rise of 11.8%. That is markedly slower than the 23.1% posted a quarter earlier — a deceleration. For a company with annual turnover of about $36 billion the pace is still solid, but the market reaction suggests expectations were higher.
The main growth driver is AI infrastructure, as CEO Mike Dastoor explicitly says. He also notes strong performance in automotive, healthcare, energy, defence and aerospace, and warehouse and retail automation. That is a diversified set rather than a bet on a single customer.
For the full fiscal year 2026 revenue reached $35,954 million against $29,802 million a year earlier, growth of about 21%. The company itself calls the year exceptional. Yet the quarterly dynamics show the peak growth rate may have passed: 23.1% in the third quarter gave way to 11.8% in the fourth.
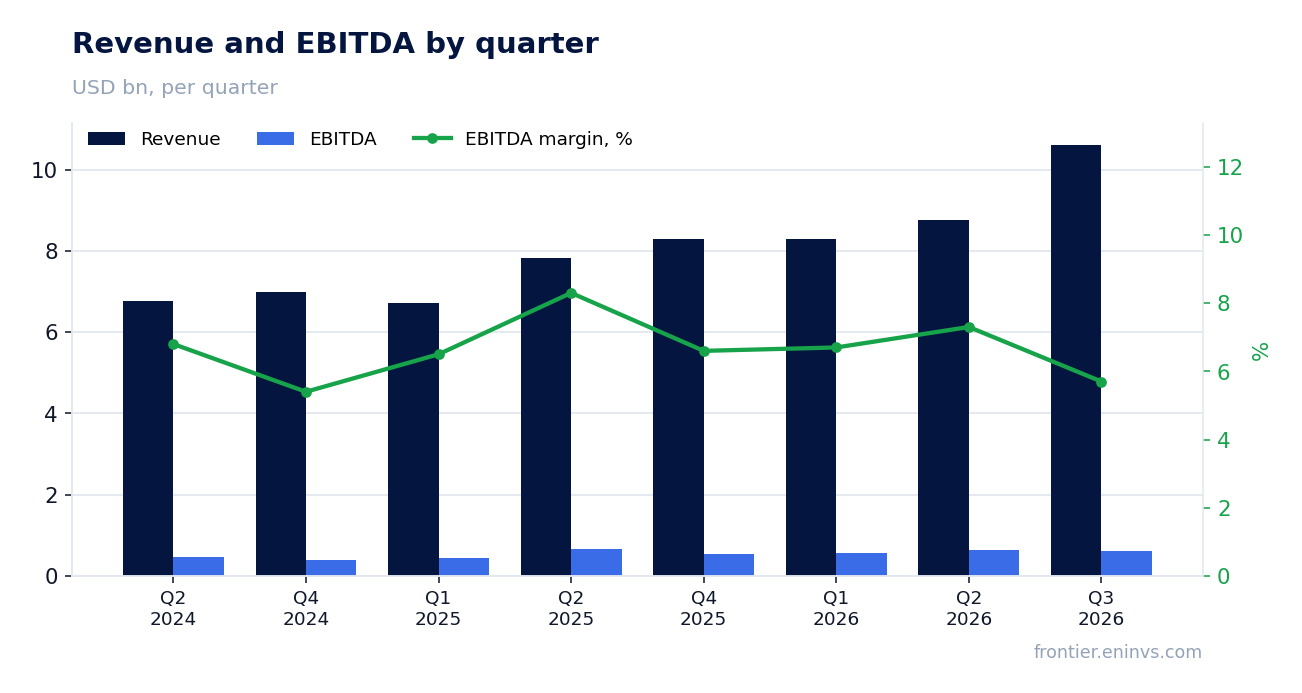
Operating profit of $602 million at a 5.7% margin — the strongest quarter of the year in absolute terms
Operating profit in the fourth quarter was $602 million versus $337 million a year earlier. That is the strongest quarter of fiscal 2026 in absolute terms: the previous quarter had 445 million, the first 374 million. The GAAP margin rose to 5.7% from 4.1% a year earlier.
Core operating income reached $675 million, with a core margin of 6.4% versus 6.3% a year earlier. The gap between GAAP and core is small: $73 million of adjustments, of which 25 million is stock-based compensation, 24 million amortisation of intangibles, 9 million restructuring. That means quarterly profit is mostly operating rather than one-off.
For the full financial year GAAP operating profit was $1,704 million, core operating income $2,069 million. The company notes core operating margin expansion of 40 basis points for the year. This supports the thesis of moving up the value chain that management talks about.
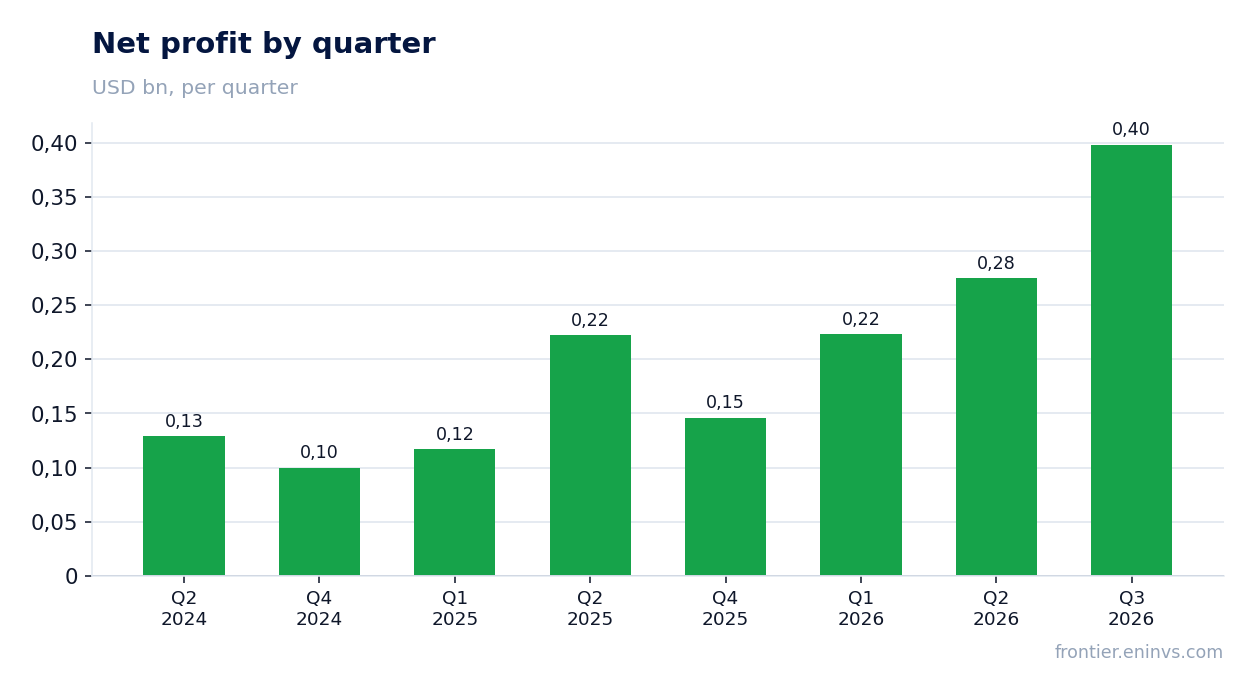
Net profit of $398 million, almost all of it earned rather than coming from one-off items
Net profit attributable to JABIL INC shareholders in the fourth quarter was $398 million versus $218 million a year earlier. The net margin was 3.7%. Diluted earnings per share were $3.76 on a GAAP basis and $4.40 on a core basis.
The difference between GAAP and core net profit comes from operating profit adjustments and taxes. Core earnings were $466 million. That means about $68 million, or 15% of core earnings, comes from items the company considers non-core. These are mainly stock-based compensation and amortisation rather than cash one-offs.
For the full fiscal year 2026 GAAP net profit was $1,042 million, core earnings $1,399 million. A year earlier the figures were $657 million and $1,082 million respectively. Profit growth outpaces revenue growth, indicating positive operating leverage.
For the full fiscal year 2026 revenue was $35,954 million and adjusted free cash flow $1,532 million
Operating cash flow for fiscal 2026 was $2,002 million versus $1,640 million a year earlier. Capital expenditure was $628 million, $160 million more than a year earlier. Adjusted free cash flow, which the company defines as operating cash flow less net capital expenditure, reached $1,532 million versus $1,318 million a year earlier.
The rise in capital expenditure is tied to capacity expansion for growing demand, including in AI infrastructure. The company calls its model asset-light, but actual investment is growing. That is normal for a growth phase, yet it weighs on free cash flow.
Working capital absorbed significant funds: inventories rose by $2,681 million, receivables by $2,394 million, prepaid expenses by $2,538 million. This is typical for a company scaling up and is partly financed by a $7,984 million increase in accounts payable. Such a profile means cash flow depends on the ability to sustain payables.
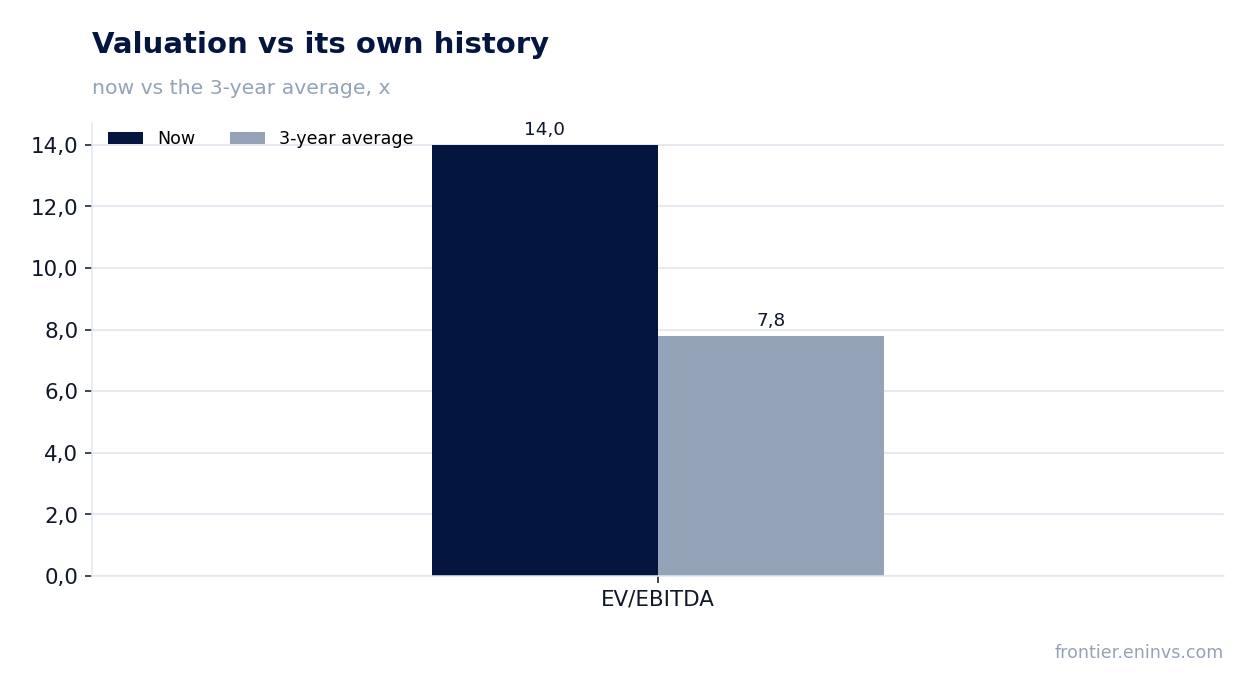
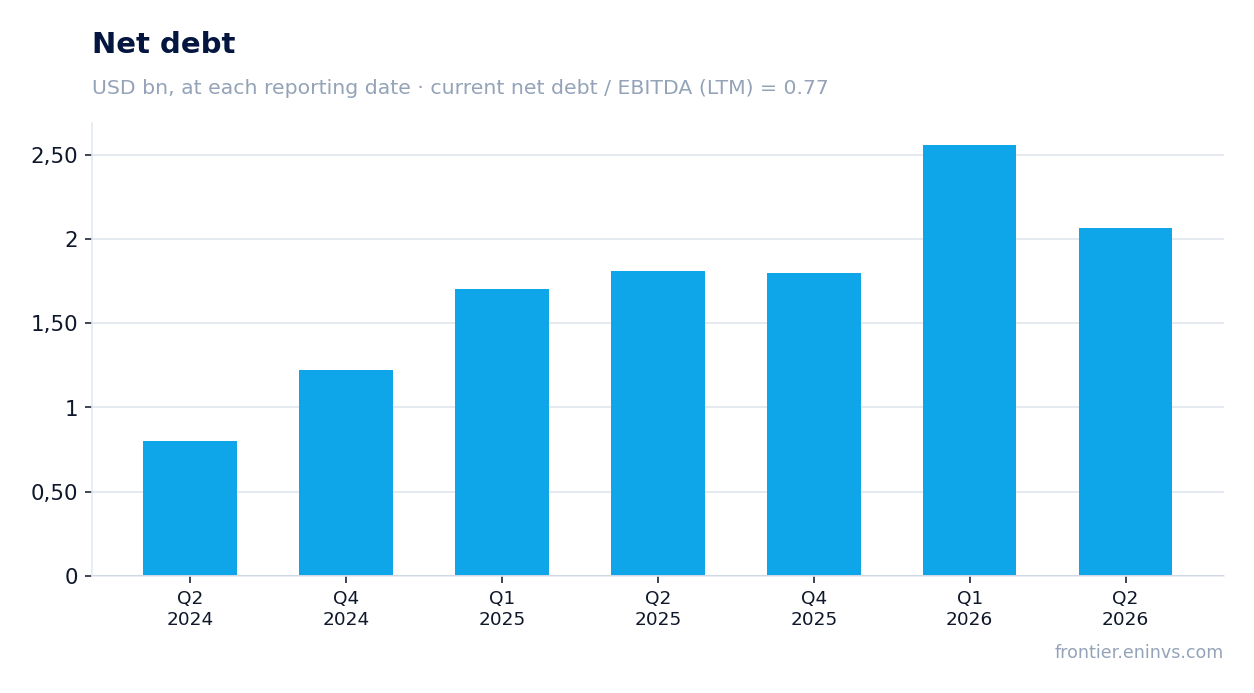
Leverage at 0.77x LTM EBITDA is moderate, but EV/EBITDA of 14.0 is twice its own three-year average of 7.8
Net debt at the latest annual reporting date was $1,798 million. The ratio of net debt to LTM EBITDA is 0.77. That is a moderate level for a contract manufacturer and does not put pressure on the balance sheet. However, comparison with the previous value is impossible: it is not in the facts, so the direction of leverage cannot be determined.
LTM EBITDA is $2,330.1 million. With a market capitalisation of $30,832 million, EV/EBITDA is 14.0. That is exactly twice its own three-year average of 7.8. The market values the company significantly above its three-year average, explained by growth expectations in AI infrastructure.
The LTM P/E is 29.6. This is also above historical levels, although no exact average for P/E is in the facts. Return on equity of 108.4% reflects a low equity base due to aggressive share buybacks: over the year the company spent $1,060 million on repurchases. This supports earnings per share but increases financial leverage.
The 0.11% dividend yield is not an argument to buy, and the payout remains minimal
The trailing twelve-month dividend yield is 0.11%. That is an extremely low level, not comparable with the key rate or bond yields. The company paid $35 million in dividends for fiscal 2026 against net profit of $1,042 million. The payout ratio is about 3.4% — the company prefers to direct funds to buybacks and development.
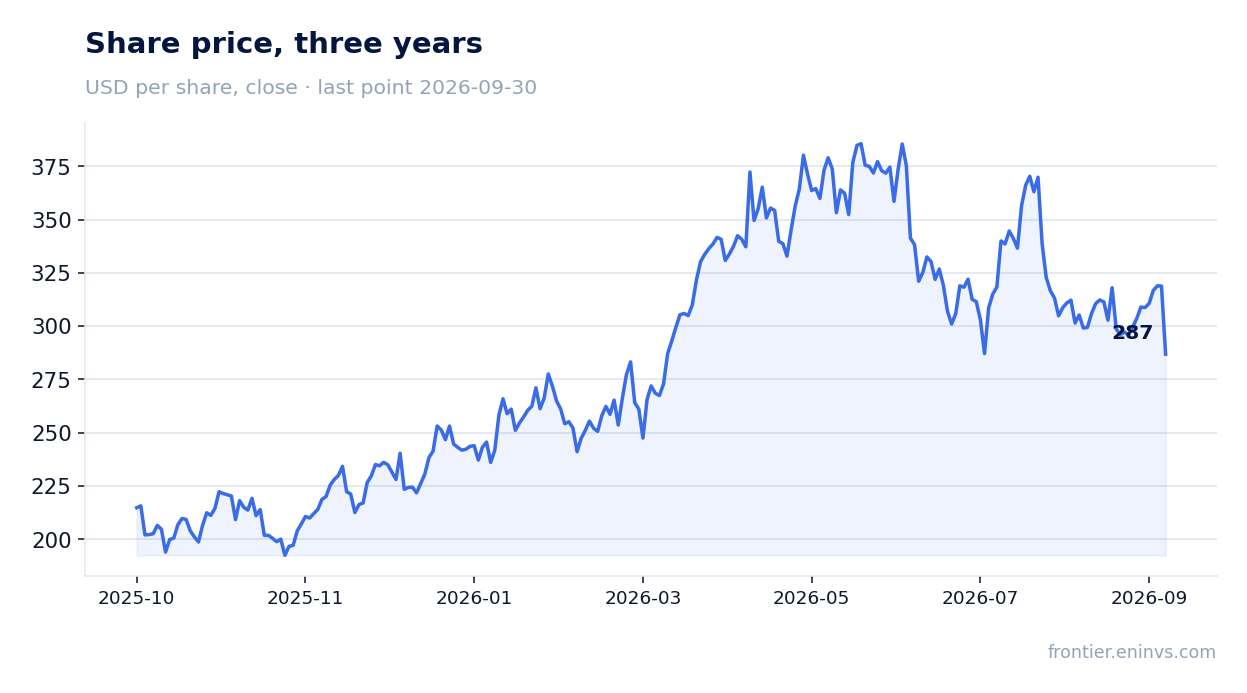
Our estimate of the dividend for the current year assumes the payout stays at around 3–4% of profit. With the company's guidance for core diluted EPS of $17.55 for fiscal 2027, that gives roughly $0.60–0.70 per share, which at the current price of about $287 (after the 10% fall) corresponds to a yield of about 0.2%. That is still insignificant.
The dividend is not a factor in JABIL INC's investment appeal. The company returns capital mainly through buybacks, which amounted to $1,060 million over the year. For an income-oriented investor this stock is unsuitable. For a growth-oriented investor, profit and cash flow dynamics matter more.
The portal's model puts the upside to fair value at +20%, the main counterweight to the market's caution
According to the portal's model, which compares EBITDA growth with a target multiple and market capitalisation, the upside to fair value is +20%. This is our own estimate, not a market consensus. It assumes the current price already reflects the growth deceleration but not a possible acceleration in fiscal 2027.
The company gave strong guidance for fiscal 2027: revenue of $44.5 billion, up 24%, core operating margin of 6.1%, core diluted EPS of $17.55, up 34%, and adjusted free cash flow of about $1.6 billion. If this guidance is met, the current EV/EBITDA multiple of 14.0 may prove justified despite the historical average of 7.8.
However, the market cut the price by 10% on the release day and by 10% from the release to September 30. This suggests investors expected more or took profits after a strong run. With the price at $318.84 before the release and a 10% fall, the current price is about $287. At that price the portal's model upside looks realistic but needs confirmation in the next quarter.
Valuation on the latest reported figures
| Metric | Value |
|---|---|
| Market cap | 30.8 bn USD |
| P/E (LTM) | 29.6 |
| EV/EBITDA (LTM) | 14.0 |
| P/B | 20.38 |
| Net debt / EBITDA (LTM) | 0.77 |
| ROE | 108.4% |
| Dividend yield (12m) | 0.1% |
| EV/EBITDA, 3-year average | 7.8 |
Bottom line
Bottom line: JABIL INC delivered a strong quarter with revenue of $10,616 million, operating profit of $602 million and net profit of $398 million, but growth decelerated to 11.8% year on year from 23.1% a quarter earlier. Profit was almost entirely earned rather than coming from one-off items, and cash flow for the year was $1,532 million. The key question for a holder is whether the company meets its fiscal 2027 guidance of $44.5 billion revenue and $17.55 EPS, since the current EV/EBITDA multiple of 14.0 is twice its own three-year average. At the price after the 10% fall the stock looks rather attractive: the portal's model gives +20% upside, but the 0.11% dividend yield adds no arguments.
Open the company's financial profile JBL →
See also: market overview · valuation map · stock screeners