JOHNSON & JOHNSON: revenue rose 5.9%, but quarterly profit almost vanished

On October 13, JOHNSON & JOHNSON reported third-quarter 2026 results. Revenue reached $25,399 million, up 5.9% year on year, but net profit collapsed to $210 million – a 95.9% drop from the same quarter last year. Net margin shrank to 0.8% from 21.5% a year earlier. Over the trailing twelve months, however, the company earned $16,095 million in net profit, and the EV/EBITDA LTM multiple of 18.8x is a quarter above its own three-year average. The share lost 5.7% after the release, and at the current level looks rather unattractive: the one-off profit collapse and the rich valuation outweigh steady revenue growth.
Key takeaways
— Revenue grew 5.9% year on year, but the pace slowed from 6.6% a quarter earlier
— Net profit collapsed 95.9% due to one-off write-offs the company does not disclose
— Net margin shrank to 0.8% from 21.5% a year earlier
— Over the trailing twelve months, profit reached $16,095 million, making the quarterly drop look temporary
— Debt load at 0.85x EBITDA LTM remains moderate, but the direction of change is unknown
— EV/EBITDA LTM of 18.8x is 25% above its own three-year average of 15.0x
— Dividend yield of 2.12% trailing 12m offers modest support against the high valuation
Attractiveness
Key figures, USD bn
| Metric | Q3 2025 | Q3 2026 | Change |
|---|---|---|---|
| Revenue | 24.0 | 25.4 | +5.9% |
| EBITDA | 9.27 | — | — |
| Operating profit | 7.49 | — | — |
| Net profit | 5.15 | 0.21 | -95.9% |
| Operating cash flow | 9.17 | — | — |
| Capex | 1.16 | — | — |
| EBITDA margin | 38.6% | — | — |
| Net margin | 21.5% | 0.8% | -20.7 pp |
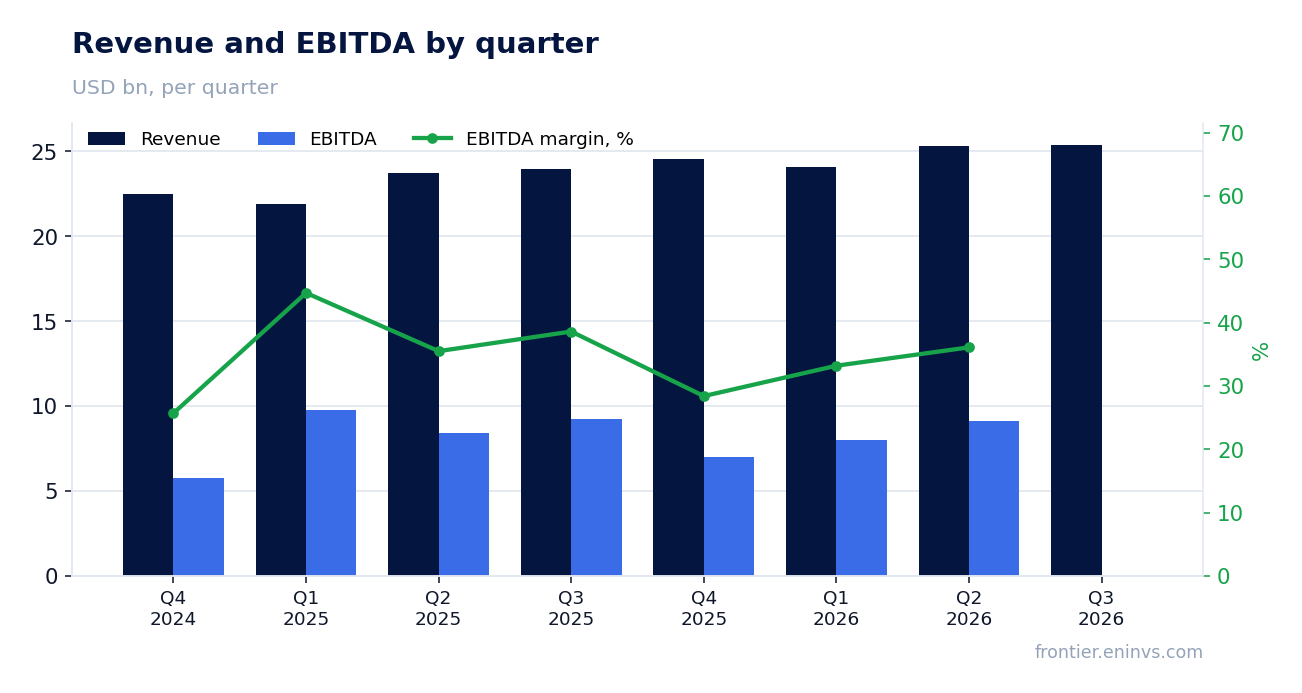
Revenue grew 5.9% year on year, but the pace slowed from 6.6% a quarter earlier
In the third quarter of 2026, JOHNSON & JOHNSON's revenue reached $25,399 million, up 5.9% from the same quarter last year. This is a deceleration from 6.6% growth in the second quarter of 2026. Nevertheless, the company continues to increase sales, and the quarterly result was the highest in several years.
The main contribution to growth likely came from the pharmaceutical and medical segments, but segment details are not available in the provided facts. The acceleration in revenue growth to 9.9% in the first quarter of 2026 gave way to more modest rates in the second and third quarters, which may reflect both a base effect and slowing demand in certain categories.
For investors, the sustainability of growth matters more than the fact of growth itself. The slowdown to 5.9% amid a high valuation warrants closer attention to the dynamics in the coming quarters.
Net profit collapsed 95.9% due to one-off write-offs the company does not disclose
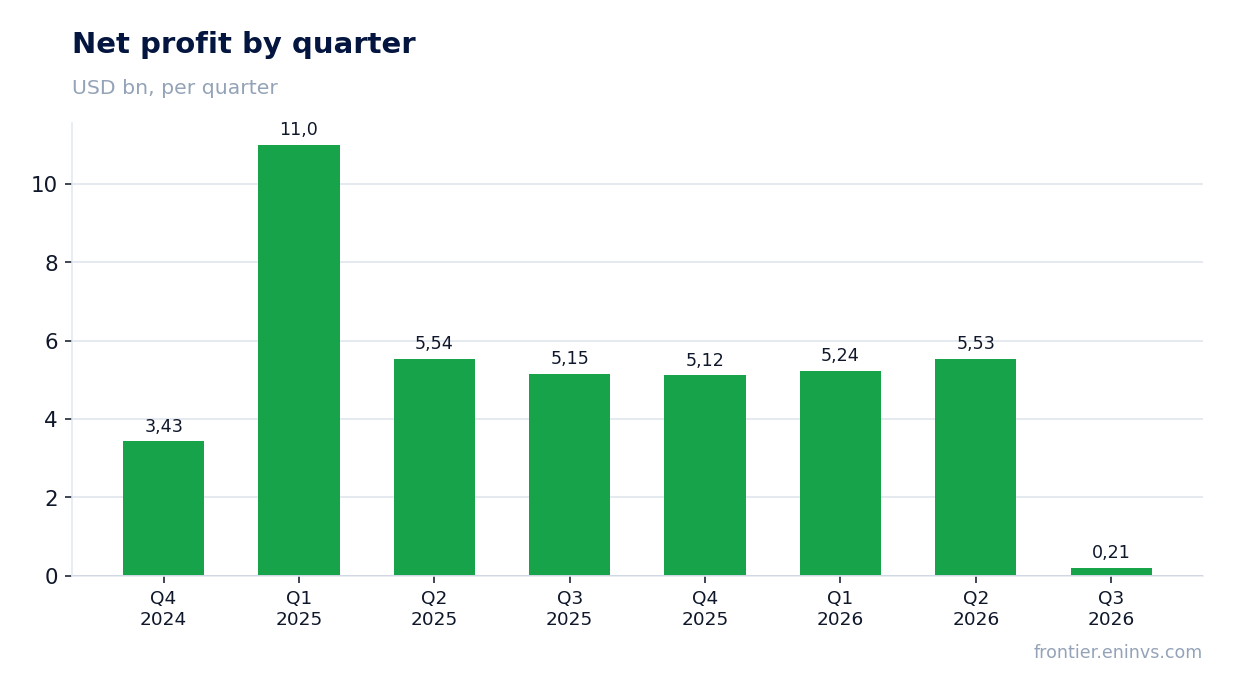
Net profit in the third quarter of 2026 was only $210 million, down 95.9% from a year earlier. For comparison: in the second quarter of 2026, profit was $5,534 million, and in the third quarter of 2025 – $5,152 million. Such a collapse cannot be explained by operational reasons alone.
Such a sharp drop is almost certainly related to large one-off write-offs or expenses that the company does not detail in the provided facts. This could be asset impairment, litigation costs, or restructuring. Without disclosure of the nature of these one-off items, it is impossible to assess how recurring they are.
Nevertheless, over the trailing twelve months, net profit amounted to $16,095 million, indicating that the quarterly plunge does not reflect fundamental unprofitability of the business. However, investors should await clarification from the company.
Net margin shrank to 0.8% from 21.5% a year earlier
Net margin in the third quarter of 2026 was 0.8%, compared to 21.5% a year earlier. This is a direct consequence of the profit collapse amid revenue growth. The margin drop of 20.7 percentage points is an extreme event for such a large and diversified company.
Such a low margin cannot be sustainable. Excluding one-off write-offs, the underlying profitability likely remains near historical levels. However, without data on the size of one-off items, we cannot state this with certainty.
For investors, it is important that even if profit recovers in the coming quarters, the current report creates uncertainty about future expenses. This may put pressure on the valuation until the situation is clarified.
Over the trailing twelve months, profit reached $16,095 million, making the quarterly drop look temporary
Cumulative net profit over the trailing twelve months (LTM) amounted to $16,095 million. This is a substantial figure showing that the business as a whole remains profitable. For comparison: revenue for the same period was $99,300 million, and EBITDA was $33,371 million.
Excluding the disastrous third quarter, profit in the previous three quarters was consistently above $5 billion. This suggests that the one-off factors are likely temporary. However, without confirmation from the company, it cannot be ruled out that some write-offs may recur.
Investors should monitor the recovery of quarterly profit in the next report. If it returns to levels above $5 billion, the current valuation may prove justified. Otherwise, pressure on the shares will persist.
Debt load at 0.85x EBITDA LTM remains moderate, but the direction of change is unknown
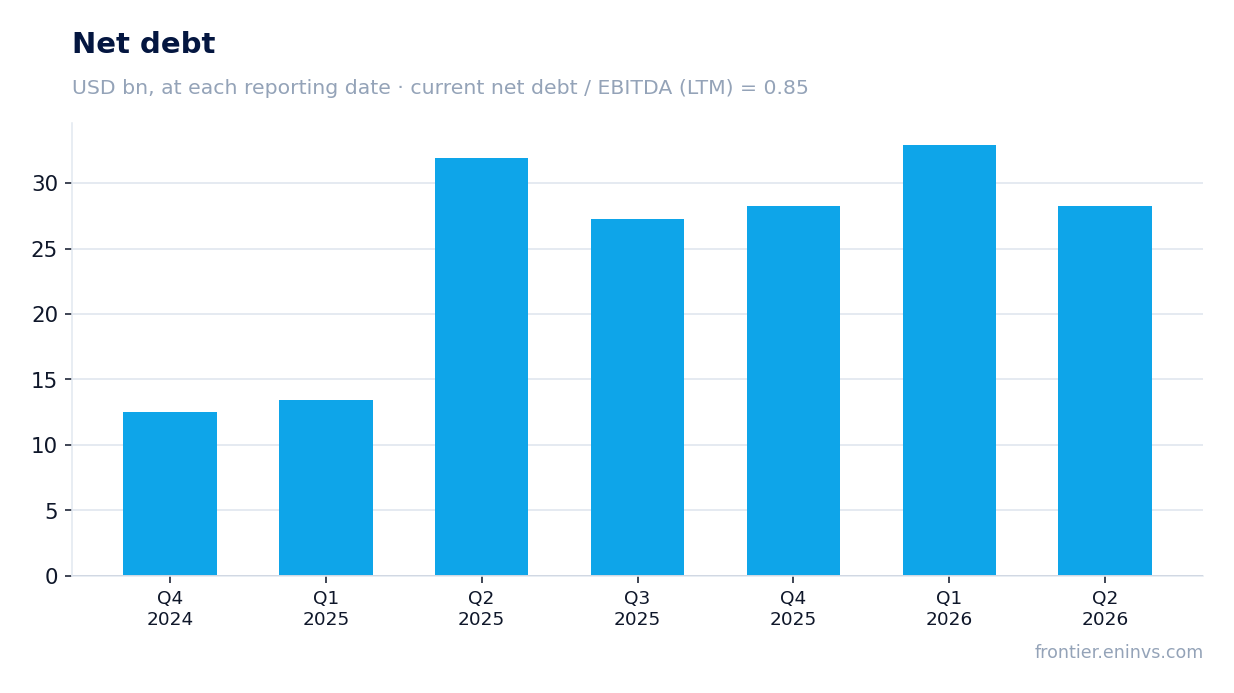
Net debt at the latest balance sheet date was $28,229 million, corresponding to a net debt to EBITDA LTM ratio of 0.85x. This is a moderate level for a company of this scale. However, the previous value of this ratio is not in the facts, so we cannot state whether the load is rising or falling.
The absolute amount of net debt fluctuates by quarter: for example, in the second quarter of 2026 it was $28,278 million, and in the first quarter of 2026 – $32,936 million. This may reflect seasonal cash movements, but without additional data we refrain from conclusions.
The moderate debt load gives the company room for manoeuvre, but it is not a driver for share growth in the short term.
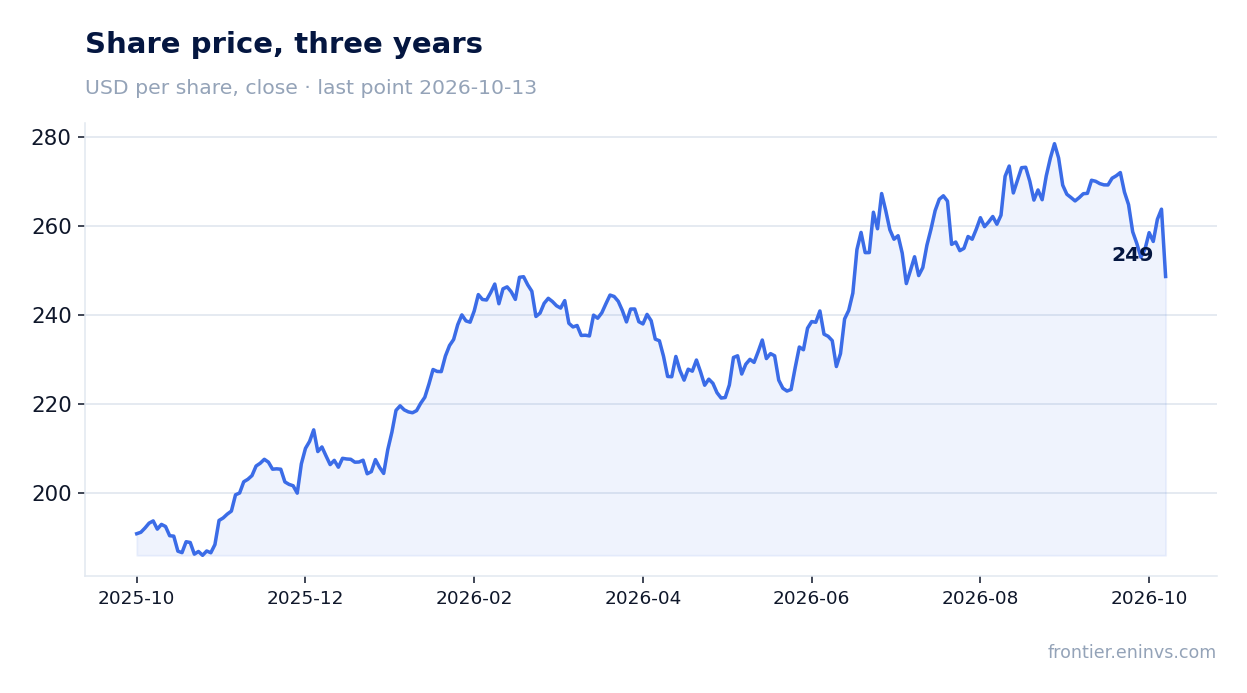
EV/EBITDA LTM of 18.8x is 25% above its own three-year average of 15.0x
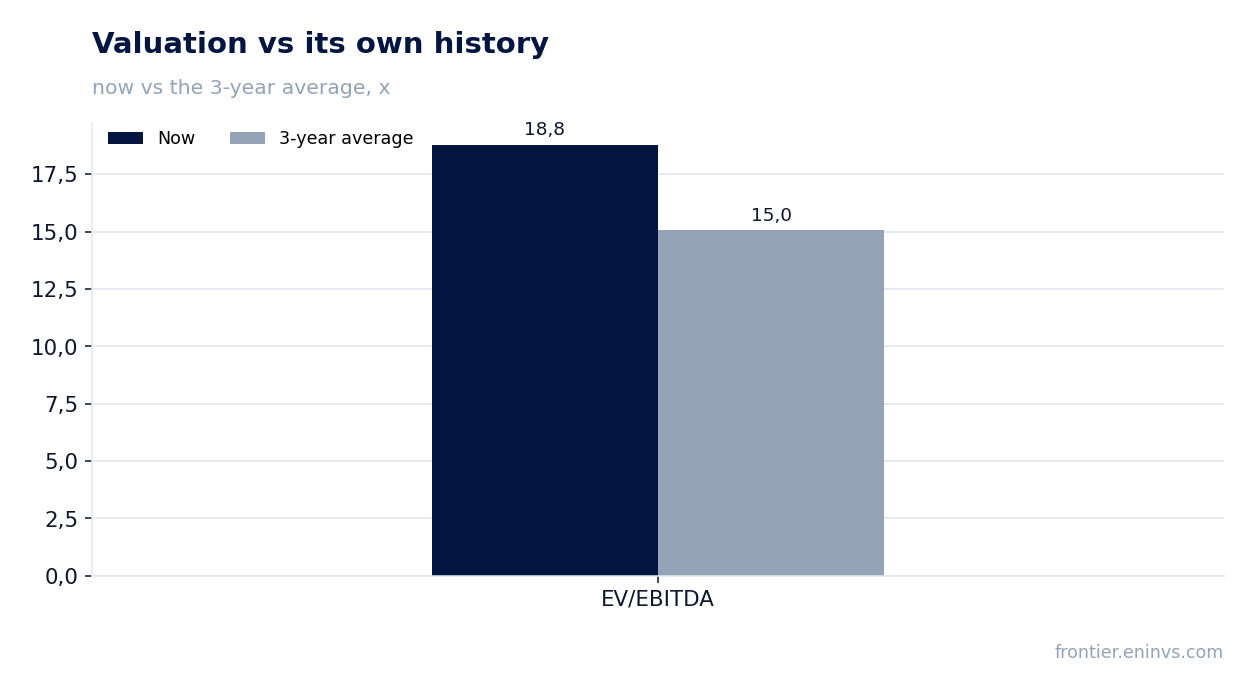
The EV/EBITDA LTM multiple is 18.8x, which is 25% above its own three-year average of 15.0x. This means the share is valued more expensively than usual relative to its history. For a company with slowing revenue growth and a one-off profit collapse, such a premium appears unjustified.
Other multiples also point to a high valuation: P/E LTM is 37.2, and the trailing 12m dividend yield is 2.12%. Market capitalisation stands at $598,638 million. Our own valuation model (the 'Usilennye Investitsii' portal) shows upside to fair value of only +9%, which limits attractiveness.
Comparison with its own history is the only correct benchmark in the absence of peer data. The current multiple level implies that investors are pricing in a rapid profit recovery. If this does not happen, a correction is possible.
Dividend yield of 2.12% trailing 12m offers modest support against the high valuation
The dividend yield over the trailing twelve months is 2.12%. This is a modest level that does not compensate for the risks associated with the high valuation and uncertainty over profit. For comparison: the yield on ten-year US Treasuries is not given in the facts, but the current yield is lower than many other dividend stories on the market.
The company does not disclose the size of the latest dividend and the year for which it was paid in the provided facts. Our estimate for the current year's dividend is absent due to lack of data. All we can say: with a payout ratio close to historical and LTM profit of $16,095 million, the dividend base remains sufficient.
What could make the payout smaller: further one-off write-offs reducing net profit, or rising capital expenditures. However, the facts do not include capital expenditure data for the third quarter of 2026, so we cannot assess their impact.
Valuation on the latest reported figures
| Metric | Value |
|---|---|
| Market cap | 599 bn USD |
| P/E (LTM) | 37.2 |
| EV/EBITDA (LTM) | 18.8 |
| P/B | 7.34 |
| Net debt / EBITDA (LTM) | 0.85 |
| ROE | 26.6% |
| Dividend yield (12m) | 2.1% |
| EV/EBITDA, 3-year average | 15.0 |
Bottom line
Bottom line: JOHNSON & JOHNSON reported third-quarter 2026 results with revenue growth of 5.9%, but net profit collapsed 95.9% due to one-off write-offs. Net margin shrank to 0.8%, an extreme event. Over the trailing twelve months, profit reached $16,095 million, and the business remains profitable, but uncertainty around one-off items weighs on the valuation. The EV/EBITDA LTM multiple of 18.8x is 25% above its own three-year average, and the dividend yield of 2.12% does not compensate for the risks. The share looks rather unattractive at the current level: an improvement would require a recovery in quarterly profit and clarification of the nature of the write-offs.
Open the company's financial profile JNJ →
See also: market overview · valuation map · stock screeners