LAM RESEARCH CORP: record $8.22bn revenue, yet the market met it with a 12.6% decline

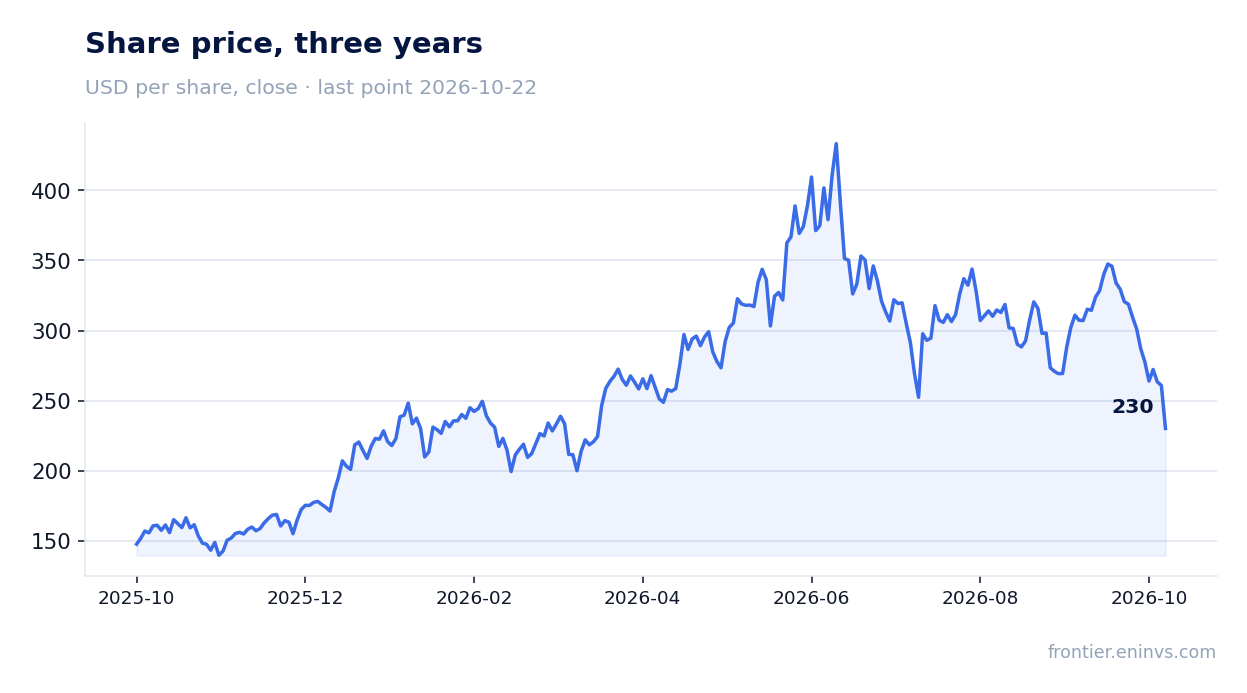
On 21 October LAM RESEARCH CORP reported results for the quarter ended 27 September 2026. Revenue reached $8,219.4m, EBITDA $3,405.8m and net income $2,753.1m; year on year revenue grew 54.4% and EBITDA 76.4%. The company ended the quarter with a net cash position of $3,705.4m and confirmed records for revenue, profit and earnings per share. Yet the share has lost 12.6% since the release, while the portal's model puts upside to fair value at +29% – the stock looks rather attractive, but only if the record margin holds.
Key takeaways
— Revenue grew 54.4% year on year to $8,219.4m, and almost all of the increase came from equipment shipments
— EBITDA margin rose to 41.4% from 36.3% a year earlier – gross margin added 190 basis points
— Net income of $2,753.1m grew 75.5%, but the tax rate came in below the usual level
— Operating cash flow of $3,497.7m against capex of just $257.7m – money barely goes into construction
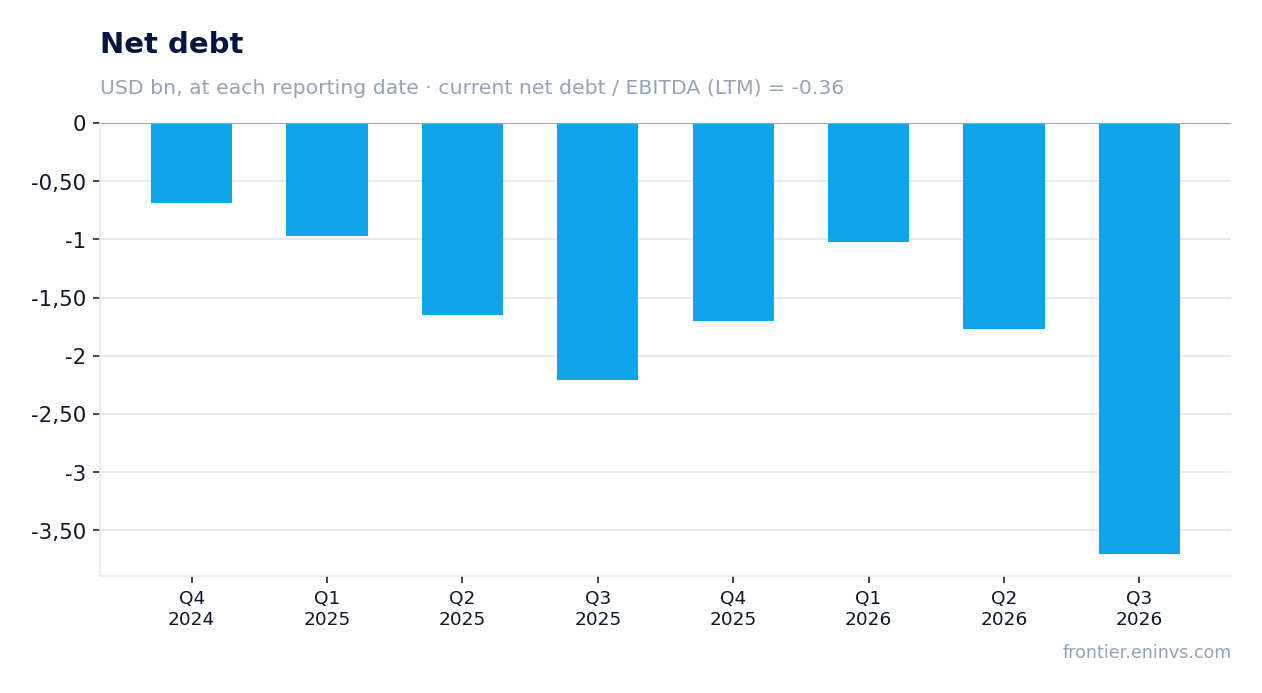
— Net cash rose from $1.8bn to $3.7bn over the quarter, and leverage is negative
— The dividend was raised to $0.33 per share, but a 0.48% yield does not offset the high valuation
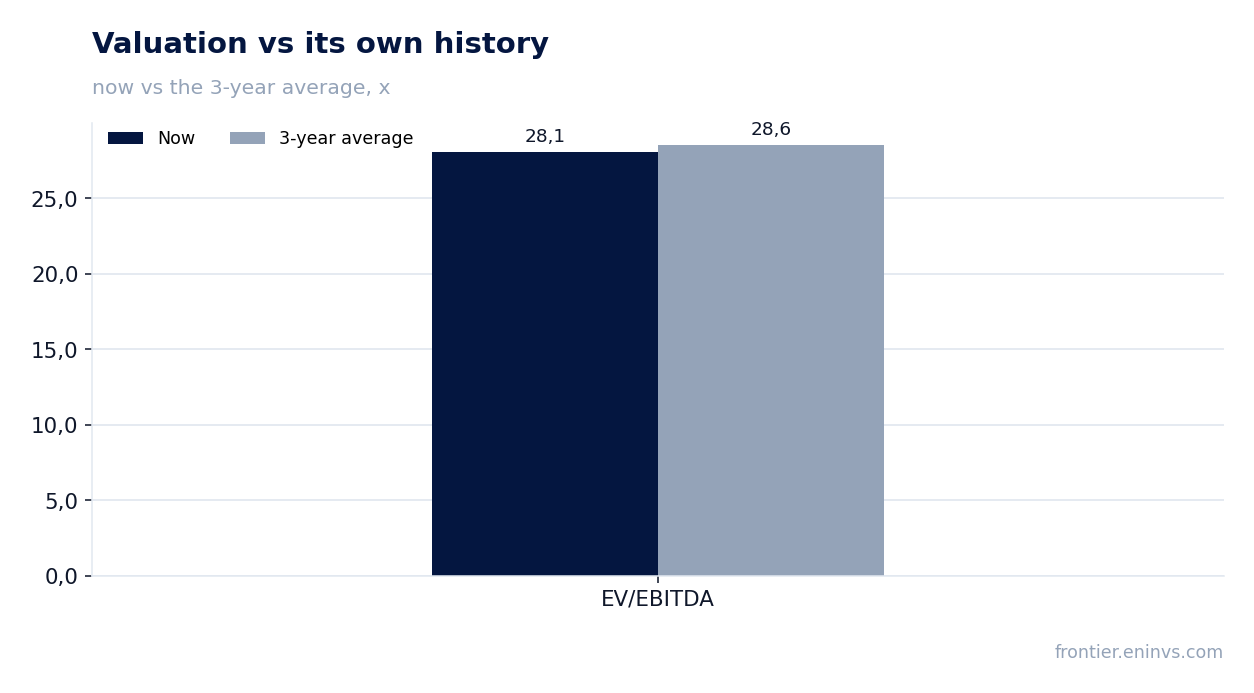
— EV/EBITDA of 28.1 sits in line with its own three-year average of 28.6, not above it
Attractiveness
Key figures, USD bn
| Metric | Q3 2025 | Q3 2026 | Change |
|---|---|---|---|
| Revenue | 5.32 | 8.22 | +54.4% |
| EBITDA | 1.93 | 3.41 | +76.4% |
| Operating profit | 1.83 | 3.28 | +79.5% |
| Net profit | 1.57 | 2.75 | +75.5% |
| Operating cash flow | 1.78 | 3.50 | +96.6% |
| Capex | 0.19 | 0.26 | +39.2% |
| EBITDA margin | 36.3% | 41.4% | +5.1 pp |
| Net margin | 29.5% | 33.5% | +4.0 pp |
Revenue grew 54.4% year on year to $8,219.4m, and almost all of the increase came from equipment shipments
Revenue for the quarter ended 27 September 2026 was $8,219.4m against $5,324.2m a year earlier – growth of 54.4%. It was a record quarter for the company, as CEO Tim Archer explicitly said.
Almost all of the increase came from systems: their sales reached $5,732.9m against $3,547.6m a year earlier. Customer support and other revenue grew more modestly, from $1,776.6m to $2,486.5m, roughly 40%.
The geography remains skewed to Asia: China accounted for 35% of revenue, Korea 20% and Taiwan 18%, while the US contributed only 8%. That concentration makes the result sensitive to export controls and regional cycles.
The quarterly sequence is uneven: after 54.4% growth in the first quarter of 2026, revenue fell 13.0% year on year in the second quarter of 2026 and then jumped 54.4% in the reported one. Growth has resumed, but it rests on large shipments rather than a smooth trajectory.
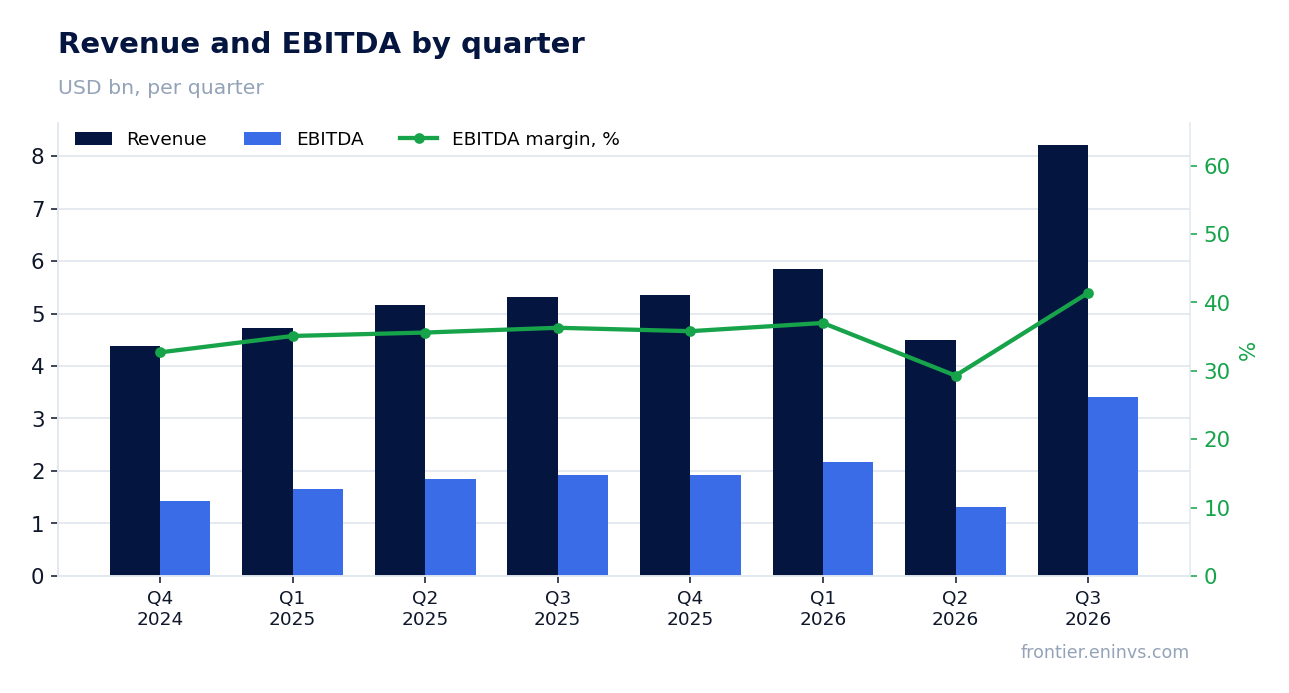
EBITDA margin rose to 41.4% from 36.3% a year earlier – gross margin added 190 basis points
EBITDA for the reported quarter was $3,405.8m, or 41.4% of revenue against 36.3% a year earlier. Operating profit reached $3,283.7m at a 40.0% operating margin.
The main source is gross margin: 52.3% against 50.4% a year earlier, up 190 basis points. Cost of goods sold grew slower than revenue, and that provided most of the profit increase.
Operating expenses rose to $1,015.1m from $855.8m, but their share of revenue fell. Research and development was $666.4m and selling, general and administrative $348.7m; the company is raising technology investment without losing margin.
A 41.4% margin is a record for the company. Holding it will be harder than posting it: for the December quarter the company guides to a 52.5% gross margin and a 40.5% operating margin, i.e. it expects the level to be maintained, not extended.
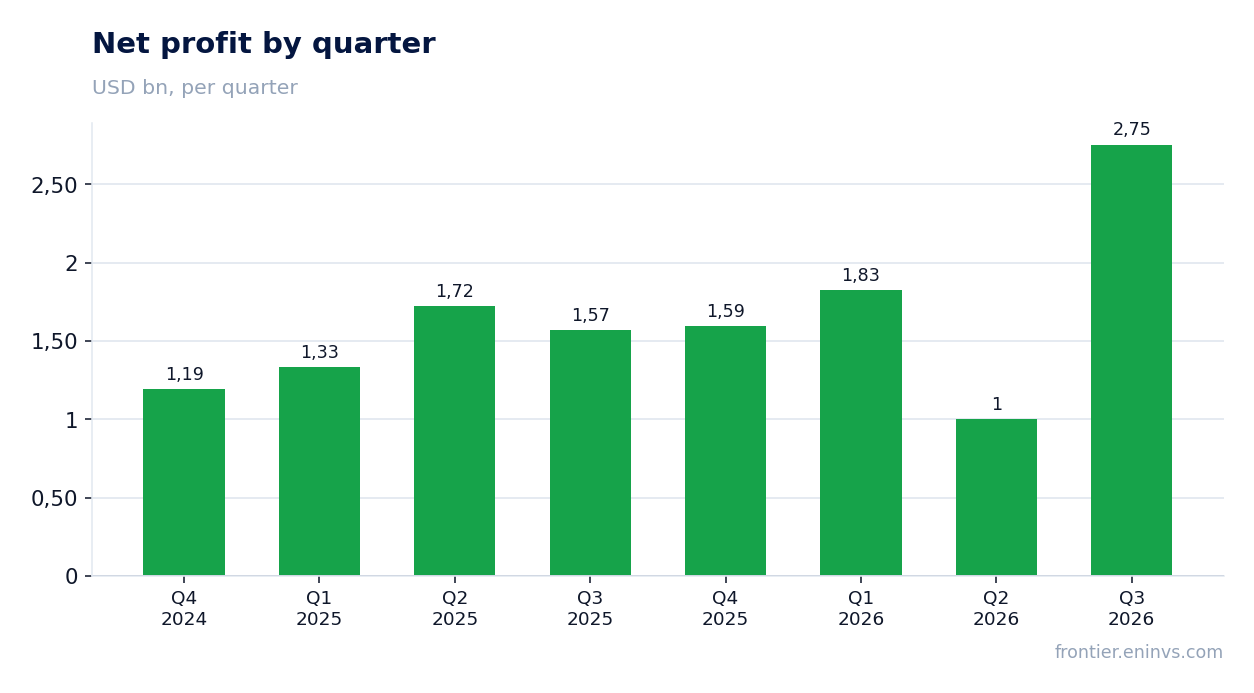
Net income of $2,753.1m grew 75.5%, but the tax rate came in below the usual level
Net income for the reported quarter was $2,753.1m against $1,568.7m a year earlier, up 75.5%. The net margin rose to 33.5% from 29.5%.
Diluted earnings per share were $2.19 against $1.24 a year earlier. The share count fell to 1,255.8m from 1,269.3m as the company bought back stock, which added to the per-share figure.
Income tax was $559.1m on pre-tax profit of $3,312.2m, an effective rate of about 16.9%. A year earlier the tax was $290.5m on pre-tax profit of $1,859.2m, a rate of about 15.6%. The gap is small, but it means part of the profit increase is not operational.
In the reported quarter the company booked a one-off tax charge of $11.5m from a change in tax law; the previous quarter included workforce optimisation charges. Both are small relative to profit, and adjusted earnings differ little from reported ones.
Operating cash flow of $3,497.7m against capex of just $257.7m – money barely goes into construction
Operating cash flow for the reported quarter was $3,497.7m against $1,779.0m a year earlier. Profit turned almost entirely into cash: the flow exceeds net income of $2,753.1m.
Capital expenditure was modest at $257.7m, or about 3% of revenue. Free cash flow therefore exceeds $3.2bn for the quarter, and it is what funds buybacks and dividends.
Buybacks absorbed $1,025.0m and dividends $325.4m. The remainder stayed on the balance sheet: cash and equivalents rose to $7,437.4m from $5,579.2m at the end of June.
Over the trailing twelve months operating cash flow was $7,576.3m. That is less than four times the quarterly result – earlier quarters were weaker, and the reported quarter stands out against them.
Net cash rose from $1.8bn to $3.7bn over the quarter, and leverage is negative
Net debt at 27 September 2026 was minus $3,705.4m – the company holds a net cash position. At 28 June 2026 the figure was minus $1,766.7m, so the cash cushion grew by $1,938.7m over the quarter.
Long-term debt and finance lease obligations were almost unchanged at $3,732.0m against $3,730.5m at the end of June. The entire increase in the cash position came from operating cash flow, not from new borrowing.
The ratio of net debt to trailing-twelve-month EBITDA is negative at minus 0.36. That is a level, not a direction: it cannot be compared with past values because they are not in the facts.
Over twelve months net debt moved from minus $2,209.1m on 28 September 2025 to minus $3,705.4m on 27 September 2026, so the cash position rose by $1,496.3m. The company is accumulating cash rather than spending it on debt.
The dividend was raised to $0.33 per share, but a 0.48% yield does not offset the high valuation
For the reported quarter the company declared a dividend of $0.33 per share against $0.26 a quarter earlier and a year earlier. The quarterly payout was $325.4m.
The trailing-twelve-month dividend yield is 0.48%. That is a small figure for a holder: the company prefers to return capital through buybacks, which absorbed $1,025.0m in the reported quarter – three times the dividend.
Our estimate: if the quarterly dividend of $0.33 is maintained, the annual payout will be about $1.32 per share. This is our estimate, not company guidance; it rests on the current rate and 1,249.1m shares outstanding.
A 0.48% yield is not comparable with money-market returns, and the dividend is not an argument for the stock. A profit decline or a large cash-consuming deal could cut the payout, but for now a $3.7bn net cash position allows it to be paid without strain.
EV/EBITDA of 28.1 sits in line with its own three-year average of 28.6, not above it
EV/EBITDA on a trailing-twelve-month basis is 28.1 against a three-year average of 28.6. The multiple is in line with its own history, about 2% below it, and the stock can be called neither cheap nor expensive relative to the past.
The trailing-twelve-month P/E is 34.1. With net income of $8,449.9m and a market capitalisation of $287,981.6m, the market pays roughly the same for earnings as for EBITDA – the ratio is close to one, typical for a company with low leverage.
On the portal's model the upside to fair value is +29%. This is our own calculation, not a market consensus or a target price; it rests on EBITDA growth and a target multiple.
Since the release the share has lost 12.6%, and 1.0% on the release day itself. The market met record results with selling, and that gap between fundamentals and price is the main question for a holder.
Valuation on the latest reported figures
| Metric | Value |
|---|---|
| Market cap | 288 bn USD |
| P/E (LTM) | 34.1 |
| EV/EBITDA (LTM) | 28.1 |
| P/B | 23.09 |
| Net debt / EBITDA (LTM) | -0.36 |
| Operating cash flow (LTM) | 7.58 bn |
| ROE | 83.5% |
| Dividend yield (12m) | 0.5% |
| EV/EBITDA, 3-year average | 28.6 |
Bottom line
The quarter was exceptionally strong: record revenue of $8,219.4m, EBITDA of $3,405.8m and net income of $2,753.1m, a 41.4% margin and a $3,705.4m net cash position. The money is real – operating cash flow of $3,497.7m against capex of $257.7m, returned through $1,025.0m of buybacks. The question is not the quality of the report but whether the record margin holds: guidance for the December quarter assumes it is maintained, not extended. An EV/EBITDA of 28.1 in line with its own history and +29% upside on the portal's model outweigh the thin 0.48% dividend yield. The verdict is rather attractive, provided AI equipment demand does not reverse.
Open the company's financial profile LRCX →
See also: market overview · valuation map · stock screeners