Mastercard Inc: revenue up 14%, but almost all profit already goes back to shareholders

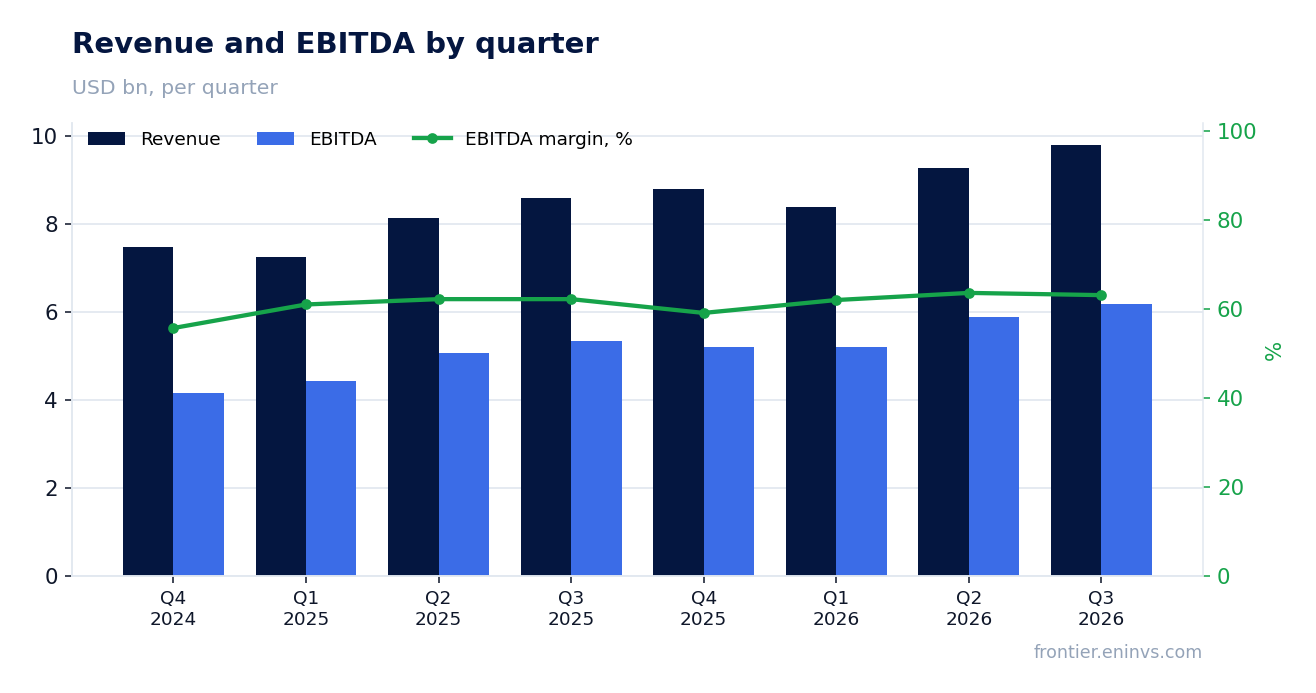
On 29 October Mastercard Inc reported third-quarter 2026 results. Revenue came in at USD 9,807 mn, up 14.0% year on year, net income at USD 4,628 mn, or +17.9%, and EBITDA at USD 6,188 mn with a 63.1% margin. The revenue growth rate was roughly the same pace as in the second quarter (+14.1%), while profit grew faster than revenue on a lower tax rate and faster-growing value-added services. At an EV/EBITDA of 25.9 against its own three-year average of 27.1 and a portal-model upside of +10%, the share looks rather attractive, though the thin 0.55% dividend yield limits the case.
Key takeaways
— Revenue added 14.0% – roughly the same pace, carried by services rather than the payment network
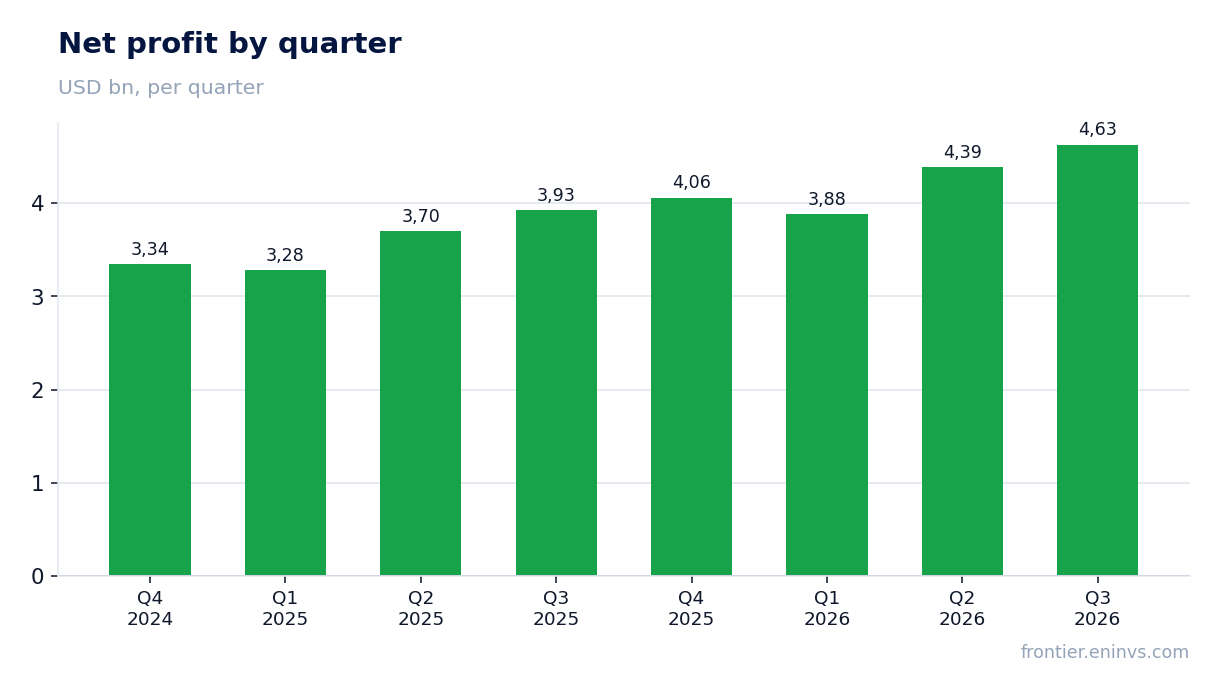
— Profit grew 17.9%, faster than revenue, and the tax rate did most of the work
— EBITDA margin rose to 63.1% as operating expenses grew only 11%
— Debt rose to USD 13.8 bn, but at LTM EBITDA of 22.3 bn that is 0.62 – a moderate level
— Quarterly free cash flow covers both the dividend and the buyback
— The 0.55% dividend yield is thin – the payout is small and most of the return comes via buybacks
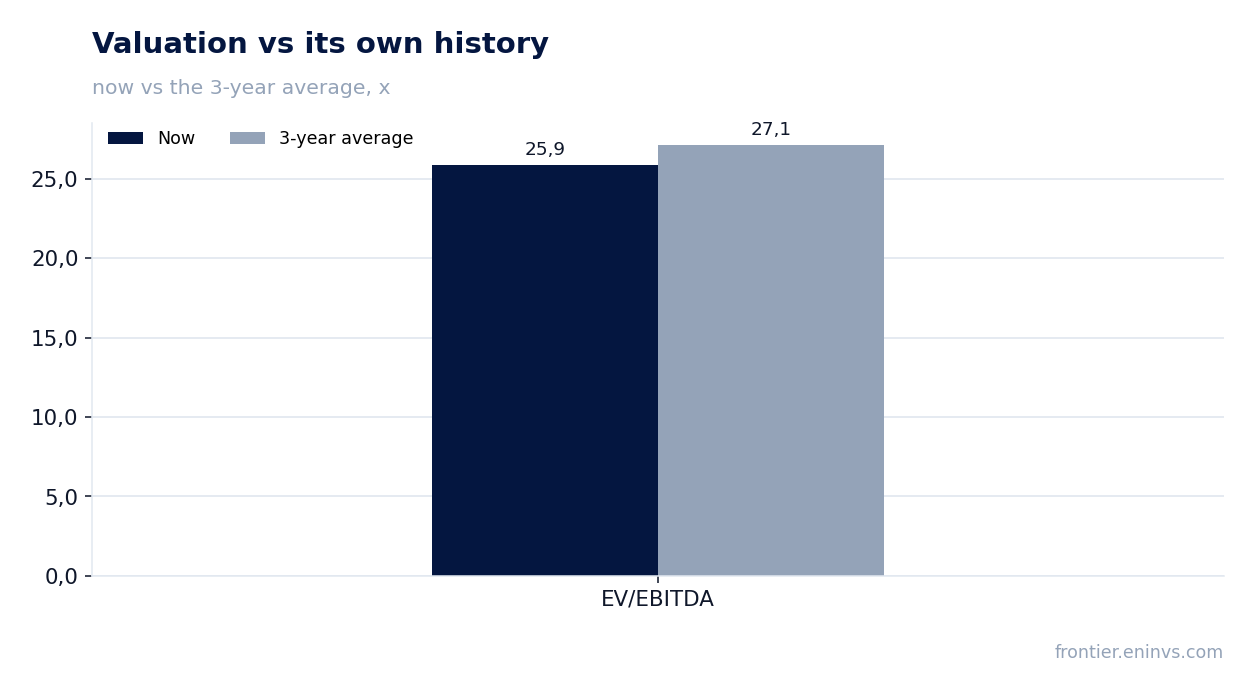
— EV/EBITDA of 25.9 is below its own three-year average of 27.1, and the portal model implies +10% upside
Attractiveness
Key figures, USD bn
| Metric | Q3 2025 | Q3 2026 | Change |
|---|---|---|---|
| Revenue | 8.60 | 9.81 | +14.0% |
| EBITDA | 5.35 | 6.19 | +15.6% |
| Operating profit | 5.06 | 5.86 | +15.8% |
| Net profit | 3.93 | 4.63 | +17.9% |
| Operating cash flow | 5.66 | 5.09 | -10.2% |
| Capex | 0.18 | 0.22 | +24.7% |
| EBITDA margin | 62.2% | 63.1% | +0.9 pp |
| Net margin | 45.7% | 47.2% | +1.5 pp |
Revenue added 14.0% – roughly the same pace, carried by services rather than the payment network
Third-quarter revenue was USD 9,807 mn, up 14.0% year on year. In the second quarter growth was 14.1%, so the pace was roughly unchanged. The company notes the increase was the same in dollars and on a currency-neutral basis.
Within revenue, the payment network grew 11% while value-added services and solutions grew 19%. The network lags because rebates and incentives to customers rose 18%, eating into volume growth. Local-currency gross dollar volume rose 7%, cross-border volume 11% and switched transactions 9%.
Services have been outgrowing the network for several quarters and now set the overall pace. As long as they hold double-digit growth, revenue can outpace payment volumes.
Profit grew 17.9%, faster than revenue, and the tax rate did most of the work
Quarterly net income was USD 4,628 mn, up 17.9% year on year. Operating profit rose 15.6% to 5,862 mn, slightly slower than net income. The gap comes from the effective tax rate falling to 19.4% from 21.5% a year earlier – the company attributes this to higher discrete tax benefits.
Adjusted net income, which the company reports separately, was 4,653 mn, or USD 5.31 per share versus 4.38 a year earlier. The gap to GAAP is small: the quarter included USD 74 mn of litigation settlements with merchants and a USD 5 mn loss on equity investments.
So a good part of the profit growth came from taxes rather than operating leverage. That matters: if the rate normalises, profit should grow roughly in line with operating profit.
EBITDA margin rose to 63.1% as operating expenses grew only 11%
Quarterly EBITDA was USD 6,188 mn at a 63.1% margin versus 62.2% a year earlier. Operating expenses rose 11% to 3,945 mn, slower than revenue. General and administrative costs drove the increase – 3,293 mn versus 2,923 mn a year earlier.
Advertising and marketing were almost flat at 252 mn, while depreciation rose to 326 mn. Litigation provisions fell to 74 mn from 83 mn. The adjusted operating margin was 60.5% versus 59.8% a year earlier.
The margin is expanding, but room for further gains is limited: administrative costs are the largest line and grow with the business. Margin resilience will depend on keeping expense growth below revenue growth.
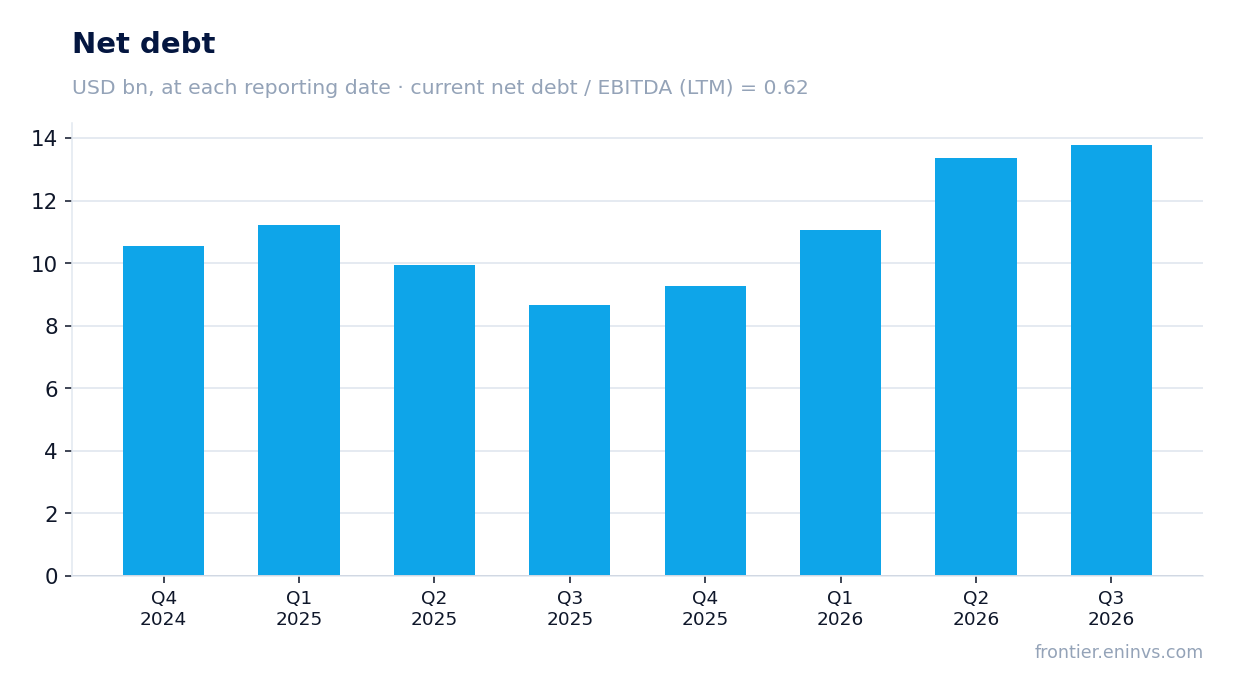
Debt rose to USD 13.8 bn, but at LTM EBITDA of 22.3 bn that is 0.62 – a moderate level
Net debt at 30 September 2026 was USD 13,791 mn versus 8,670 mn at 30 September 2025, up 5.1 bn over the year. Over the quarter it rose from 13,352 mn at 30 June to 13,791 mn. The increase reflects debt issuance: the company raised 5,596 mn over nine months and spent 1,372 mn on an acquisition.
At LTM EBITDA of 22,322 mn, net debt to EBITDA is 0.62. That is a moderate level for a company with this margin and stable cash flow. Quarterly interest expense was 250 mn versus 186 mn a year earlier – the higher debt is already visible in the income statement.
Leverage does not look like a problem, but its direction is worth watching: the company is buying back stock and paying dividends, partly funding this with debt.
Quarterly free cash flow covers both the dividend and the buyback
Third-quarter operating cash flow was USD 5,087 mn and capital expenditure 222 mn, implying free cash flow of about 4,865 mn. Over nine months operating cash flow was 11,859 mn, below last year's 12,646 mn, mainly on higher prepaid expenses and working-capital changes.
In the quarter the company repurchased 5.3 mn shares for 3.0 bn and paid 763 mn in dividends. Together that is 3.8 bn, less than quarterly free cash flow. From early October to 26 October it bought another 1.1 mn shares for 0.6 bn, leaving 4.9 bn under the programme.
Cash flow still covers capital returns, but it is down year on year. If working capital keeps weighing, the company may slow the buyback or borrow more.
The 0.55% dividend yield is thin – the payout is small and most of the return comes via buybacks
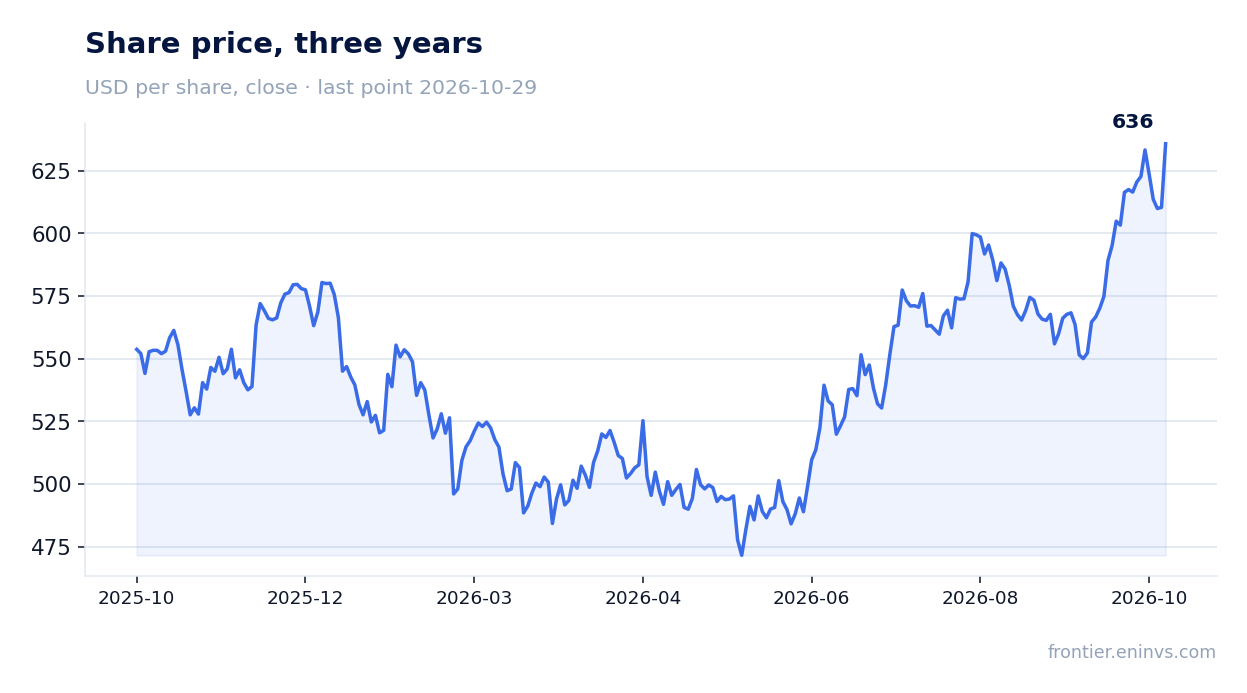
In the third quarter Mastercard Inc paid USD 763 mn in dividends. With a market cap of 568.3 bn and a share price around 610, the trailing twelve-month dividend yield is 0.55%. That is modest against the yield we would consider fair for a mature financial company – but the payout is low by design.
Most capital return comes through buybacks: 3.0 bn in the quarter, four times the dividend. The company is steadily shrinking its share count – from 903 mn to 875 mn over the year – which supports earnings per share.
Our estimate for this year's dividend is growth of about 10–15%, with the payout held near 20% of profit. That hinges on profit holding at the current level and the buyback not demanding more cash than the business generates. If free cash flow keeps falling, the dividend may grow more slowly.
EV/EBITDA of 25.9 is below its own three-year average of 27.1, and the portal model implies +10% upside
On trailing twelve-month EV/EBITDA the share trades at 25.9 against its own three-year average of 27.1. That is 5% below its historical level, so the valuation sits within its usual range but nearer the low end. The trailing P/E is 33.5.
Our fundamental value-creation model, which sets EBITDA growth against the target multiple and market cap, implies upside to fair value of +10%. This is our own estimate, not a market consensus.
The share added 4.2% after the report and has held that level since. The market reaction suggests results met expectations but held no surprise. Further gains need either faster services growth or a return of the margin to higher levels.
Valuation on the latest reported figures
| Metric | Value |
|---|---|
| Market cap | 568 bn USD |
| P/E (LTM) | 33.5 |
| EV/EBITDA (LTM) | 25.9 |
| Net debt / EBITDA (LTM) | 0.62 |
| Operating cash flow (LTM) | 16.9 bn |
| ROE | 214.7% |
| Dividend yield (12m) | 0.5% |
| EV/EBITDA, 3-year average | 27.1 |
Bottom line
The quarter was strong: revenue rose 14.0%, profit 17.9%, and the EBITDA margin reached 63.1%. But part of the profit growth came from taxes rather than operating leverage, which is worth keeping in mind. Debt rose to 13.8 bn, though at LTM EBITDA of 22.3 bn the load remains moderate at 0.62. The 0.55% dividend yield is thin, with most capital returned via buybacks. At an EV/EBITDA of 25.9 against its own three-year average of 27.1, and with the portal model implying +10% upside, the share looks rather attractive, but without a margin of safety: a re-rating higher needs sustained services and margin growth, while a lower tax rate and further debt growth would argue the other way.
Open the company's financial profile MA →
See also: market overview · valuation map · stock screeners