Procter & Gamble: revenue accelerated to 7.4%, but profit is flat year on year

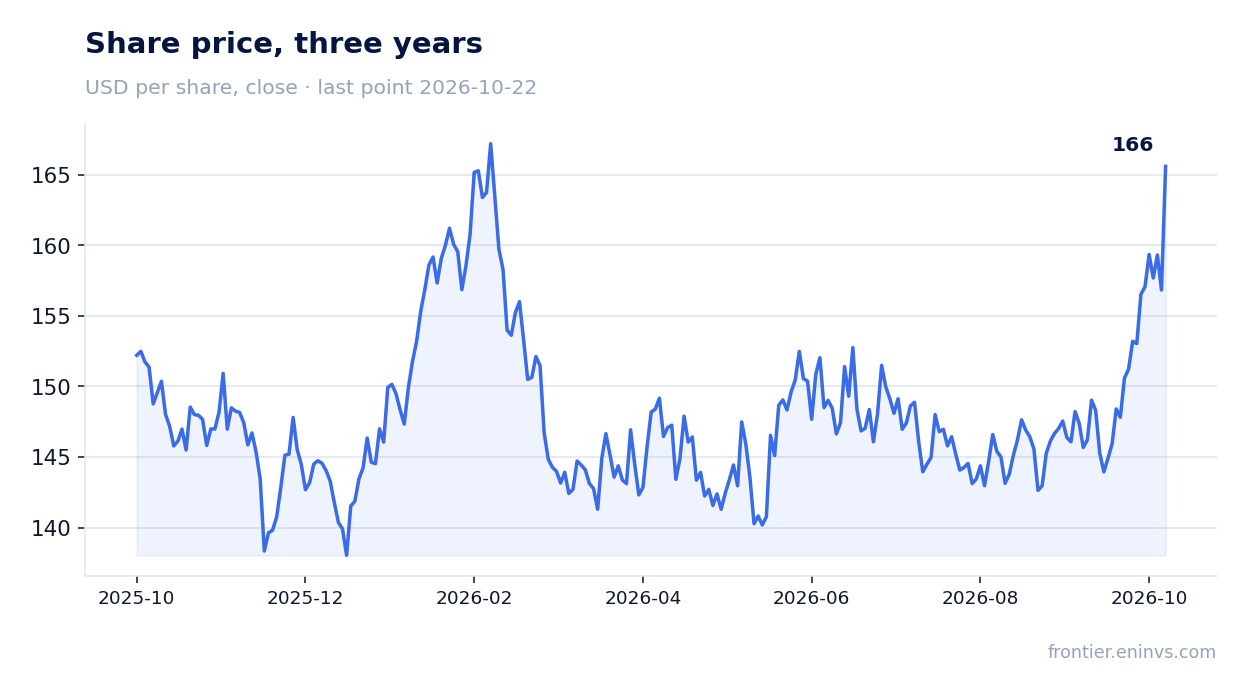
On 22 October, Procter & Gamble reported results for the first quarter of fiscal 2027. Revenue reached $23.3 billion, organic sales grew 4.0%, net profit was $4.7 billion, and core EPS added 1%. Gross margin fell 160 basis points on higher commodity costs and reinvestments, while EBITDA grew only 2.0%. The stock rose 5.6% on the release day, but with EV/EBITDA at 17.7 versus its own three-year average of 17.3 and a modest 2.6% dividend yield, the share looks fairly valued rather than cheap.
Key takeaways
— Revenue accelerated to 7.4% year on year, and volume rather than price drove almost all of the growth
— Gross margin lost 160 basis points as commodities and reinvestments outweighed productivity savings
— Net profit was flat year on year, while one-off restructuring added $98 million to operating profit
— Free cash flow of $4.4 billion covered $2.6 billion of dividends but not $1.3 billion of buybacks
— Leverage at 1.02x LTM EBITDA remains moderate, and net debt fell $1.2 billion over the year
— A 2.6% dividend yield is modest for a defensive name, and payout growth is capped by earnings
— EV/EBITDA at 17.7 is in line with its own three-year average of 17.3, and the portal model implies only 4% upside
Attractiveness
Key figures, USD bn
| Metric | Q3 2025 | Q3 2026 | Change |
|---|---|---|---|
| Revenue | 22.4 | 23.3 | +4.0% |
| EBITDA | 6.62 | 6.75 | +2.0% |
| Operating profit | 5.86 | 5.94 | +1.4% |
| Net profit | 4.75 | 4.73 | -0.4% |
| Operating cash flow | 5.41 | 5.77 | +6.6% |
| Capex | 1.20 | 1.37 | +13.8% |
| EBITDA margin | 29.6% | 29.0% | -0.6 pp |
| Net margin | 21.2% | 20.3% | -0.9 pp |
Revenue accelerated to 7.4% year on year, and volume rather than price drove almost all of the growth
In the first quarter of fiscal 2027, revenue reached $23.3 billion, up 4.0% from a year earlier. Organic sales grew by the same 4.0%: volume added 2.4%, favourable mix contributed 1.1%, and pricing added only 0.4%. This means growth is driven by real demand rather than price increases.
Compared with the previous quarter, when growth was 1.5%, the pace accelerated to 7.4% in the reported quarter. The acceleration came primarily from Beauty, where sales rose 6.4%, and Fabric & Home Care, up 4.2%. Grooming and Health Care showed more modest growth of 4.0% and 3.1%, respectively.
Weak spots are also visible: in Health Care, volume fell 2.9%, with growth carried by price and mix. In Grooming, volume declined 0.4%. This suggests that in some categories consumers are trading down or cutting consumption.
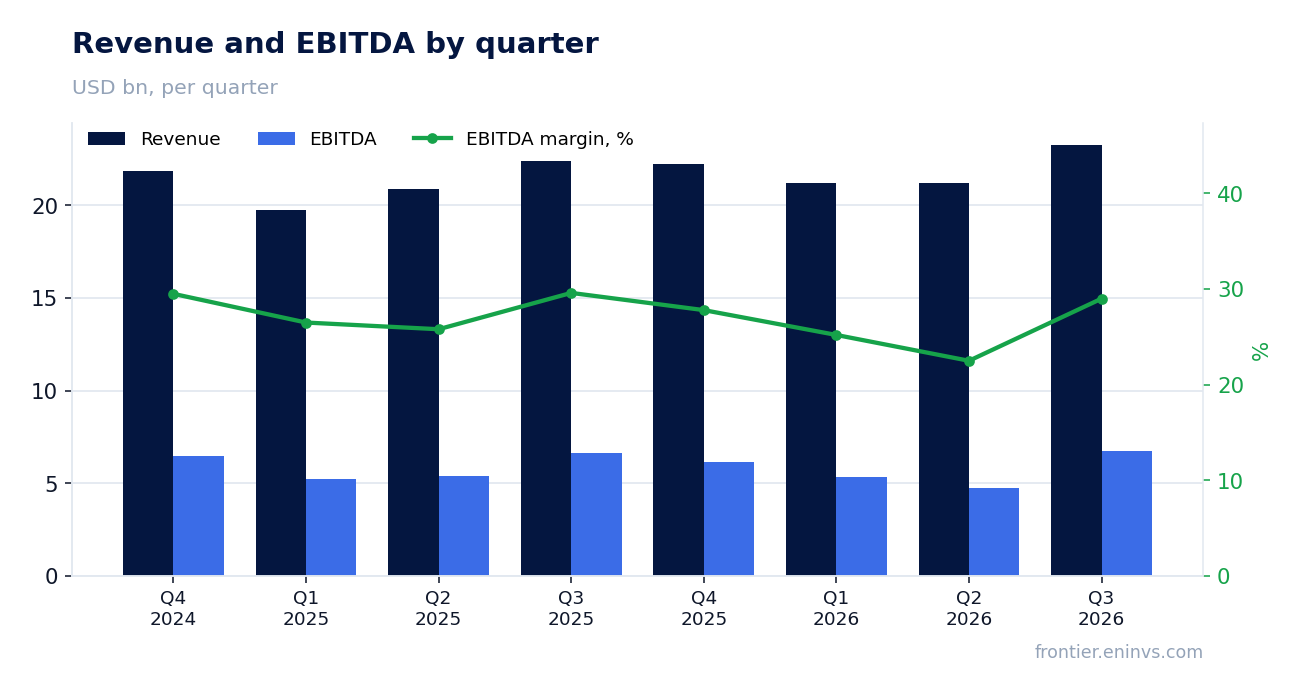
Gross margin lost 160 basis points as commodities and reinvestments outweighed productivity savings
Gross margin in the reported quarter was 49.8% versus 51.4% a year earlier – a decline of 160 basis points. The main drivers: higher commodity, energy and transportation costs added 140 basis points of pressure, product reinvestments another 140, and unfavourable mix 50. These losses were only partly offset by 120 basis points of productivity savings and a 50 basis point reduction in tariff costs.
Operating margin fell 70 basis points to 25.5%. Core operating margin dropped 80 basis points to 25.9%. Falling margins alongside revenue growth mean the company cannot fully pass cost increases on to consumers.
EBITDA for the reported quarter was $6.7 billion, up only 2.0% year on year, while revenue grew 4.0%. EBITDA margin declined to 29.0% from 29.6%. This is the key gap: revenue is growing faster than profit.
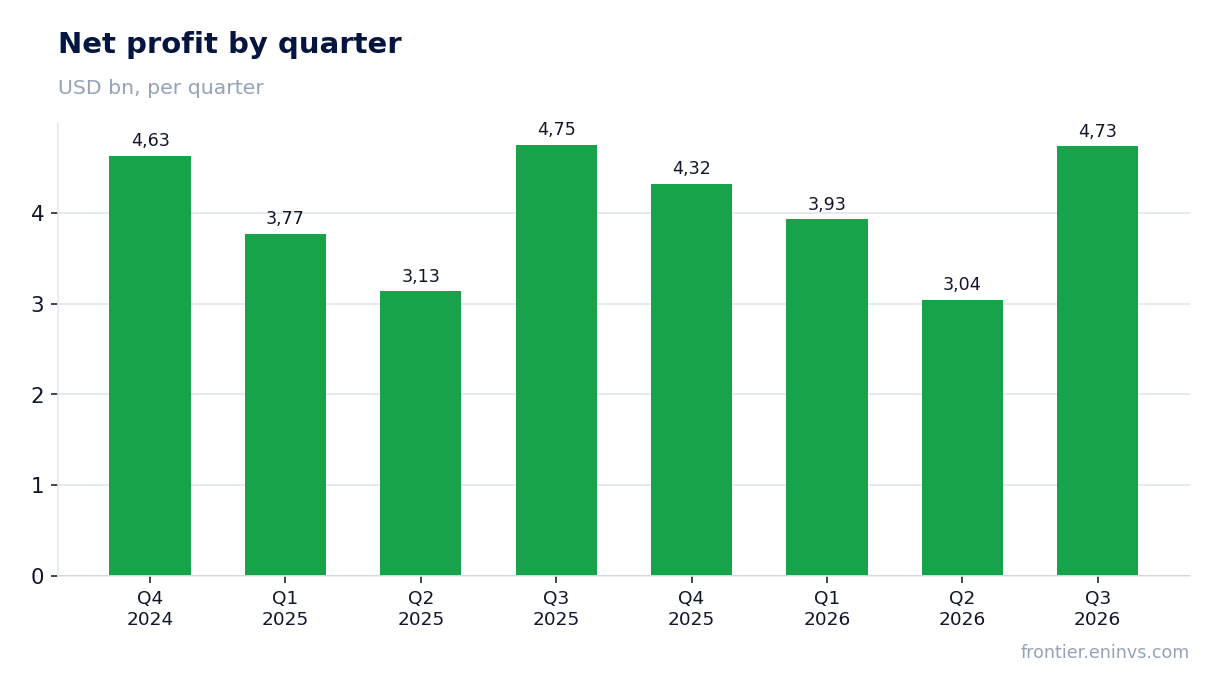
Net profit was flat year on year, while one-off restructuring added $98 million to operating profit
Net profit attributable to shareholders was $4.7 billion, down 0.4% from a year earlier. Diluted EPS rose 1% to $1.97 on a lower share count. Core EPS was $2.00, also up 1%.
In the reported quarter, the company recorded $98 million of restructuring charges, which were excluded from core figures. Without this adjustment, operating profit would have been lower. The restructuring programme announced in June 2025 envisages about $2 billion of costs over two years, and more than half has already been incurred in fiscal 2026.
Net profit growth is constrained not only by margin but also by higher interest expense: it rose 13% to $223 million due to higher debt. Interest income fell 6%. This adds further pressure on earnings.
Free cash flow of $4.4 billion covered $2.6 billion of dividends but not $1.3 billion of buybacks
Operating cash flow for the reported quarter was $5.8 billion, capital expenditure – $1.4 billion. Free cash flow reached $4.4 billion, and free cash flow productivity – 93%. This is below the target range of 85–90%, but still above the lower bound.
The company returned $3.9 billion to shareholders: $2.6 billion in dividends and $1.3 billion through buybacks. Free cash flow covered dividends but not the full amount of buybacks. The gap was financed by an increase in short-term debt: net short-term borrowings amounted to $5.8 billion.
Capital expenditure of $1.4 billion represents about 5.9% of revenue, in line with the company's full-year guidance of 4.5–5.5% of sales. This means the investment programme remains within plan.
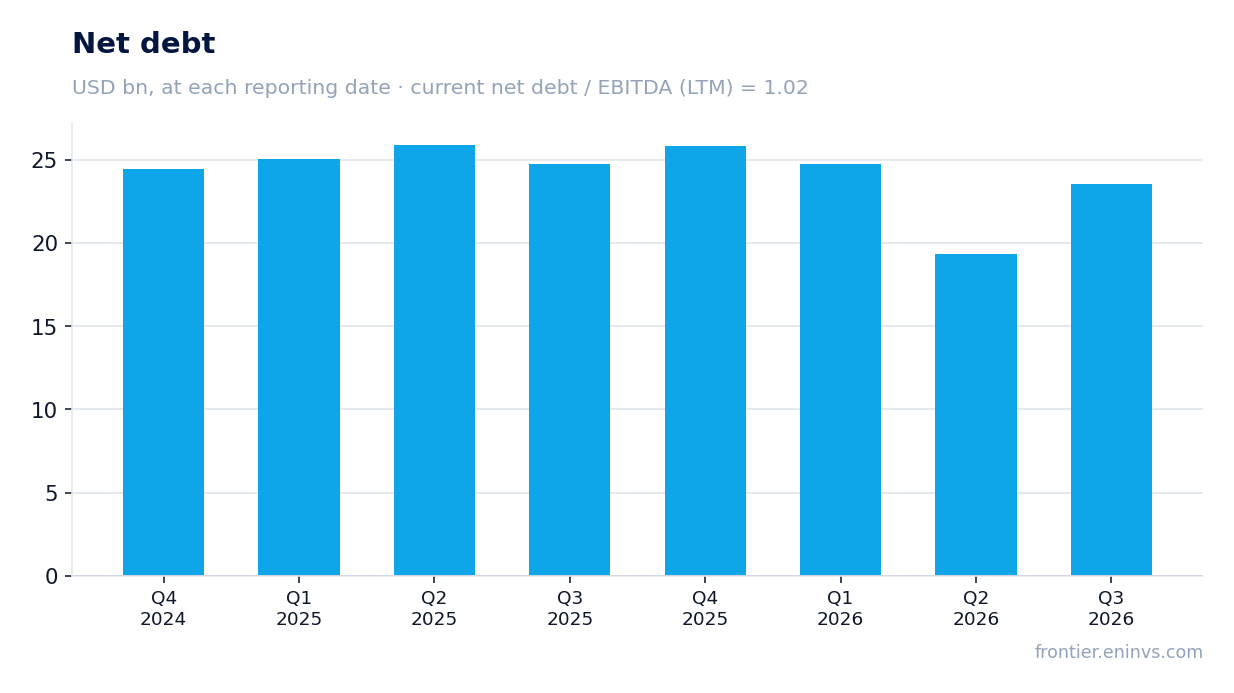
Leverage at 1.02x LTM EBITDA remains moderate, and net debt fell $1.2 billion over the year
Net debt as of 30 September 2026 was $23.6 billion, up from $19.4 billion on 30 June 2026 by $4.2 billion. Over the year, net debt declined from $24.8 billion on 30 September 2025 by $1.2 billion. The ratio of net debt to LTM EBITDA is 1.02, which remains a comfortable level.
The quarterly increase in debt is due to a seasonal rise in short-term borrowings: debt due within one year rose to $17.0 billion from $11.3 billion at the end of June. The long-term portion declined to $21.9 billion from $22.8 billion. The company actively uses short-term financing to cover working capital and buybacks.
Interest expense rose 13% to $223 million due to higher debt and higher rates. With leverage at 1.02x EBITDA, the company retains the ability to service debt and grow dividends, but rising interest costs are becoming a noticeable factor.
A 2.6% dividend yield is modest for a defensive name, and payout growth is capped by earnings
Over the last 12 months, the company paid dividends with a yield of 2.6% on the current price. In the reported quarter, the dividend per share was $1.0885 versus $1.0568 a year earlier – up 3%. The company confirmed its intention to pay over $10 billion in dividends in fiscal 2027 and repurchase $5 billion of shares.
Our estimate for the fiscal 2027 dividend is about $4.4 per share, based on the current quarterly pace and expected earnings growth. This implies a yield of about 2.8% on the current price. However, earnings growth is constrained: core EPS is expected to grow only 0–3% for the year, and net profit declined in the reported quarter.
The dividend is covered by free cash flow, but the payout ratio is high: $2.6 billion of dividends against $4.4 billion of free cash flow for the quarter. If margin pressure persists, dividend growth may slow. The key risk is a further decline in profit due to commodity costs and restructuring.
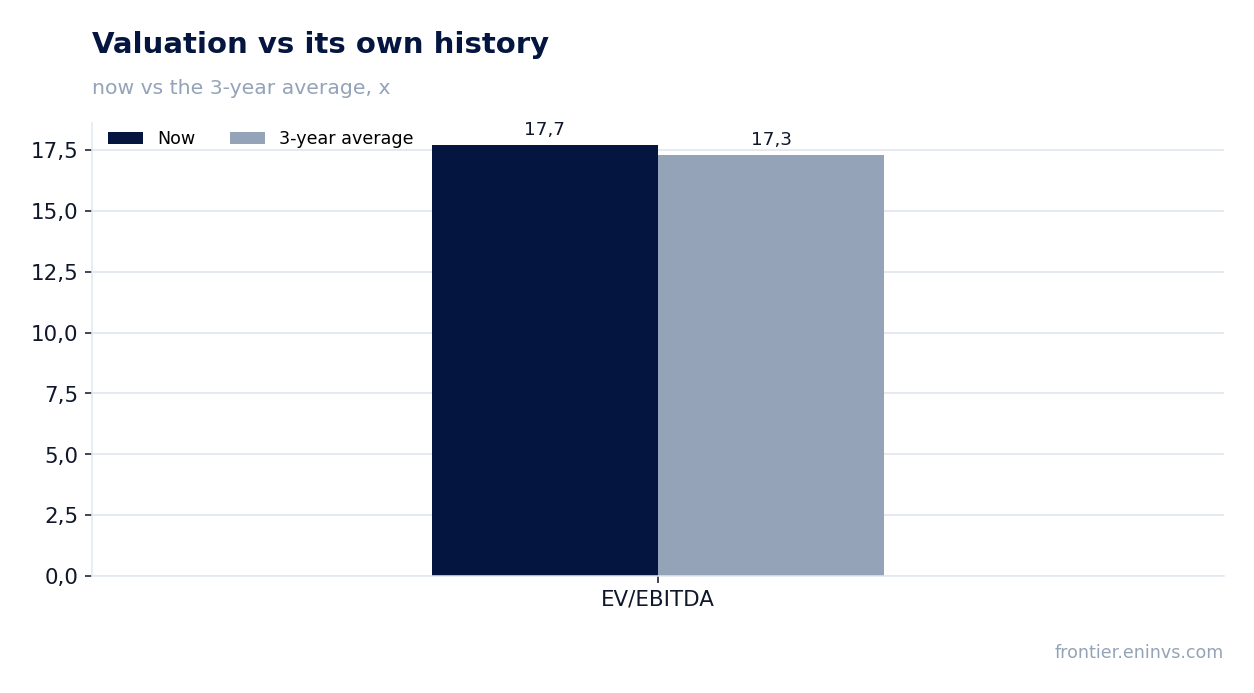
EV/EBITDA at 17.7 is in line with its own three-year average of 17.3, and the portal model implies only 4% upside
The LTM EV/EBITDA multiple is 17.7, 2% above its own three-year average of 17.3. This means the stock is valued by the market roughly in line with its average over the past three years, without a notable discount or premium. The LTM P/E is 24.0.
On the portal's model, the fair value of the share implies only 4% upside to the current price. The model incorporates EBITDA growth and a target multiple. At current rates of earnings and margin growth, the upside is limited.
Market capitalisation is $384.8 billion, and LTM free cash flow is $19.9 billion. The free cash flow yield is about 5.2%, which does not look attractive for a defensive name given margin risks.
Valuation on the latest reported figures
| Metric | Value |
|---|---|
| Market cap | 385 bn USD |
| P/E (LTM) | 24.0 |
| EV/EBITDA (LTM) | 17.7 |
| P/B | 7.09 |
| Net debt / EBITDA (LTM) | 1.02 |
| Operating cash flow (LTM) | 19.9 bn |
| ROE | 34.5% |
| Dividend yield (12m) | 2.6% |
| EV/EBITDA, 3-year average | 17.3 |
Bottom line
The strong side of the report is revenue acceleration to 7.4% and volume growth of 2.4%, indicating real demand. However, profit is not growing: net profit fell 0.4%, and EBITDA added only 2.0% due to margin pressure. One-off restructuring charges of $98 million and rising interest expense compound the picture. The stock is fairly valued relative to its own history, and a 2.6% dividend yield does not compensate for the risks. The question for a holder is whether the company can restore margins while maintaining revenue growth.
Open the company's financial profile PG →
See also: market overview · valuation map · stock screeners