RTX Corp: sales up 11.1%, but nearly half of the profit gain came from one-off tariff recoveries
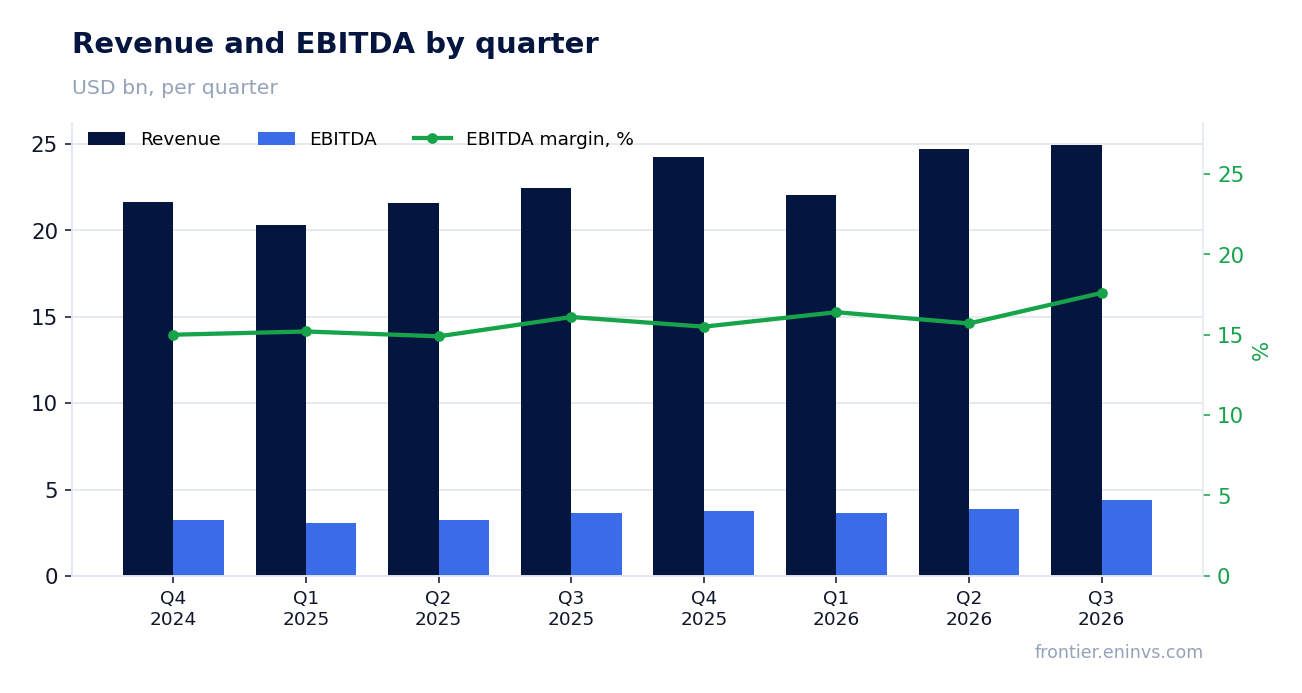
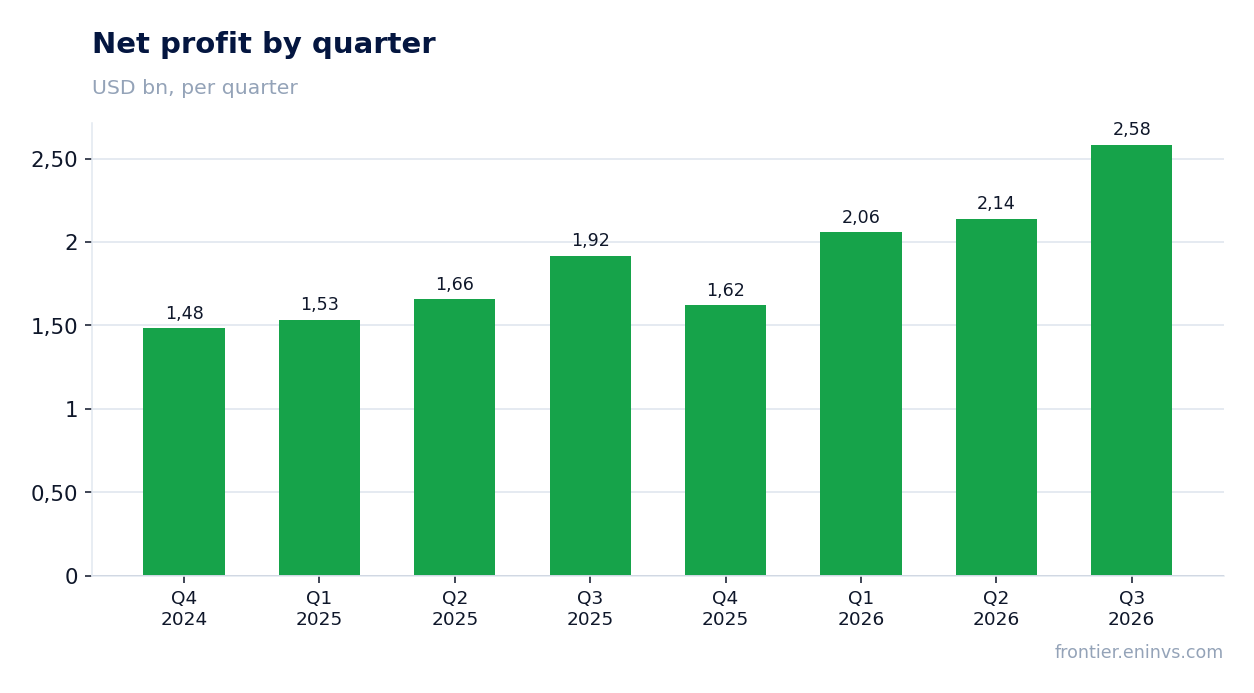
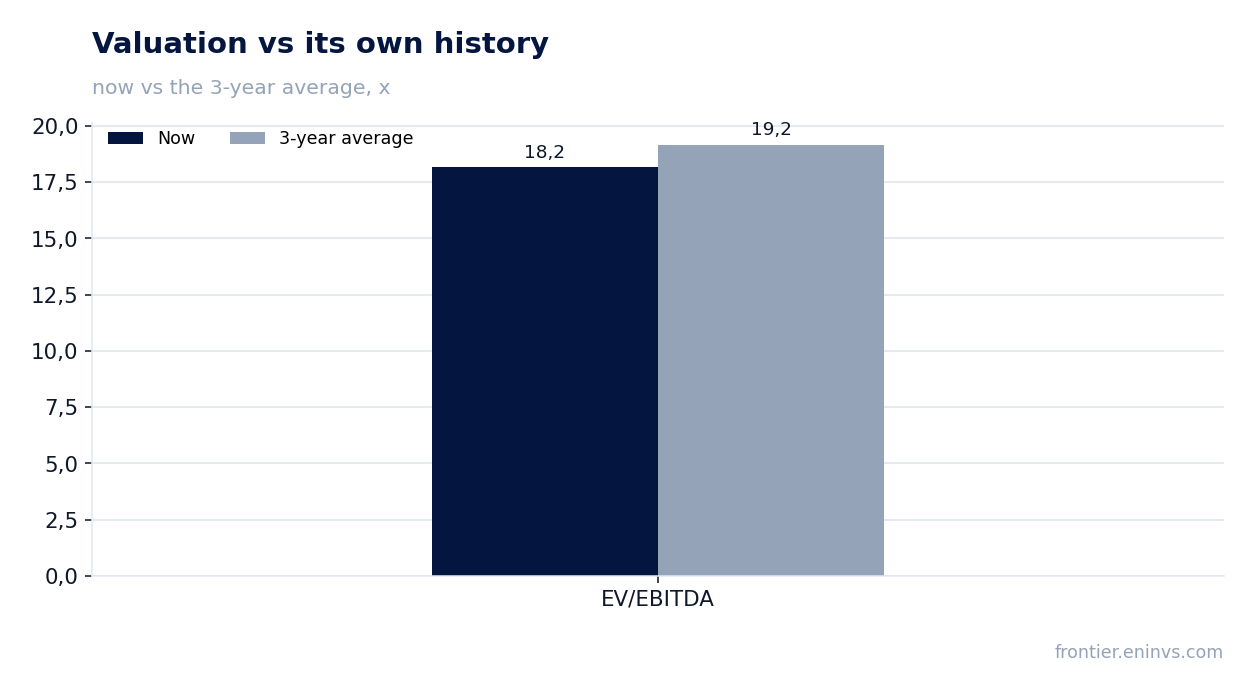
On 20 October RTX Corp reported third-quarter 2026 results. Sales came in at $24,965 million (+11.1% year on year), EBITDA at $4,405 million (+21.9%), net income at $2,583 million (+34.7%), and the EBITDA margin rose to 17.6% from 16.1%. Adjusted EPS rose 33% to $2.26, of which $0.25 came from IEEPA cost recovery – without that one-off the profit gain would have been markedly smaller. The stock trades at EV/EBITDA LTM of 18.2 against its own three-year average of 19.2, i.e. cheaper than its own history, and the portal's model puts upside to fair value at +20%; at the same time sales growth decelerated from 14.5% in Q2 to 11.1%, and free cash flow fell 47%. Given the discount to its own history and the strong $340 billion backlog, the share looks rather attractive, though one-off tariff recoveries and weak cash flow keep the picture from being flawless.
Key takeaways
— Sales grew 11.1%, but the pace decelerated from 14.5% in the second quarter
— The EBITDA margin rose to 17.6% largely on IEEPA tariff recoveries
— Adjusted EPS rose 33%, and a quarter of that gain was a one-off cost recovery
— Free cash flow fell 47% on higher capex and weaker operating cash flow
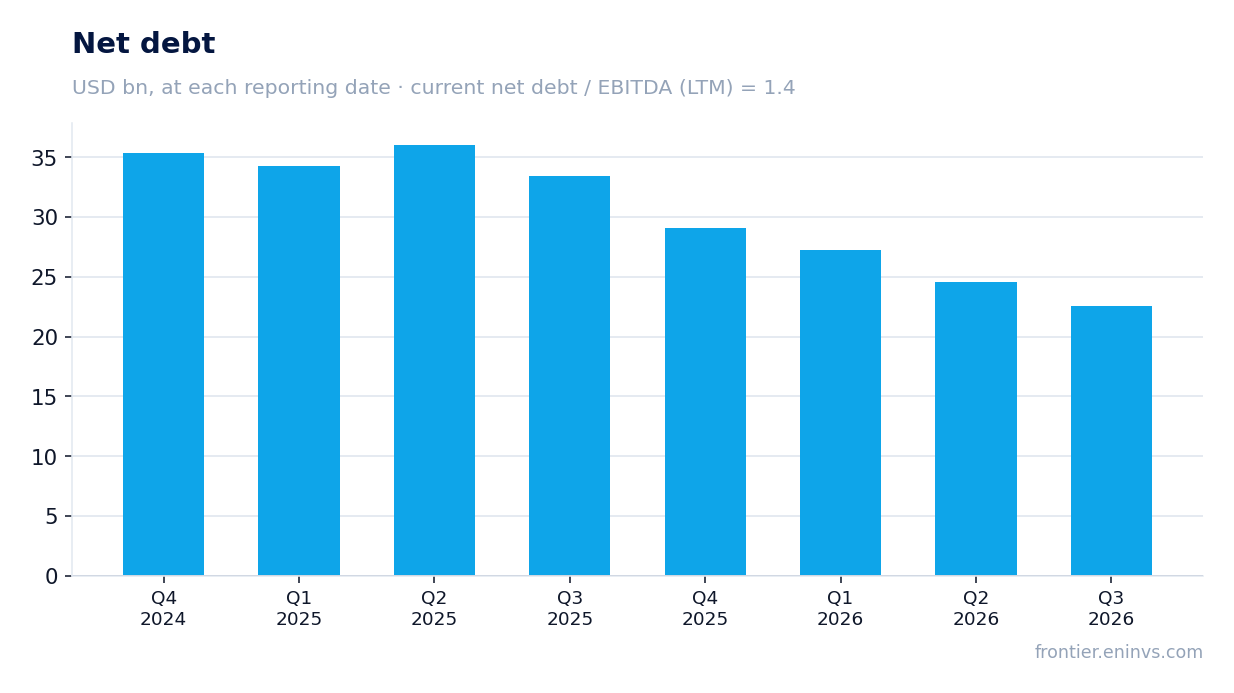
— Net debt fell to $22.5 billion, with net debt/EBITDA LTM at 1.4
— The backlog reached a record $340 billion, supporting demand for the company's products
— The stock trades below its own three-year history on EV/EBITDA, and the dividend yield is 1.46%
Attractiveness
Key figures, USD bn
| Metric | Q3 2025 | Q3 2026 | Change |
|---|---|---|---|
| Revenue | 22.5 | 25.0 | +11.1% |
| EBITDA | 3.61 | 4.41 | +21.9% |
| Operating profit | 2.52 | 3.34 | +32.3% |
| Net profit | 1.92 | 2.58 | +34.7% |
| Operating cash flow | 4.64 | 2.87 | -38.2% |
| Capex | 0.61 | 0.75 | +22.0% |
| EBITDA margin | 16.1% | 17.6% | +1.5 pp |
| Net margin | 8.5% | 10.3% | +1.8 pp |
Sales grew 11.1%, but the pace decelerated from 14.5% in the second quarter
RTX Corp's third-quarter 2026 sales came in at $24,965 million, up 11.1% year on year. Growth is in double digits, but slower than in the second quarter, when sales rose 14.5%. The deceleration is visible in organic terms too: according to the release, organic growth was 12% versus 11% reported, meaning divestitures slightly dragged the figure down.
All three segments delivered double-digit growth. Collins Aerospace added 10% to $8,382 million on a 23% increase in commercial OE and 9% in commercial aftermarket. Pratt & Whitney grew 10% to $9,231 million on a 21% rise in aftermarket. Raytheon rose 14% to $8,031 million on higher volumes in naval programs and air-defence systems, including Patriot, Standard Missile and Tomahawk.
Demand is underpinned by a record backlog of $340 billion, of which $176 billion is commercial and $164 billion defence. In the third quarter the company booked over $81 billion of new awards, including multi-year Tomahawk and AMRAAM contracts. Such a backlog provides revenue visibility for several years, though the pace of its conversion into cash remains a question.
The EBITDA margin rose to 17.6% largely on IEEPA tariff recoveries
EBITDA in the third quarter was $4,405 million, with a margin of 17.6% versus 16.1% a year earlier. The 1.5 percentage-point improvement looks strong, but the release explicitly states that segment profit included IEEPA cost recoveries: about $250 million at Collins, $160 million at Pratt & Whitney and $85 million at Raytheon. In total that is roughly $495 million, or more than 11% of quarterly EBITDA.
Without those recoveries the margin would have been markedly lower. Operating profit rose 32% to $3,337 million, but it also reflects one-off items: a $363 million charge for a customer bankruptcy at Pratt & Whitney and $448 million of acquisition accounting adjustments. Adjusted segment operating profit rose 39% to $3,890 million, and that growth is to a large extent driven by the tariff recoveries.
Margin sustainability will depend on whether the IEEPA effect persists in coming quarters. Tariff recoveries compensate for costs already incurred rather than create a new profit stream, and their repetition at the same scale is not guaranteed. The 1.5 pp margin gain therefore reflects one-off support more than a durable improvement in the cost structure.
Adjusted EPS rose 33%, and a quarter of that gain was a one-off cost recovery
Net income attributable to shareholders was $2,583 million, or $1.89 per share, versus $1,918 million and $1.41 a year earlier. Adjusted EPS rose 33% to $2.26, and $0.25 of that gain came from IEEPA cost recovery. Without it, adjusted EPS would have grown by roughly 18% rather than 33%.
The gap between reported and adjusted profit is explained by a set of one-off items. Besides the tariff recoveries, reported profit includes a $363 million customer-bankruptcy charge, $448 million of acquisition accounting adjustments and a $159 million gain on investment revaluation. Adjusted net income was $3,091 million, up 34% from $2,311 million a year earlier.
The 34.7% reported profit growth looks impressive, but its quality is uneven. Roughly half of the gain came from tariff recoveries and investment revaluation, which are unlikely to repeat at the same scale. The durable part of the growth – higher volumes in commercial aerospace and defence – is more modest than the headline figure.
Free cash flow fell 47% on higher capex and weaker operating cash flow
Operating cash flow in the third quarter was $2,868 million versus $4,639 million a year earlier, and free cash flow was $2,119 million versus $4,025 million, a 47% decline. Capex rose to $749 million from $614 million, but the main driver of the lower cash flow was working capital: contract liabilities fell by $980 million, whereas a year earlier they rose by $986 million.
The swing in working capital is the key factor. A year earlier the company saw a significant inflow from contract liabilities, while this quarter they decreased. This may reflect either seasonality or a change in contract payment schedules, but the release does not disclose the specific cause. For an investor, it matters that operating cash flow of $2.9 billion came in below net income of $2.6 billion, meaning profit-to-cash conversion was weak this quarter.
For the nine months, operating cash flow was $8,270 million versus $6,402 million a year earlier, and free cash flow was $6,306 million versus $4,745 million. On a cumulative basis the picture is better than in the single quarter, and the full-year free cash flow target of $9.0–9.2 billion looks achievable. But quarterly cash-flow volatility remains high.
Net debt fell to $22.5 billion, with net debt/EBITDA LTM at 1.4
Net debt at 30 September 2026 was $22,527 million. It fell from $24,544 million at 30 June, a decrease of $2.0 billion, and from $33,446 million at 30 September 2025, a decrease of $10.9 billion over twelve months. The ratio of net debt to trailing-twelve-month EBITDA is 1.4, which looks comfortable for an investment-grade industrial company.
The year-on-year debt reduction is partly explained by asset sales: in 2025 the company completed the divestiture of the actuation and flight control business at Collins, which brought in $1,188 million. In addition, the company used part of its free cash flow to repay debt. Interest expense in the third quarter was $381 million versus $449 million a year earlier, reflecting the lower debt burden.
The debt level does not pose a risk to the dividend or the buyback programme. With LTM EBITDA of $16,038 million and net debt of $22.5 billion, the 1.4 ratio leaves significant headroom to typical covenants. The question is whether cash flow will remain sufficient for further deleveraging, given quarterly volatility.
The backlog reached a record $340 billion, supporting demand for the company's products
RTX Corp's backlog at the end of the third quarter was $340 billion, of which $176 billion was commercial and $164 billion defence. This is a record level for the company. In the quarter it booked over $81 billion of new awards, including multi-year Tomahawk and AMRAAM contracts, confirming steady demand from both commercial airlines and defence customers.
Such a backlog provides revenue visibility for several years ahead and reduces the risk of a sharp drop in capacity utilisation. However, conversion of the backlog into revenue and cash depends on delivery schedules and payment terms. In the third quarter, sales growth of 11.1% against a $340 billion backlog implies the company is executing roughly 7–8% of the backlog per quarter, equivalent to about three years of revenue.
For an investor, the backlog is an argument for business resilience but not a guarantee of profitability. Margins on defence contracts may be lower than on commercial ones, and execution timelines are stretched. Nevertheless, the record backlog supports confidence that the company's revenue will not face a sharp drop in demand in the coming years.
The stock trades below its own three-year history on EV/EBITDA, and the dividend yield is 1.46%
On EV/EBITDA LTM the stock trades at 18.2, below its own three-year average of 19.2, i.e. 5% cheaper than its own history. This is the only available comparison, and it suggests the market values the company more modestly than over the past three years on average. P/E LTM is 31.2, which looks moderate for an industrial company with double-digit sales growth.
The trailing-twelve-month dividend yield is 1.46%. The company paid $984 million of dividends in the third quarter and $2,882 million over nine months. With LTM net income of $8,403 million, the payout ratio is about 34%, leaving room for dividend growth. However, a 1.46% yield is below the key rate, making the stock less appealing to income investors.
According to the portal's model, which values fair price through EBITDA growth and a target multiple, the upside to fair value is +20%. This is the portal's own estimate, not a market consensus. Given the discount to its own history and the strong backlog, the valuation looks reasonable, but one-off items in profit and weak quarterly cash flow hold back multiple expansion.
Valuation on the latest reported figures
| Metric | Value |
|---|---|
| Market cap | 262 bn USD |
| P/E (LTM) | 31.2 |
| EV/EBITDA (LTM) | 18.2 |
| P/B | 4.02 |
| Net debt / EBITDA (LTM) | 1.40 |
| Operating cash flow (LTM) | 12.4 bn |
| ROE | 5.1% |
| Dividend yield (12m) | 1.5% |
| EV/EBITDA, 3-year average | 19.2 |
Bottom line
The report's strength remains double-digit sales growth across all three segments and a record $340 billion backlog, which provides revenue visibility for years ahead. However, a significant part of the profit gain – about $495 million of tariff recoveries and $159 million of investment revaluation gains – is one-off, and free cash flow fell 47% on working capital. Leverage at 1.4x EBITDA and the discount to its own history on EV/EBITDA support the valuation, but the 1.46% dividend yield is below the key rate. The question for a holder now is whether operating momentum persists without one-off support and whether cash flow recovers in the fourth quarter.
Open the company's financial profile RTX →
See also: market overview · valuation map · stock screeners