Seagate Technology Holdings plc: profit tripled, but reported-quarter revenue fell 11.8%
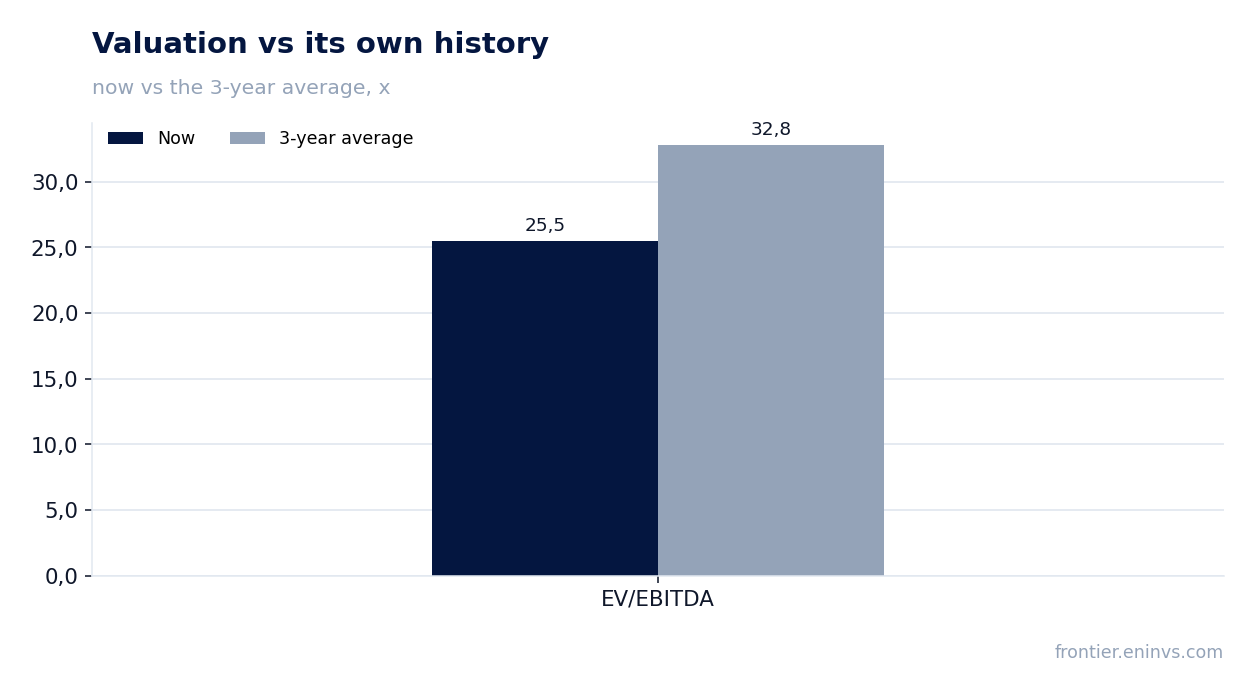
On 28 October Seagate Technology Holdings plc reported results for the first quarter of fiscal 2027 ended 2 October 2026. Revenue was $4,233.0m, EBITDA $2,217.0m and net profit $1,761.0m; year on year revenue rose 61.0%, EBITDA 189.4% and net profit 220.8%. Sequentially, however, revenue fell from $4,233.0m in the prior quarter, and the annual growth rate slowed from 61.0% in the first quarter of 2026 to minus 11.8% in the reported quarter. At the current price the share looks attractive: EV/EBITDA of 25.5 is below its own three-year average of 32.8, and the portal model implies +45% upside.
Key takeaways
— Reported-quarter revenue rose 61.0% year on year but fell sequentially from $4,233.0m
— EBITDA margin rose to 52.4% from 29.1% a year earlier
— Net profit tripled, with $44.0m of it eaten by losses on debt transactions
— Free cash flow reached $1,479.0m on capital expenditure of $211.0m
— Debt was cut to $2.4bn, and net debt/EBITDA LTM stands at 0.38
— The dividend was raised by about 3%, to $0.76 per share
— EV/EBITDA of 25.5 is below its own three-year average of 32.8, and the portal model implies +45% upside
Attractiveness
Key figures, USD bn
| Metric | Q4 2025 | Q4 2026 | Change |
|---|---|---|---|
| Revenue | 2.63 | 4.23 | +61.0% |
| EBITDA | 0.77 | 2.22 | +189.4% |
| Operating profit | 0.69 | 2.06 | +197.4% |
| Net profit | 0.55 | 1.76 | +220.8% |
| Operating cash flow | 0.53 | 1.69 | +217.7% |
| Capex | 0.10 | — | — |
| EBITDA margin | 29.1% | 52.4% | +23.3 pp |
| Net margin | 20.9% | 41.6% | +20.7 pp |
Reported-quarter revenue rose 61.0% year on year but fell sequentially from $4,233.0m
Revenue for the first quarter of fiscal 2027 was $4,233.0m against $2,629.0m a year earlier, up 61.0%. That is the highest quarterly level in the available history: revenue was $2,155.0m in the prior quarter and $3,112.0m the quarter before that.
Sequentially, however, revenue fell from $4,233.0m in the prior quarter, and the annual growth rate slowed from 61.0% in the first quarter of 2026 to minus 11.8% in the reported quarter. The year-on-year comparison shows strong growth, but the sequential trend shows a pullback from the prior quarter's peak.
The company attributes demand to compounding data creation and long-term customer visibility. The release gives only general wording on mass-capacity storage demand and the HAMR roadmap; there is no segment revenue split in the press-release text.
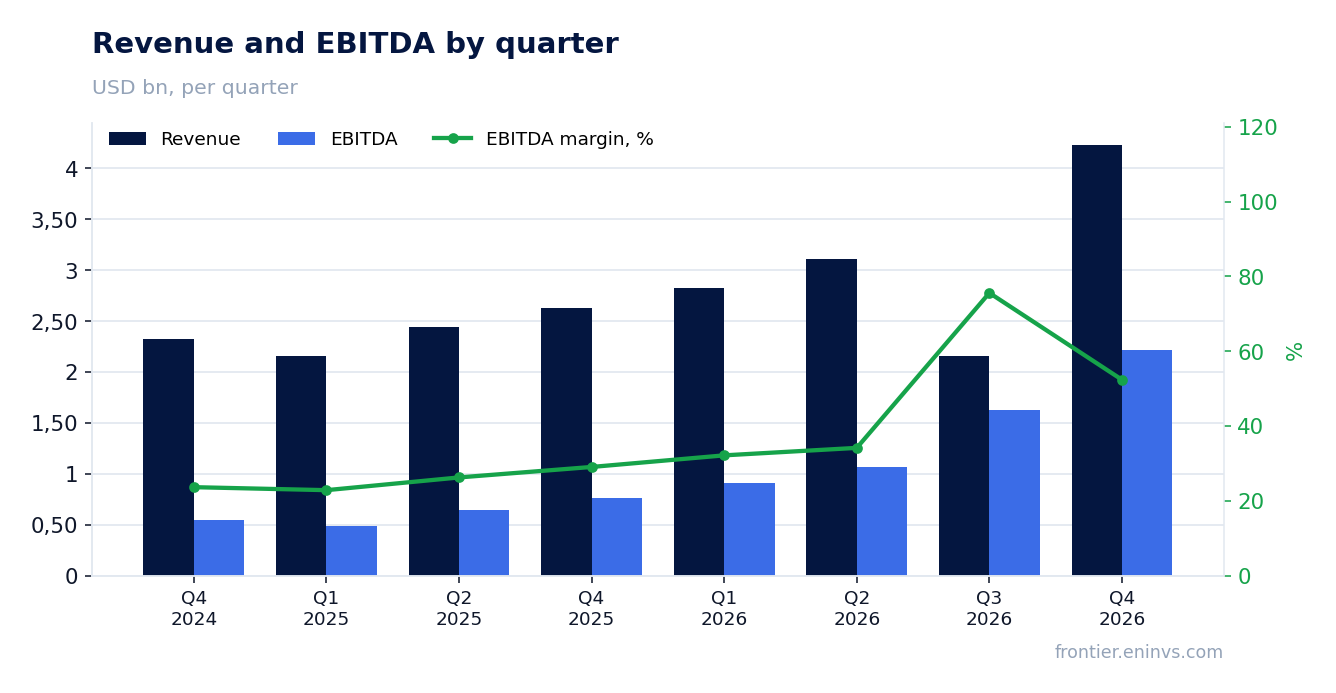
EBITDA margin rose to 52.4% from 29.1% a year earlier
EBITDA for the reported quarter was $2,217.0m, or 52.4% of revenue, against 29.1% a year earlier. Such margin expansion on revenue of $4,233.0m means almost the entire revenue increase flowed through to EBITDA.
GAAP gross margin was 57.3% against 39.4% a year earlier, and non-GAAP gross margin 57.8% against 40.1%. GAAP operating margin was 48.8% against 26.4%. Cost of revenue rose to $1,806.0m from $1,592.0m, far slower than revenue.
Operating expenses stayed modest: product development $200.0m, marketing and administrative $159.0m. The combination of revenue growth and nearly flat costs produced the margin jump. Whether this level holds is the main question for the next quarter.
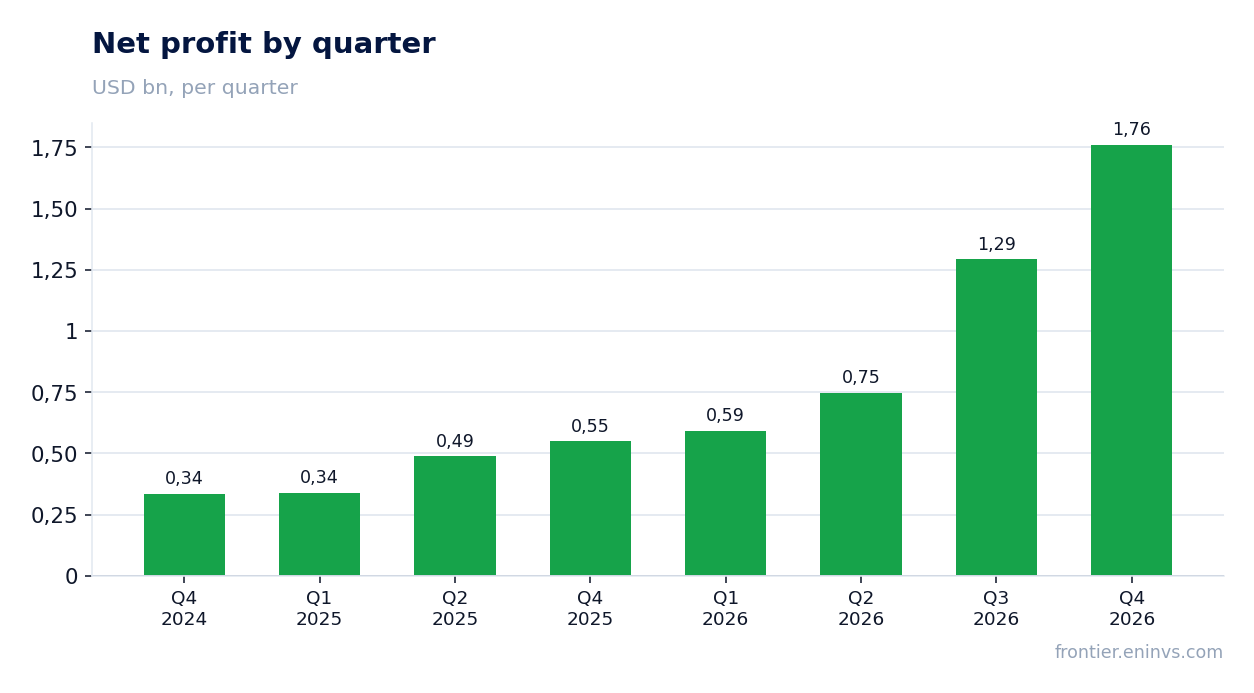
Net profit tripled, with $44.0m of it eaten by losses on debt transactions
Net profit for the reported quarter was $1,761.0m against $549.0m a year earlier, up 220.8%. Net margin was 41.6% against 20.9%. GAAP diluted EPS was $7.59 against $2.43.
There are one-off items inside the profit. Losses on debt transactions were $44.0m, the result of early debt retirement. Restructuring and other added $4.0m of expense. Excluding these, non-GAAP net profit would have been $1,781.0m and non-GAAP EPS $7.68.
Tax adjustments in the non-GAAP reconciliation were minus $107.0m. The one-offs therefore do not fundamentally distort the picture: profit growth came mainly from operating margin, not from one-off gains.
Free cash flow reached $1,479.0m on capital expenditure of $211.0m
Operating cash flow for the reported quarter was $1,690.0m against $532.0m a year earlier. Capital expenditure was $211.0m against $105.0m. Free cash flow was $1,479.0m against $427.0m a year earlier.
The company calls this its highest ever free cash flow in the September quarter. Working capital absorbed part of the flow: receivables rose by $283.0m and inventories by $129.0m. That was offset by a $101.0m increase in payables and $272.0m in accruals.
Cash at quarter-end was $1,258.0m against $1,704.0m at the start. The decline reflects $1,262.0m of debt repayment and $400.0m of share repurchases. With free cash flow at this level the company funds debt, dividends and buybacks without external borrowing.
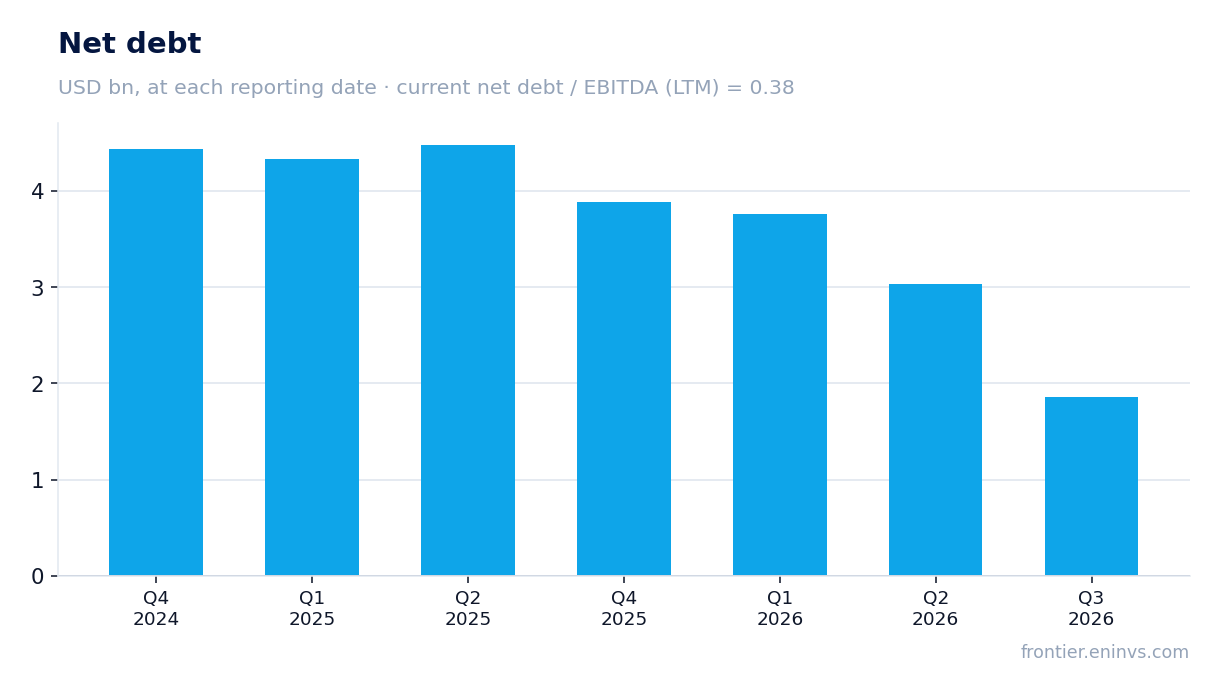
Debt was cut to $2.4bn, and net debt/EBITDA LTM stands at 0.38
During the quarter the company retired about $1.2bn of principal debt, cutting gross debt to $2.4bn. After quarter-end a further $750.0m was retired, bringing gross debt to $1.6bn. Net debt on the latest annual balance sheet was $2,194.0m.
Net debt/EBITDA over the last twelve months is 0.38. That is a level, not a direction: the earlier value is not in the facts, so no claim can be made about whether the ratio rose or fell. Interest expense for the quarter was $41.0m against $80.0m a year earlier, reflecting the lower debt.
The $44.0m loss on debt transactions is the price of early retirement. It is one-off and does not change the fact that leverage is now low and interest expense is falling.
The dividend was raised by about 3%, to $0.76 per share
The board declared a quarterly dividend of $0.76 per share, payable on 7 January 2027 to holders of record on 23 December 2026. That is about 3% above the prior level. Dividends paid in the reported quarter were $168.0m; the declared dividend for the quarter was $0.74 per share.
At a share price of $644.21, the $0.76 quarterly dividend gives about 0.47% per quarter, and the trailing yield in the facts is 0.44%. That is a modest yield, below the key rate. The dividend is not the main argument here: the company returns capital mainly through buybacks – $400.0m in the quarter.
Our estimate for the current year's dividend, based on the declared quarterly level of $0.76 and four payments, is about $3.04 per share. It rests on the reported quarter's profit and on low leverage. The risk to the payout is a fall in profit if the 52.4% margin does not hold, and rising capital expenditure.
EV/EBITDA of 25.5 is below its own three-year average of 32.8, and the portal model implies +45% upside
The trailing twelve-month EV/EBITDA multiple is 25.5 against its own three-year average of 32.8, i.e. 22% below. On this multiple the share is cheaper than its own history. The trailing P/E is 33.3.
The portal model, which sets EBITDA growth against the target multiple and market capitalisation, implies upside to fair value of +45%. This is our own estimate, not a market consensus and not a target price.
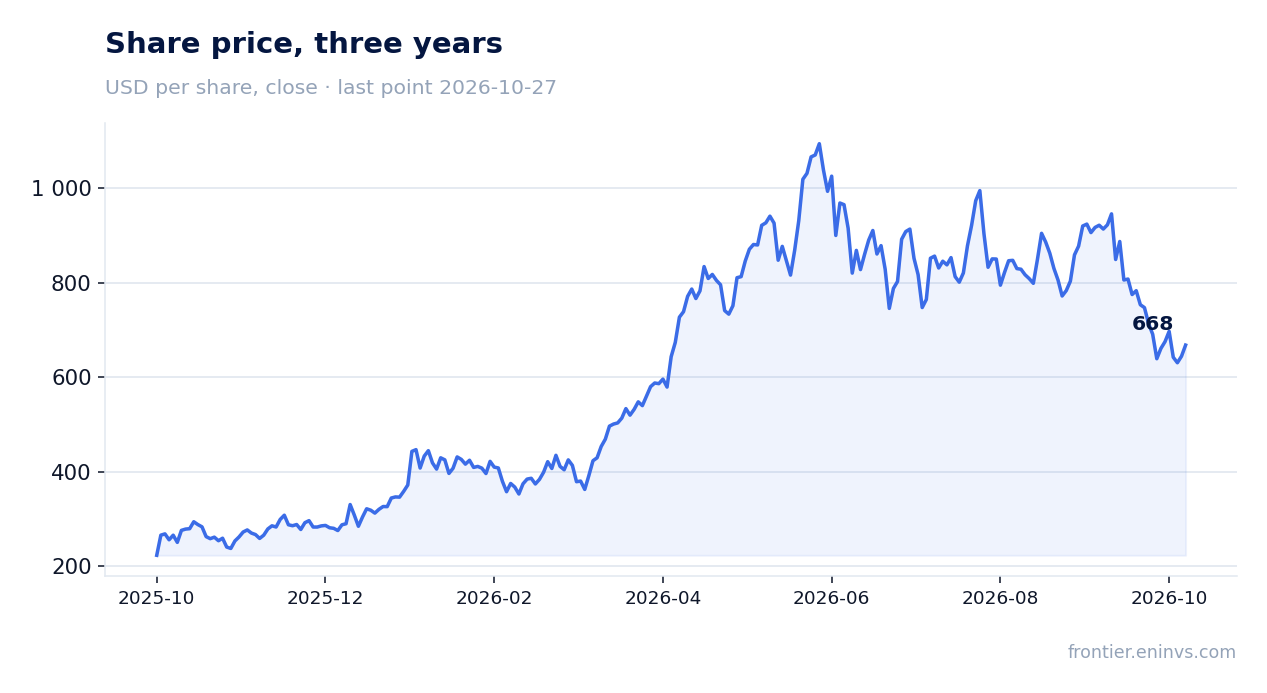
The share price before the release was $644.21; it added 3.7% on the release day and 3.7% from the release to 27 October 2026. The market reacted positively to the report. The share is held in the live model strategy 'US AI infrastructure' on the portal – a fact, not an argument for the verdict.
Valuation on the latest reported figures
| Metric | Value |
|---|---|
| Market cap | 146 bn USD |
| P/E (LTM) | 33.3 |
| EV/EBITDA (LTM) | 25.5 |
| Net debt / EBITDA (LTM) | 0.38 |
| Operating cash flow (LTM) | 4.83 bn |
| ROE | 238.9% |
| Dividend yield (12m) | 0.4% |
| EV/EBITDA, 3-year average | 32.8 |
Bottom line
The strength of the report was not revenue but margin: EBITDA margin of 52.4% and net profit of $1,761.0m tripled, while free cash flow reached $1,479.0m. Part of the profit was eaten by $44.0m of one-off losses on debt transactions, but they do not change the picture. The main question for a holder is whether the margin holds if next quarter's revenue falls short of the $4.8bn guidance. With EV/EBITDA at 25.5 against its own three-year average of 32.8 and +45% upside on the portal model, the share looks attractive.
Open the company's financial profile STX →
See also: market overview · valuation map · stock screeners