AngloGold Ashanti: gold rose 23% but EBITDA fell 6% – volumes and costs ate the price
Contents
On 11 November AngloGold Ashanti reported results for the third quarter of 2026. The average gold price in the period was 4,268 USD/oz versus 3,459 USD a year earlier (+23.4%), yet revenue rose only 8.4% to 2,619 mn USD and EBITDA fell 6.2% to 1,313 mn USD. At year-ago volumes and costs and this period's price, our calculation puts EBITDA at 1,965.5 mn USD – the company earned 652.5 mn USD less, and the gap is explained by volumes and unit costs. Our conclusion: the share is fairly valued – the portal model shows only +5% upside to fair value. Our view: the share is fairly valued; upside on the portal model +5%.
Our view: is there upside
Our view in numbers
| Metric | Our read |
|---|---|
| Verdict | Neutral |
| Upside on the portal model | +5% |
| How the model works | spot model: EBITDA re-priced to current commodity prices at the target EV/EBITDA, against market cap |
| EV/EBITDA now and 3-year average | 6.2 vs 6.3 – in line with its history |
| Dividend yield, 12m | 4.8% |
| Net debt / EBITDA | -0.20 – net cash |
| Strongest case for | Net cash of 1.5 bn USD and a 4.8% dividend yield at a payout ratio of about 58% of LTM profit of 3,925 mn USD give the holder a steady income with no debt risk. |
| Strongest case against | EBITDA is 33.2% below the calculation at year-ago volumes and costs, and the margin compressed to 50.1% from 57.9% – the company is not fully earning on the higher gold price. |
| What would change the view | Gold holding above 4,268 USD/oz with a recovery in production volumes would lift the verdict one step; spot falling below 4,048 USD would lower it one step. |
Key takeaways
— Gold averaged 4,268 USD/oz in the quarter – 23.4% above a year earlier but already 5.5% below the previous quarter
— At year-ago volumes and costs, our calculation puts EBITDA at 1,965.5 mn USD – reported 1,313 mn is 33.2% below that
— Revenue grew only 8.4% year on year, decelerating from 27.0% in the second quarter – the gold price did not reach the top line in full
— The EBITDA margin compressed to 50.1% from 57.9% a year earlier – higher unit costs and lower volumes outweighed the metal's rise
— Net cash rose to 1.5 bn USD from 0.2 bn a year earlier, and free cash flow stays positive with capex of 497 mn USD in the quarter
— The trailing 12-month dividend yield is 4.8%, supported by LTM profit of 3,925 mn USD at a P/E of 12.1
— EV/EBITDA LTM of 6.2 is essentially level with its three-year average of 6.3 – the market gives neither a discount nor a premium for current earnings
Key figures, USD bn
| Metric | Q3 2025 | Q3 2026 | Change |
|---|---|---|---|
| Revenue | 2.42 | 2.62 | +8.4% |
| EBITDA | 1.40 | 1.31 | -6.2% |
| Operating profit | 1.09 | 1.19 | +8.4% |
| Net profit | 0.67 | 0.79 | +17.6% |
| Operating cash flow | 1.42 | 1.38 | -2.7% |
| Capex | 0.34 | 0.50 | +45.3% |
| EBITDA margin | 57.9% | 50.1% | -7.8 pp |
| Net margin | 27.7% | 30.0% | +2.3 pp |
Gold averaged 4,268 USD/oz in the quarter – 23.4% above a year earlier but already 5.5% below the previous quarter
The average gold price in the third quarter of 2026 was 4,268 USD/oz versus 3,459 USD a year earlier – a rise of 23.4%. This is the main external driver of revenue: gold accounts for 100% of the company's sales in the portal model.
Against the previous quarter the metal fell 5.5%, from 4,514 USD to 4,268 USD. Spot gold on 11 November 2026 is 4,048 USD, another 5.2% below the reported-period average. The price backdrop has thus deteriorated for a second consecutive quarter.
For a producer this means quarterly revenue and profit were earned at a price above today's. The next report will come at a lower metal price unless spot recovers.
Commodity prices: period average and now
| Benchmark | Year ago | Q3 2026 | YoY | Spot 2026-11-11 |
|---|---|---|---|---|
| Gold, USD | 3 459 | 4 268 | +23,4% | 4 048 |
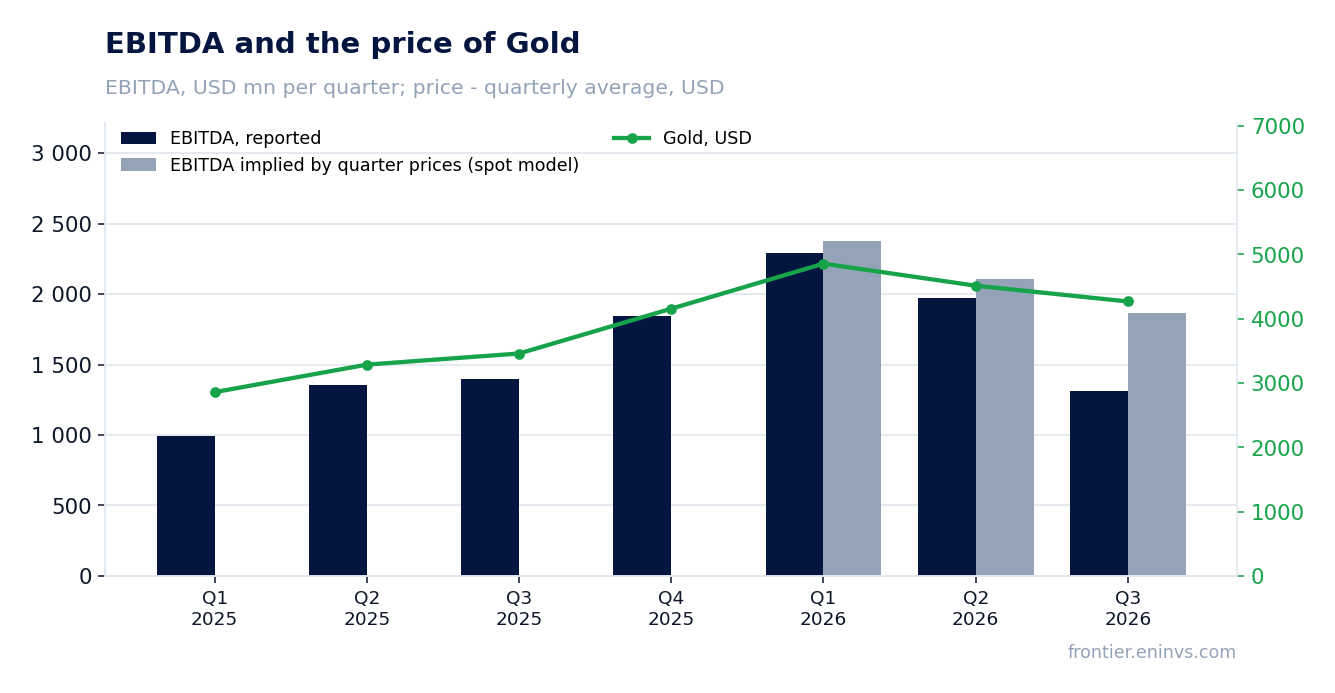
At year-ago volumes and costs, our calculation puts EBITDA at 1,965.5 mn USD – reported 1,313 mn is 33.2% below that
Holding third-quarter 2025 volumes and non-commodity costs and moving only the gold price to the reported period gives revenue of 2,982.5 mn USD and EBITDA of 1,965.5 mn USD. The price effect alone would have added 565.5 mn USD to revenue.
In fact the company booked revenue of 2,619 mn USD – 363.5 mn USD below the calculation – and EBITDA of 1,313 mn USD, 652.5 mn USD lower. The 33.2% EBITDA gap means the metal price was eaten by lower sales volumes and higher unit costs.
The picture versus the previous quarter is similar: at second-quarter volumes and costs EBITDA should have been 1,804.6 mn USD, and the reported figure is 27.2% below. The portal's spot model, built from the average of the previous four quarters, expected EBITDA of 1,867.3 mn USD – actual is 29.7% below. The model's deviation in the two prior periods was far smaller – 3.8% and 6.3%.
What the prices implied and what the company earned
| Base (Q3 2025) | Implied at period prices | Reported | Reported vs implied | |
|---|---|---|---|---|
| Revenue, USD mn | 2 417 | 2 982 | 2 619 | -12,2% |
| EBITDA, USD mn | 1 400 | 1 966 | 1 313 | -33,2% |
| EBITDA, portal spot model, USD mn | — | 1 867 | 1 313 | -29,7% |
Revenue and EBITDA by quarter
| Period | Measure | bn USD |
|---|---|---|
| Q1 2025 | Revenue | 1.963 |
| Q2 2025 | Revenue | 2.445 |
| Q3 2025 | Revenue | 2.417 |
| Q4 2025 | Revenue | 3.068 |
| Q1 2026 | Revenue | 3.236 |
| Q2 2026 | Revenue | 3.104 |
| Q3 2026 | Revenue | 2.619 |
| Q1 2025 | EBITDA | 0.996 |
| Q2 2025 | EBITDA | 1.353 |
| Q3 2025 | EBITDA | 1.4 |
| Q4 2025 | EBITDA | 1.841 |
| Q1 2026 | EBITDA | 2.291 |
| Q2 2026 | EBITDA | 1.974 |
| Q3 2026 | EBITDA | 1.313 |
EBITDA margin
| Period | Measure | % |
|---|---|---|
| Q1 2025 | EBITDA margin | 50.7 |
| Q2 2025 | EBITDA margin | 55.3 |
| Q3 2025 | EBITDA margin | 57.9 |
| Q4 2025 | EBITDA margin | 60.0 |
| Q1 2026 | EBITDA margin | 70.8 |
| Q2 2026 | EBITDA margin | 63.6 |
| Q3 2026 | EBITDA margin | 50.1 |
Revenue grew only 8.4% year on year, decelerating from 27.0% in the second quarter – the gold price did not reach the top line in full
Third-quarter 2026 revenue was 2,619 mn USD, 8.4% above the year-ago level. That is a marked deceleration: growth was 27.0% in the second quarter and 64.8% in the first.
With gold up 23.4%, revenue should have grown faster. The shortfall means volumes sold in ounces fell year on year and the realised price came in below the market average. The data provided give no exact production or sales figures, so we state only what is visible: revenue growth is a third of the price move.
Against the previous quarter revenue fell: 2,619 mn USD versus 3,104 mn USD in the second quarter. Both the 5.5% price decline and lower volumes contributed.
The EBITDA margin compressed to 50.1% from 57.9% a year earlier – higher unit costs and lower volumes outweighed the metal's rise
The EBITDA margin in the reported quarter was 50.1% versus 57.9% a year earlier. A 7.8 percentage-point drop while gold rose 23.4% is a strong signal: costs per ounce rose faster than the price.
EBITDA of 1,313 mn USD is made up of operating profit of 1,187 mn USD and depreciation of 126 mn USD. Operating profit fell faster than revenue year on year, confirming cost pressure. The materials provided give no exact cash cost or AISC figures, so we name only the direction: unit costs rose.
Net profit, by contrast, rose 17.6% to 787 mn USD and the net margin to 30.0% from 27.7%. The divergence from EBITDA is explained by items below operating profit – interest, FX and other income – which are not part of EBITDA.
Net debt
at each reporting date, current net debt / EBITDA (LTM) = -0.2
| Period | Measure | bn USD |
|---|---|---|
| Q1 2025 | Net debt | 0.755 |
| Q2 2025 | Net debt | 0.311 |
| Q3 2025 | Net debt | −0.231 |
| Q4 2025 | Net debt | −0.624 |
| Q1 2026 | Net debt | −0.868 |
| Q2 2026 | Net debt | −0.991 |
| Q3 2026 | Net debt | −1.475 |
Net cash rose to 1.5 bn USD from 0.2 bn a year earlier, and free cash flow stays positive with capex of 497 mn USD in the quarter
As of 30 September 2026 the company has net cash of 1.5 bn USD versus 0.2 bn USD on 30 September 2025 – an improvement of 1.2 bn USD over 12 months. At 30 June 2026 the position was 1.0 bn USD, so it grew by 0.5 bn USD in the quarter.
Operating cash flow in the quarter was 1,380 mn USD and capex 497 mn USD. Free cash flow remains comfortably positive, and it is what funds the dividend and further strengthening of the balance sheet.
Net debt to LTM EBITDA is negative at -0.2, reflecting the net cash position. At current gold prices the ratio is -0.21. There is effectively no debt load, and this is the main argument for the sustainability of payouts.
Valuation vs its own history
now vs the 3-year average
| Period | Measure | × |
|---|---|---|
| EV/EBITDA | Now | 6.18950694136676 |
| EV/EBITDA | 3-year average | 6.34334812399841 |
The trailing 12-month dividend yield is 4.8%, supported by LTM profit of 3,925 mn USD at a P/E of 12.1
The trailing 12-month dividend yield is 4.8%. The company is a dividend name, and the payout rests on LTM profit of 3,925 mn USD and LTM operating cash flow of 6,143 mn USD.
With an LTM P/E of 12.1 and a 4.8% yield, the payout ratio on LTM profit is about 58%. That is a moderate level, leaving room for reinvestment and for maintaining the net cash position.
Our estimate for the current year's dividend assumes LTM profit is sustained and a payout ratio near 58% – about 4.8% yield on the current price. The risk to the payout is a further fall in gold: spot is already 5.2% below the reported-period average, and next quarter's profit will be lower, all else equal.
EV/EBITDA LTM of 6.2 is essentially level with its three-year average of 6.3 – the market gives neither a discount nor a premium for current earnings
The EV/EBITDA LTM multiple is 6.2 versus a three-year average of 6.3 – a deviation of -2%, meaning the stock trades level with its own history. P/E LTM is 12.1 and ROE 34.3%.
At current gold prices the portal's spot model puts EBITDA at 7,170.8 mn USD versus LTM of 6,885 mn USD – 4.2% higher. EV/EBITDA at current prices is 6.4 and net debt to EBITDA is -0.21.
On the portal's model the fair value of the share implies +5% upside to the current price. That is modest: the market has already priced in both the high LTM profit and the strong balance sheet. Reserve life is 11.8 years at the current production rate, which supports the long-term valuation.
Valuation on the latest reported figures
| Metric | Value |
|---|---|
| Market cap | 47.4 bn USD |
| P/E (LTM) | 12.1 |
| EV/EBITDA (LTM) | 6.2 |
| P/B | 5.86 |
| Net debt / EBITDA (LTM) | -0.20 |
| Operating cash flow (LTM) | 6.14 bn |
| ROE | 34.3% |
| Dividend yield (12m) | 4.8% |
| EV/EBITDA, 3-year average | 6.3 |
Net profit by quarter
| Period | Measure | bn USD |
|---|---|---|
| Q1 2025 | Net profit | 0.443 |
| Q2 2025 | Net profit | 0.669 |
| Q3 2025 | Net profit | 0.669 |
| Q4 2025 | Net profit | 0.855 |
| Q1 2026 | Net profit | 1.281 |
| Q2 2026 | Net profit | 1.002 |
| Q3 2026 | Net profit | 0.787 |
Bottom line
The quarter's strength remains the balance sheet: net cash of 1.5 bn USD and free cash flow of 883 mn USD after capex. But the company failed to capitalise on gold that rose 23.4%: EBITDA is 33.2% below the calculation at year-ago volumes and costs, and the margin compressed to 50.1%. LTM profit of 3,925 mn USD and a 4.8% dividend yield look solid, yet the 6.2 multiple is level with the three-year average of 6.3 and the portal model shows only +5% upside. Our conclusion: the share is fairly valued – the portal model's +5% upside leaves no margin of safety, and a change of view needs either a higher gold price or a recovery in volumes and unit costs. Our view: the share is fairly valued; upside on the portal model +5%.