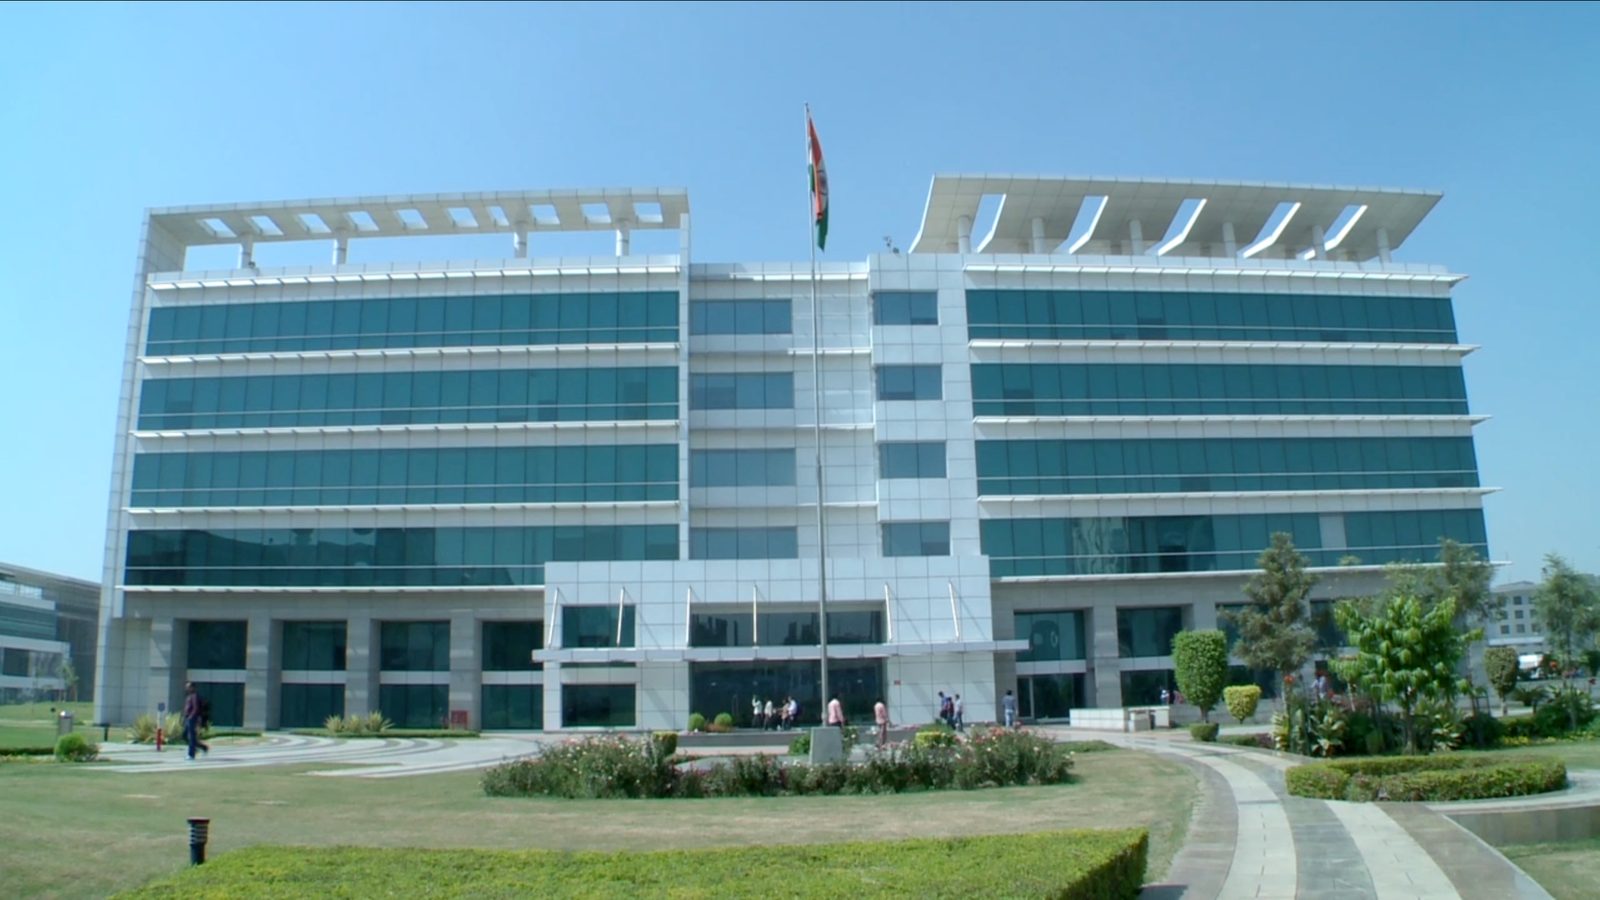
HCL Technologies provides IT and business services, engineering and R&D services, and software products, including application development, automation, data and AI, cybersecurity, and digital operations for enterprises.
Sector: IT services
IN_HCLTECH
Net debt (table and EV/EBITDA): |short-term borrowings| + |long-term borrowings| + |other financial liabilities| when extracted + |non-controlling interest| when extracted − |cash and equivalents|; amounts in millions of the reporting currency.
Shares: connector/market_inputs
Monetary columns are in B INR, one decimal; scale (K/M/B/T) keeps values readable. For the period (default) shows P&L and cash flow for that row’s reporting window: quarterly amounts when the feed uses quarter-duration facts (typical US 10-Q revenue and income), quarterly cash flows after stripping YTD where only cumulative tags exist, and an implied Q4 on 31 Dec FY rows (P&L: FY minus Q1–Q3; operating / investing cash flow: FY 12m minus 9M YTD to 30 Sep when sourced from SEC builder evidence) so they match 10-Q scale. Some issuers still use cumulative YTD minus the prior row in the same calendar year. As reported shows values stored on each row (e.g. full-year on FY). Balance sheet is always as reported. Source JSON may use millions etc.; conversion uses amounts_unit per row.
| Date | Period | Status | RevenueB INR | Operating profitB INR | D&AB INR | EBITDAB INR | Net profitB INR | Operating CFB INR | Capex + M&AB INR | AssetsB INR | EquityB INR | ROE (annualized) | Net debtB INR | Source |
|---|---|---|---|---|---|---|---|---|---|---|---|---|---|---|
| 2026-06-30 | Q2 2026 (3M) | PARTIAL | 345.8 y/y 13.9% | 61.9 y/y 14.7% | 10.4 y/y -4.9% | 72.3 y/y 11.4% | 46.2 y/y 20.3% | 27.4 | -3.4 | — y/y — | — y/y — | — | ≈ -80.5 | Yahoo Finance |
| 2026-03-31 | FY 2026 (12M) | OK | — y/y 11.2% | — y/y -3.9% | — y/y 6.6% | — y/y -2.4% | — y/y -4.3% | — | — | 1162.6 y/y 10.2% | 751.6 y/y 7.9% | — | -80.5 | Yahoo Finance |
| 2025-12-31 | Q4 2025 (3M) | PARTIAL | 338.7 y/y — | 57.1 y/y — | 11.3 y/y — | 68.4 y/y — | 40.8 y/y — | 58.6 | -3.0 | — y/y — | — y/y — | — | ≈ -59.3 | Yahoo Finance |
| 2025-06-30 | Q2 2025 (3M) | PARTIAL | 303.5 y/y — | 54.0 y/y — | 10.9 y/y — | 64.9 y/y — | 38.4 y/y — | 37.5 | -3.8 | — y/y — | — y/y — | — | ≈ -59.3 | Yahoo Finance |
| 2025-03-31 | FY 2025 (12M) | OK | 1170.5 y/y 6.5% | 239.1 y/y 11.1% | 40.8 y/y -2.1% | 279.9 y/y 8.9% | 173.9 y/y 10.8% | 222.6 | -11.1 | 1055.4 y/y 5.8% | 696.5 y/y 2.0% | 25.2% | -59.3 | Yahoo Finance |
| 2024-03-31 | FY 2024 (12M) | OK | 1099.1 y/y 8.3% | 215.2 y/y 8.5% | 41.7 y/y 0.7% | 256.9 y/y 7.1% | 157.0 y/y 5.7% | 224.5 | -10.5 | 997.8 y/y 6.8% | 682.6 y/y 4.4% | 23.5% | -71.1 | Yahoo Finance |
| 2023-03-31 | FY 2023 (12M) | OK | 1014.6 y/y — | 198.4 y/y — | 41.5 y/y — | 239.9 y/y — | 148.5 y/y — | 180.1 | -16.6 | 934.1 y/y — | 654.0 y/y — | — | -68.1 | Yahoo Finance |
Quarterly values (INR mln)
Year-over-year change
FCF (INR mln)
Net debt / cash (INR mln)
| year | 2022 | 2023 | 2024 | 2025 | 2026 |
|---|---|---|---|---|---|
| cash flow / profit | 1.25x | 1.21x | 1.43x | 1.28x | 1.20x |
| accruals, % of assets | — | -3.4% | -6.8% | -4.6% | -2.9% |
Our earnings breakdowns and investment notes on this issuer.
Value the company creates per year, as a % of market cap
Value created per year: +9.2%
| 1. EBITDA growth (latest quarter YoY, annualised) [EBITDA latest qtr − EBITDA year-ago qtr] × annualisation X (2026-06-30 vs 2025-06-30) = (72 310 − 64 910) × 3.82 | 28 242 |
| 2. Current EV/EBITDA (LTM) (Market cap + Net debt) ÷ EBITDA (LTM) = (3 744 865 + -80 530) ÷ 275 970 | 13.3x |
| 3. Target multiple (Current EV/EBITDA + 11) ÷ 2 = (13.3 + 11) ÷ 2 | 12.1x |
| 4. Cash flow (balance method, LTM) Net-debt reduction + dividends + buybacks − equity issuance = 21 210 + 0 + 0 − 0 | 0 |
| 5. Value created per year (EBITDA growth × Target multiple + Cash flow − Dilution) ÷ Market cap = (28 242 × 12.1 + 0) ÷ 3 744 865 | +9.2% |
Amounts in millions of the reporting currency. EBITDA growth is the latest quarter vs the same quarter a year ago, annualised.
Caveats:
Group: IT services. Every peer trades on the same market, so no adjustment is needed.
| Company | Market | Cap, $bn | EV/EBITDA |
|---|---|---|---|
| Infosys | India | 49.6 | 10.3x |
| Wipro | India | 19.2 | 10.5x |
| Tata Consultancy Services | India | 93.8 | 12.1x |
| Mphasis | India | 5.0 | 15.7x |
| Tech Mahindra | India | 18.3 | 16.8x |
| Coforge | India | 8.6 | 22.8x |
| Persistent Systems | India | 9.5 | 31.0x |
| Group median | 15.7x | ||
| Group average | 17.0x | ||
| This company | India | 39.4 | 26.0x |
Group median 15.7x; this company 26.0x — a 66% premium.
Group average 17.0x; against the average this company is at a 53% premium.
At the adjusted group median the market cap would be -39% versus today.
The gap and the implied upside are measured against the median: one richly priced peer moves an average, not a median. The market adjustment uses our coverage medians (US 21.9x, Russia 4.0x, South Africa 5.1x, Kazakhstan 6.4x, India 18.7x, Indonesia 4.6x); it is about where a name is listed, not what it does. Peer multiples come from the nightly rebuild of 2026-10-16; the company's own is live.
| Date | Per share | Details | Status | Source |
|---|---|---|---|---|
| 2026-10-16 | 12 INR | Ex-dividend: 12 INR per share | Paid | Yahoo Finance (ex-div) |
| 2026-07-17 | 12 INR | Ex-dividend: 12 INR per share | Paid | Yahoo Finance (ex-div) |
| 2026-04-24 | 24 INR | Ex-dividend: 24 INR per share | Paid | Yahoo Finance (ex-div) |
| 2026-01-16 | 12 INR | Ex-dividend: 12 INR per share | Paid | Yahoo Finance (ex-div) |
| 2025-10-17 | 12 INR | Ex-dividend: 12 INR per share | Paid | Yahoo Finance (ex-div) |
| 2025-07-18 | 12 INR | Ex-dividend: 12 INR per share | Paid | Yahoo Finance (ex-div) |
| 2025-04-28 | 18 INR | Ex-dividend: 18 INR per share | Paid | Yahoo Finance (ex-div) |
| 2025-01-17 | 18 INR | Ex-dividend: 18 INR per share | Paid | Yahoo Finance (ex-div) |
| 2024-10-22 | 12 INR | Ex-dividend: 12 INR per share | Paid | Yahoo Finance (ex-div) |
| 2024-07-23 | 12 INR | Ex-dividend: 12 INR per share | Paid | Yahoo Finance (ex-div) |
| 2024-05-07 | 18 INR | Ex-dividend: 18 INR per share | Paid | Yahoo Finance (ex-div) |
| 2024-01-19 | 12 INR | Ex-dividend: 12 INR per share | Paid | Yahoo Finance (ex-div) |
| 2023-10-20 | 12 INR | Ex-dividend: 12 INR per share | Paid | Yahoo Finance (ex-div) |
| 2023-07-20 | 10 INR | Ex-dividend: 10 INR per share | Paid | Yahoo Finance (ex-div) |
| 2023-04-28 | 18 INR | Ex-dividend: 18 INR per share | Paid | Yahoo Finance (ex-div) |
| 2023-01-19 | 10 INR | Ex-dividend: 10 INR per share | Paid | Yahoo Finance (ex-div) |
| 2022-10-19 | 10 INR | Ex-dividend: 10 INR per share | Paid | Yahoo Finance (ex-div) |
| 2022-07-19 | 10 INR | Ex-dividend: 10 INR per share | Paid | Yahoo Finance (ex-div) |
| 2022-04-28 | 18 INR | Ex-dividend: 18 INR per share | Paid | Yahoo Finance (ex-div) |
| 2022-01-20 | 10 INR | Ex-dividend: 10 INR per share | Paid | Yahoo Finance (ex-div) |
| 2021-10-21 | 10 INR | Ex-dividend: 10 INR per share | Paid | Yahoo Finance (ex-div) |
KASE: status follows wording in the news headline (paid vs intends to pay). Yahoo: amounts are cash dividends per share on ex-dividend dates (UTC calendar date). stockscope.uz (UZ): amounts are per share in UZS by publication date (not necessarily ex-div).
Reporting forms detected in loaded periods: ✓ ✓ ✓ (Balance sheet / Profit or loss (P&L) / Cash flows)
Financial results, valuation multiples (P/E, P/B, EV/EBITDA), profitability and dividend yield of HCL Technologies (HCLTECH) — from primary filings.
See also: The Cheapest Stocks in the World (2026): What Value Investing Says About Buying Cheap · global valuation map