Cleveland-Cliffs: EBITDA up sevenfold, but 9.6x leverage still caps the valuation

On 19 October Cleveland-Cliffs reported third-quarter 2026 results: revenue of $5,612 million (+18.5% year on year), adjusted EBITDA of $612 million versus $84 million a year earlier, and net income of $152 million after a $251 million loss. The EBITDA margin rose to 10.9% from 1.8%, but leverage of 9.59x LTM EBITDA and a 19.4x EV/EBITDA multiple leave the stock neutral: the recovery is priced in, and deleveraging is not yet confirmed.
Key takeaways
— Revenue accelerated to +18.5% on price, not volume: average selling price rose to $1,177 per ton from $1,032
— The $612 million EBITDA came from pricing: Steelmaking cash margin rose to $685 million from $205 million
— The $152 million net profit is cleaned of one-offs, but $148 million of net interest consumes almost the entire operating result
— Operating cash flow of $224 million does not cover interest and $152 million of capex
— Leverage of 9.59x EBITDA is the main valuation cap, and management promises to bring it below 2.5x by mid-next year
— A 19.4x EV/EBITDA multiple already prices in the recovery, while the 2027 guidance above $4 billion EBITDA is still words
Attractiveness
Key figures, USD bn
| Metric | Q3 2025 | Q3 2026 | Change |
|---|---|---|---|
| Revenue | 4.73 | 5.61 | +18.5% |
| EBITDA | 0.08 | 0.61 | +628.6% |
| Operating profit | -0.20 | 0.31 | to profit |
| Net profit | -0.25 | 0.15 | to profit |
| Operating cash flow | -0.14 | 0.22 | to profit |
| Capex | 0.16 | — | — |
| EBITDA margin | 1.8% | 10.9% | +9.1 pp |
| Net margin | -5.3% | 2.7% | +8.0 pp |
Revenue accelerated to +18.5% on price, not volume: average selling price rose to $1,177 per ton from $1,032
Third-quarter revenue was $5,612 million, up 18.5% year on year versus +5.9% in the second quarter – an acceleration. Price did almost all the work: average selling price per ton rose to $1,177 from $1,032 a year earlier.
Shipments rose only to 4.15 million tons from 4.03 million, about 3%. The price gain came from the market: the release cites extended lead times and low imports supporting US prices.
The Steelmaking mix – 46% hot-rolled, 31% coated, 15% cold-rolled – remains tilted toward automotive and distributors, which accounted for 28% and 34% of segment revenue. That makes revenue sensitive to industrial demand rather than spot prices.
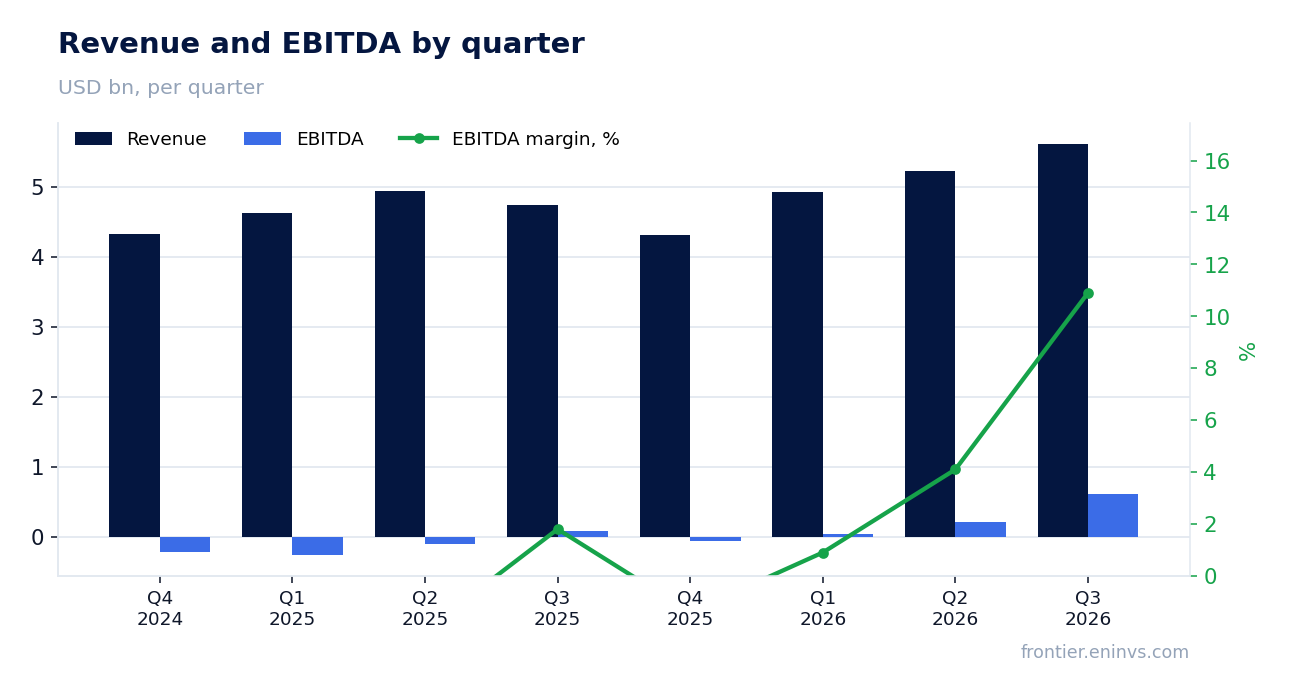
The $612 million EBITDA came from pricing: Steelmaking cash margin rose to $685 million from $205 million
Adjusted EBITDA was $612 million versus $84 million a year earlier, a 7.3x increase. The EBITDA margin rose to 10.9% from 1.8% – the strongest quarter in three years, according to CEO Lourenco Goncalves.
The source is visible in the segment: Steelmaking cash margin rose to $685 million from $205 million, while cash cost of goods sold rose only to $4,762 million from $4,356 million. Price per ton outran costs and delivered almost all of the EBITDA gain.
Segment gross margin turned positive at $454 million versus a $56 million loss a year earlier. Group operating profit was $311 million after a $204 million loss, so the improvement is not confined below the operating line.
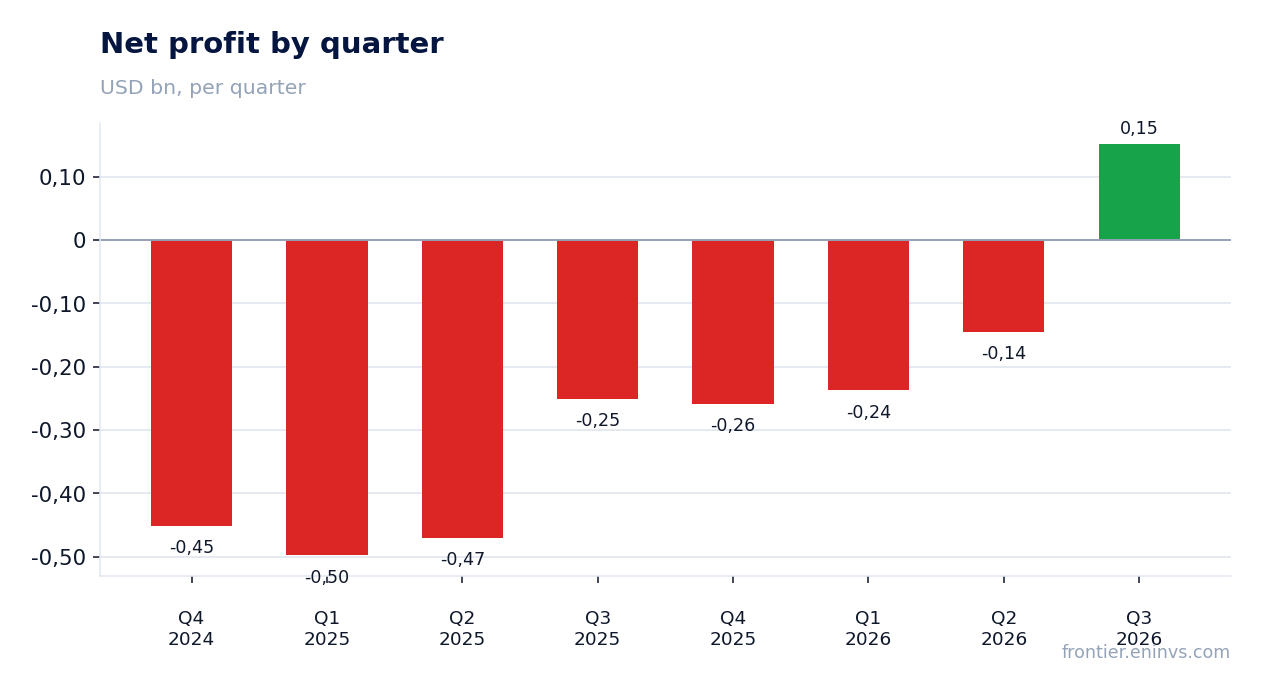
The $152 million net profit is cleaned of one-offs, but $148 million of net interest consumes almost the entire operating result
Net income attributable to shareholders was $152 million versus a $251 million loss a year earlier; net margin 2.7% versus -5.3%. Adjusted EPS was $0.28 versus -$0.45.
One-offs are small: adjustments for impairments, currency, derivatives and asset disposals total about $9 million pre-tax. The profit is therefore mostly operating, not accounting.
The drag is interest: net interest expense was $148 million against $311 million of operating profit. Almost half of the operating result goes to creditors, a direct consequence of $7.6 billion of balance-sheet debt.
Operating cash flow of $224 million does not cover interest and $152 million of capex
Operating cash flow for the quarter was $224 million versus an outflow of $143 million a year earlier. The improvement is real but modest against $612 million of EBITDA: working capital absorbed part of it – receivables rose $116 million and inventories $170 million.
Capex was $152 million, leaving free cash flow after investment of about $72 million. That is not enough to cut debt meaningfully without the asset sales management mentions.
For nine months operating cash flow was $129 million and capex $461 million. The year as a whole is not yet generating free cash, and that is the key constraint on deleveraging.
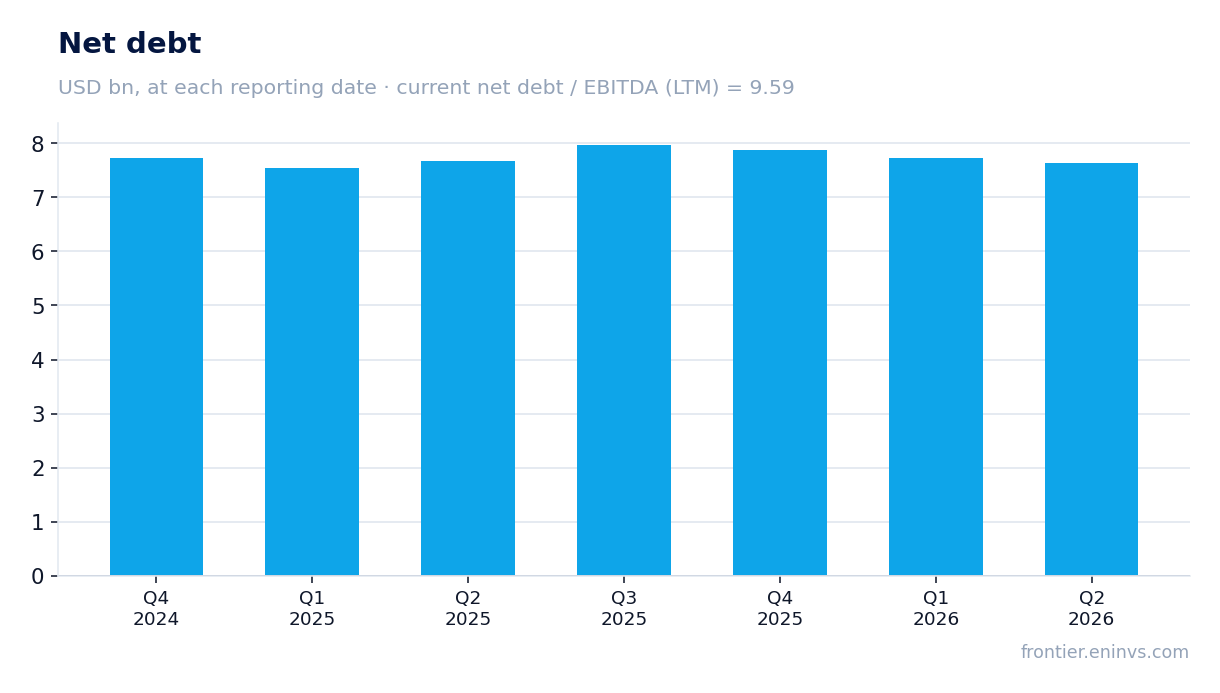
Leverage of 9.59x EBITDA is the main valuation cap, and management promises to bring it below 2.5x by mid-next year
Net debt at the latest annual balance-sheet date was $7,880 million, or 9.59x trailing-twelve-month EBITDA. That is a level, not a trend: the facts contain no prior-period comparison, so no claim of rising or falling leverage can be made.
Management says debt was reduced in the third quarter and expects a "major" reduction in the fourth from free cash flow and property sale proceeds. The target is below 2.5x EBITDA by the middle of next year.
Balance-sheet long-term debt is $7,645 million and liquidity $3.2 billion. For a company with a market capitalisation of about $8 billion, leverage remains the defining valuation factor: at 9.59x, any price slowdown makes debt service heavy again.
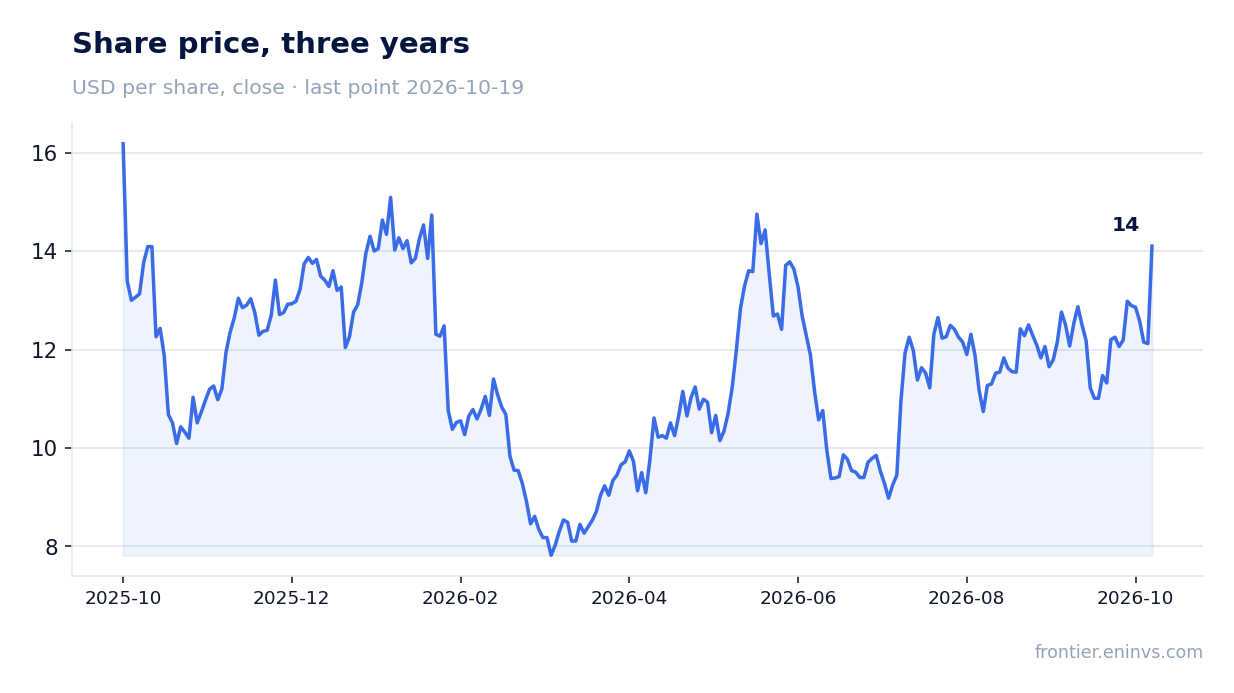
A 19.4x EV/EBITDA multiple already prices in the recovery, while the 2027 guidance above $4 billion EBITDA is still words
With a market capitalisation of about $8,034 million and net debt of $7,880 million, EV/EBITDA on trailing twelve months is 19.4x. That is a rich multiple for a steelmaker at 9.59x leverage: the market is paying for recovery, not current earnings.
Management guides fourth-quarter EBITDA to about $715 million, above the third quarter on pricing. For 2027 it expects EBITDA above $4 billion based on new contracts and index forecasts.
If the guidance is met, the multiple compresses quickly: at $4 billion of EBITDA and the current EV, the ratio would fall to roughly 4x. But that is a forecast, not a fact, and it rests on prices the company does not control.
Valuation on the latest reported figures
| Metric | Value |
|---|---|
| Market cap | 8.03 bn USD |
| EV/EBITDA (LTM) | 19.4 |
| P/B | 1.31 |
| Net debt / EBITDA (LTM) | 9.59 |
| Operating cash flow (LTM) | 0.12 bn |
| ROE | 3.5% |
Bottom line
The third quarter was genuinely strong: $612 million of EBITDA, a 10.9% margin, and $152 million of net income after a loss a year earlier. But price, not volume, delivered almost all of it, and interest consumes half of operating profit. Leverage of 9.59x EBITDA and a 19.4x EV/EBITDA multiple leave the stock neutral: the recovery is priced in, and deleveraging is not yet confirmed by cash. Verdict – neutral.
Open the company's financial profile CLF →
See also: market overview · valuation map · stock screeners