LUKOIL: about RUB 1,000 of dividends for 2026 and +10% to the price. Beyond the next half-year, the forecast is a bet on the refining margin
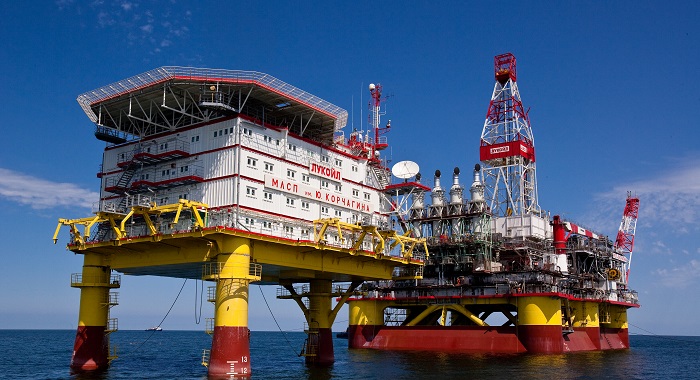
LUKOIL is Russia's second-largest oil producer and the country's largest private oil company. In 2025 the company produced 74.9 mn t of crude and refined 41.7 mn t at its Russian refineries, or 56% of production. Since November 2025 the international business is no longer in the accounts: after US sanctions the company lost control over it and wrote it off. The share trades at RUB 5,372 (Moscow Exchange, 26.09.2026), a market capitalisation of about RUB 3.15 trn.
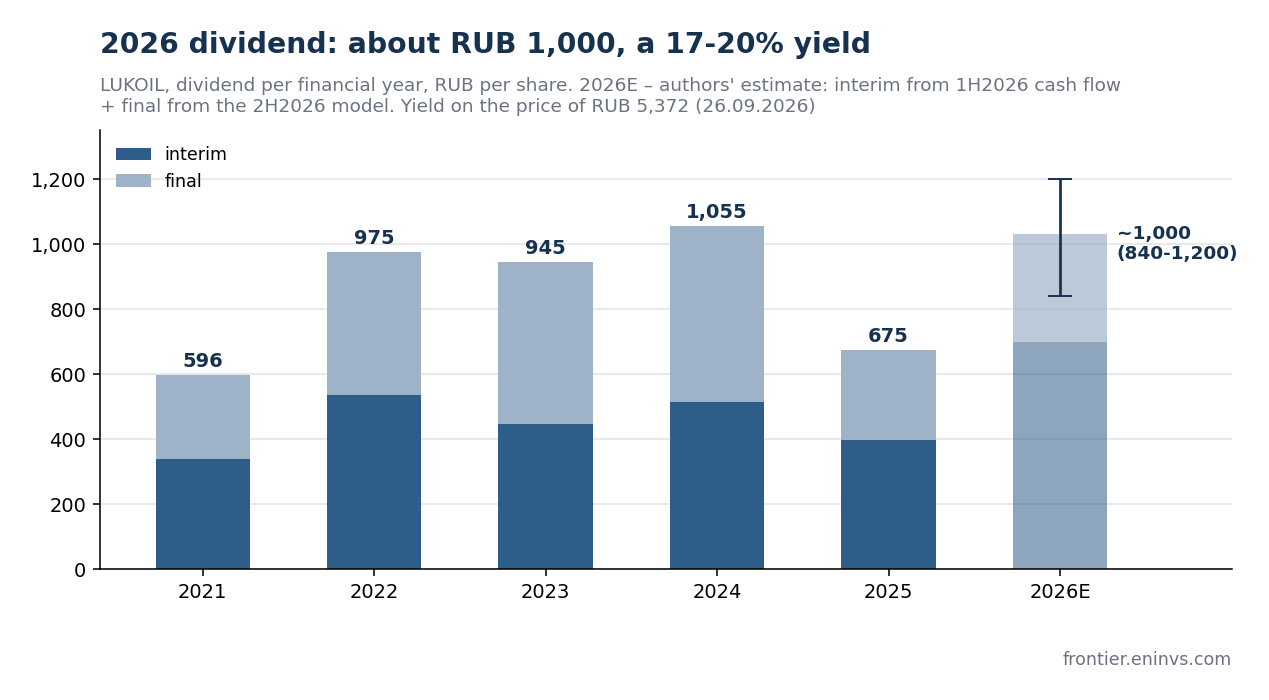
Conclusion: rather attractive. We estimate the 2026 dividend at about RUB 1,000 per share, a 17-20% yield against a 14% key rate. More than half of this amount has already been earned: the 1H cash flow is sitting in the accounts and will fund the interim payout. Under our valuation approach for commodity companies, price upside is about +10% (target price RUB 5,900), and −6% in the scenario of last three years' prices. Including the dividend, the expected one-year return is about 29%, and about +10% in the bad scenario.
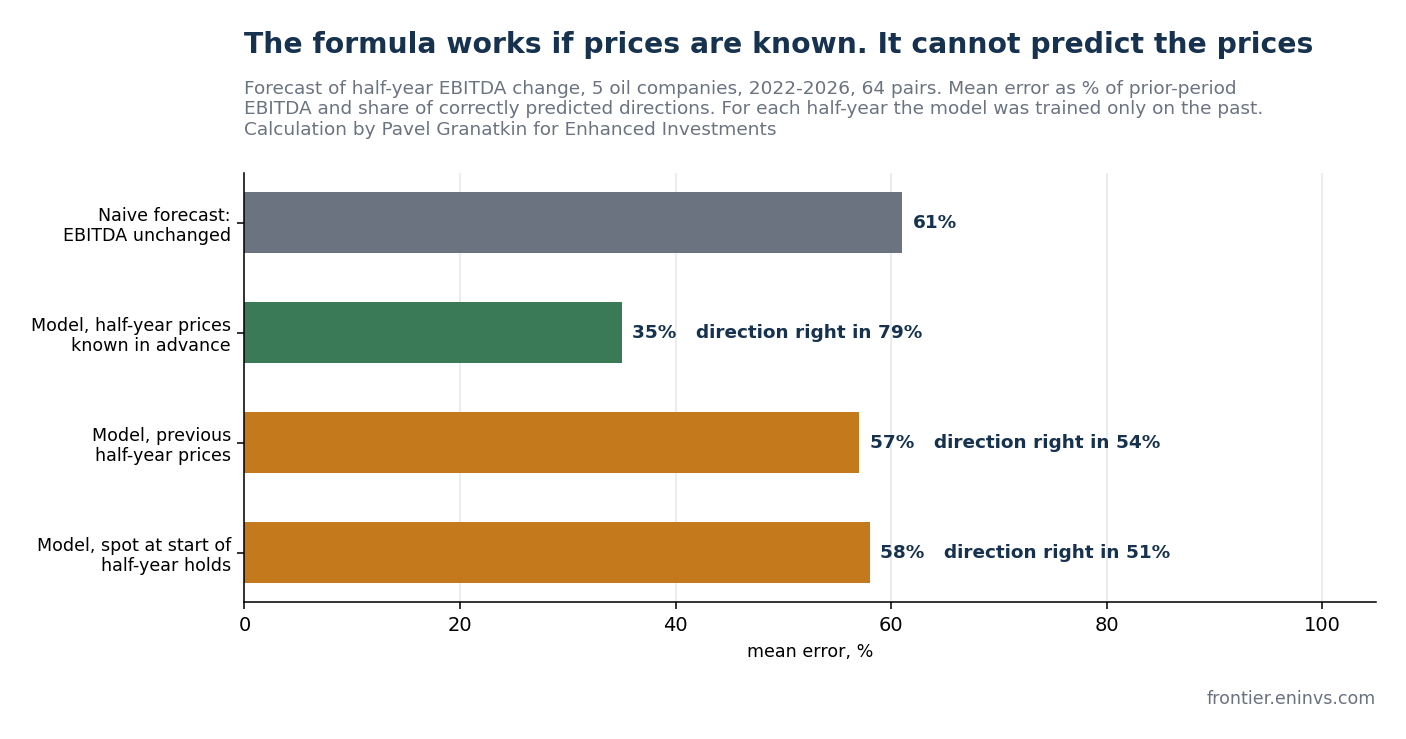
The main caveat is the earnings forecast beyond the next half-year. All of the 2026 growth came from the refining margin, which is currently more than twice its norm. Our model translates prices into EBITDA well, but it cannot predict the prices themselves, and without them its six-month forecast is barely better than a simple "EBITDA will not change". This is why we give ranges below rather than a single number.
The model, the historical backtest and much of the calculations for this review were done by Pavel Granatkin. The company card on the portal with financials by period: LUKOIL. Where a figure is our estimate, it is marked as such.
The 2026 dividend is about RUB 1,000, and more than half is already earned
Fact. Under its dividend policy, LUKOIL pays shareholders at least 100% of adjusted free cash flow: operating cash flow minus capex, interest, leases and share buybacks. The interim dividend is formally declared for nine months but calculated from the half-year accounts. For 2025 the company paid RUB 675 (397 interim and 278 final), for 2024 – RUB 1,055.
Authors' estimate. In practice the payout is below 100% and varies noticeably. Interim payouts in 2023-2025 were 80-88% of 1H cash flow, final payouts 56-85% of 2H cash flow, 73% on average for the year. 1H2026 cash flow was RUB 519 bn (operating cash flow of 790 bn minus capex of 239, interest of 16, leases of 11 and buybacks of 5 bn). At the usual 80-88% payout this means an interim dividend of RUB 715-785 per share. The dividend is divided by 581.3 mn shares: shares held by group companies are excluded.
But these 519 bn include 115 bn of working capital inflow, mainly higher taxes payable and accounts payable. In the second half this inflow is likely to reverse. If the board excludes it, the result is RUB 555-610. After the report brokers expected RUB 411-602 (Sinara, Tsifra Broker, Alfa, BCS, 28.08.2026). Last year the board recommended the interim dividend on 21 November.
The final dividend will depend on the second half. Our model puts 2H cash flow at RUB 235-345 bn, which at a 70% payout means RUB 285-415. For the whole of 2026 this gives RUB 840-1,200, about RUB 1,000 at the midpoint. The 2027 payout is about RUB 860 at current forwards, and about RUB 410 (7.6% yield) at USD 60 Brent with the refining margin back to normal.
1H EBITDA rose 45%, and all of the growth came from refining
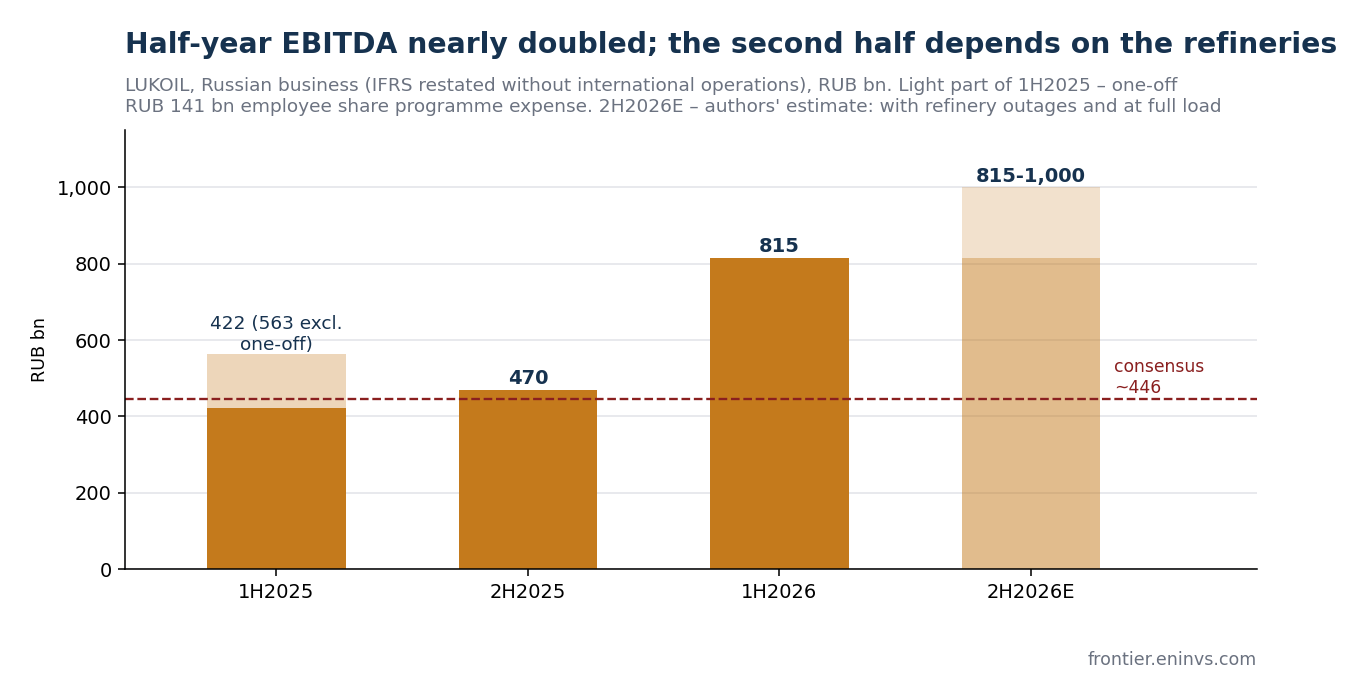
Fact (IFRS 1H2026). Revenue of the Russian business rose 8% to RUB 2,059 bn, EBITDA nearly doubled from 422 to RUB 815 bn, a 39.6% margin. Last year's base includes a one-off RUB 141 bn expense for the employee share programme. Excluding it, growth was 45%. Net income attributable to shareholders was RUB 431 bn versus 88 bn a year earlier.
Authors' estimate. The rouble price of Urals barely changed over the year, at about RUB 5,200 per barrel: Brent rose from USD 71 to 87, but the rouble strengthened from 87 to 77 RUB/USD, and the Urals discount widened from USD 12 to 20. The growth came from the refining margin. The spread between the product basket and Urals including the damper rose from 2,470 to 4,230 RUB per barrel, and taxes and duties fell by RUB 100 bn. The damper is a budget payment to oil companies for supplying fuel to the domestic market; in the accounts it reduces taxes.
Fact. As of 30 June the company had RUB 661 bn of cash and 36 bn of short-term investments versus 319 bn of debt including leases. Net cash is RUB 378 bn. After deducting minority interests (248 bn, mainly mutual funds holding shares for employees), 131 bn remains for valuation. Interest income (44 bn for the half-year) is twice interest expense (22 bn).
The second half will be weaker than the model: drone strikes halted all three large refineries
Fact. In 1H LUKOIL refined 18.8 mn t, 9.6% less than a year earlier. According to Reuters, the Volgograd refinery stopped on 31 July, NORSI in Kstovo on 26 August, and Perm on 21 August, and after a restart Perm stopped again on 25 September following an attack. Together these three plants account for 46 of the company's 51 mn t of capacity. Official refining statistics have been closed since 2024, so nobody has exact refinery utilisation, only estimates.
Authors' estimate. Every 10% drop in refining costs LUKOIL about RUB 67 bn of EBITDA and RUB 61 of dividend per year at current prices. Crude that could not be refined is sold as crude, so only the refining margin is lost, not the whole revenue. At full refinery load the model expects about RUB 1,000 bn of EBITDA in 2H, and about 815 bn if refining falls to 35% of production. We think the second case is closer to reality.
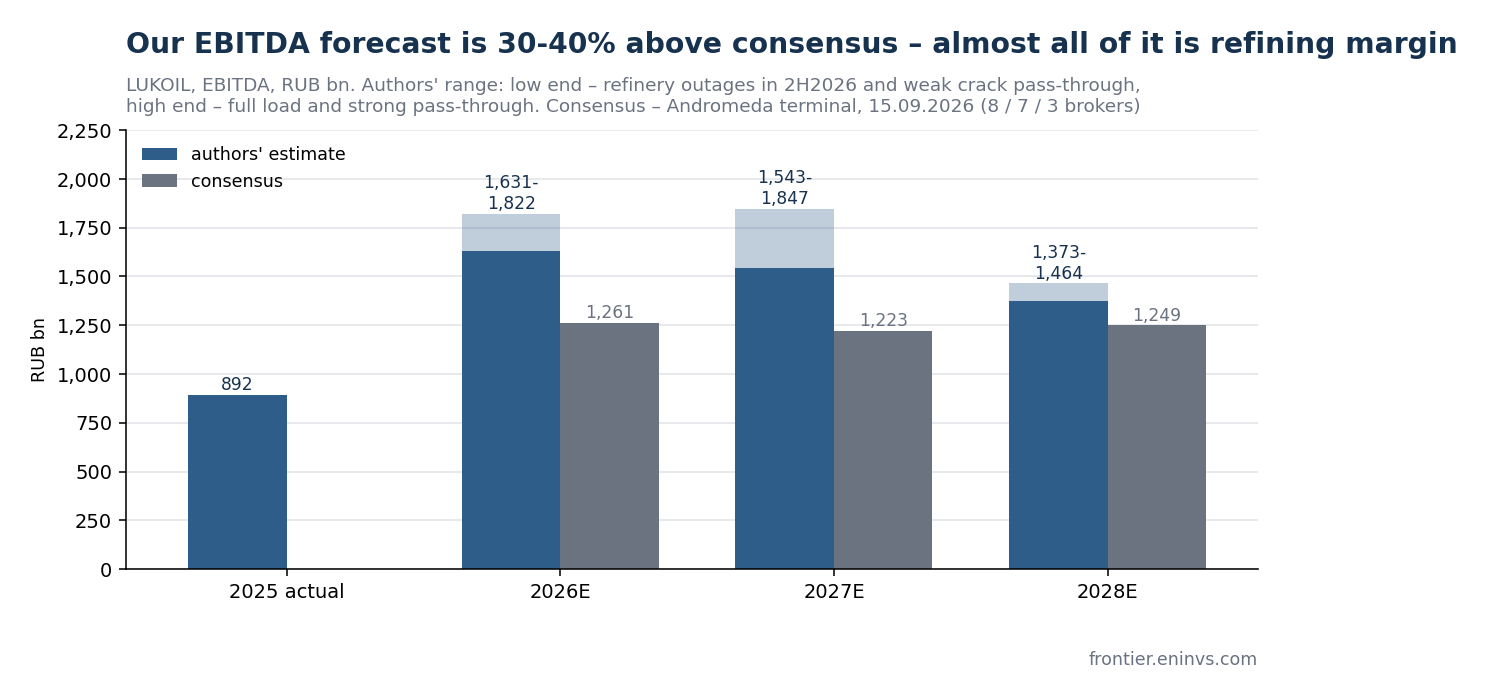
The Andromeda terminal consensus for 2026 (1,261 bn) implies only about 446 bn in 2H, almost half of 1H. In our view it has not been updated since the report: the forecast update date in the terminal is blank, while the board and brokers after 28 August expect payouts that do not square with such a second half.
The refining margin is now more than twice its norm, and the 2027 forecast rests on it
Fact. Due to the crisis around the Strait of Hormuz, diesel rose more than crude in 2026. According to the portal, LUKOIL's refining margin including the damper was about 7,800 RUB per barrel in September versus a three-year average of 3,400. In August the industry received RUB 197 bn of damper payments versus 113 bn a month earlier (Ministry of Finance). Gasoline exports are banned until the end of January 2027 and diesel exports until the end of October, so the high European price reaches Russian companies mainly through the damper.
Authors' estimate. EBITDA forecast: RUB 1.63-1.82 trn in 2026, 1.54-1.85 trn in 2027 and 1.37-1.46 trn in 2028. This is 30-40% above consensus. More than half of the gap comes from the refining margin, which ICE forward curves keep at about three times the norm in 2027, declining gradually. The low end reflects refinery outages and weak margin pass-through into EBITDA, the high end full load and strong pass-through.
LUKOIL depends on crude less than it seems: plus or minus USD 10 of Brent changes 2027 EBITDA by about RUB 120 bn (7%), as most of the price gain is taken by the mineral extraction tax, the additional income tax and a lower damper. A 5 RUB/USD stronger rouble removes about 81 bn. The strongest factor is the refining margin: if the excess margin disappears within three months rather than as slowly as the forwards assume, the 2027 dividend would fall by about RUB 160.
How far to trust the model: the formula works, but it cannot guess prices
We separately tested how the model predicts earnings. It recalculates last-twelve-month EBITDA at new prices: 25-30% of a change in the rouble Urals price reaches EBITDA (taxes take the rest), as does about half of a change in the refining margin including the damper.
If prices are known, the formula works. Across six oil companies over 1H2025-1H2026, the model's mean error is 15-16% versus 32% for a "same as last half-year" forecast, and the direction of change was right in 86% of cases. For LUKOIL the error ranges from −8% to +7%. Pavel tested the formula on a longer history, 64 half-year pairs over 2022-2026, training the model only on the past: 35% versus 61% for the naive forecast.
If prices have to be guessed, the advantage almost disappears. When the model was given only what was known at the start of the half-year (spot holds, or prices as in the previous half-year), the error rose to 57-58% versus 61% for the naive forecast, and the direction was right in 51-54% of cases, no better than a coin toss. For LUKOIL alone there is no advantage at all. The previous version of the portal model, which carried spot forward for a year, missed 12-month EBITDA by 47% on average, worse than the naive forecast.
The refining coefficient rests on a single half-year. Before 2026 the refining margin and EBITDA barely moved together, and over the whole history coefficients from 0.2 to 0.7 fit equally well. Only 1H2026 distinguishes between them. Across the panel about 0.5 works best; LUKOIL's own pass-through appears higher, as it has the largest share of petroleum products in exports. The choice of coefficient is worth RUB 100-150 of the 2027 dividend and RUB 400-450 of the target price.
Takeaway for investors. The forecast for the next half-year, where prices are mostly known already, is reliable within ±25%. The 2027 forecast is a price scenario, not a prediction. An honest range for 12-month EBITDA including price risk is about ±30%. From this season we store every forecast together with the prices it was based on, and after the 2026 report we will show how it played out.
The share is 1.5-2 times cheaper than peers on EV/EBITDA, and there are reasons for it
Fact (portal, IFRS). LUKOIL trades at about 2.1x LTM EV/EBITDA versus 3.2x for Rosneft, 4.1x for Gazprom Neft and 4.0x for Tatneft. Only Bashneft (2.1x), with a small free float, is equally cheap. LUKOIL's own three-year median is 1.8x.
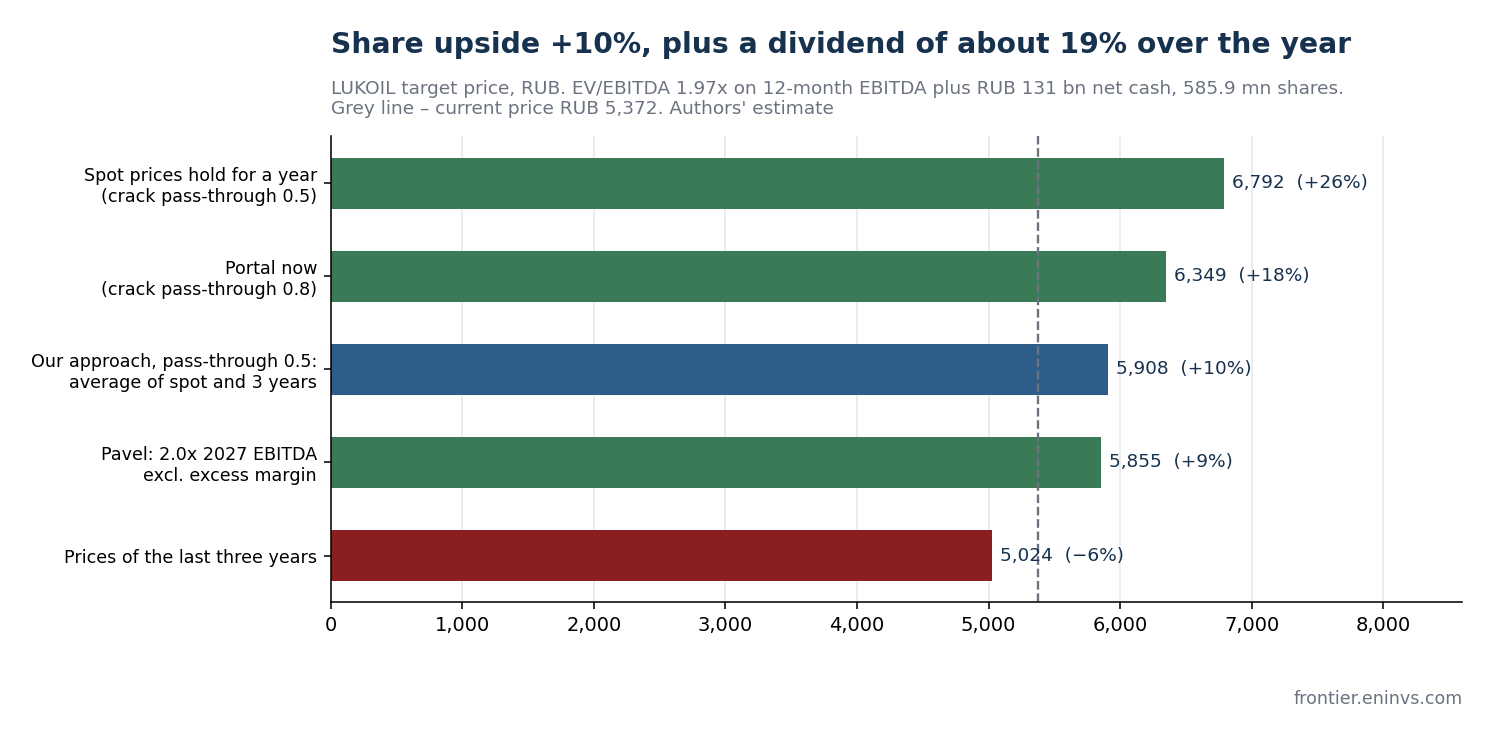
Authors' estimate. Under our valuation approach for commodity companies, the target value is LUKOIL's historical multiple (1.97x) applied to a conservative 12-month EBITDA: the average of a scenario where today's prices hold and a scenario of last three years' prices. If today's prices are above the three-year average, this average is used rather than spot. This gives about RUB 1.69 trn of EBITDA and RUB 5,900 per share, +10%. Pavel's model reached a similar figure by a different route – 2.0x 2027 EBITDA excluding the excess margin: RUB 5,855 (+9%). If spot holds for a year, the target is RUB 6,800 (+26%); at three-year prices, RUB 5,020 (−6%).
The portal currently shows +18%: it assumes a refining margin pass-through of 0.8. The backtest showed this is too high, and we are moving the model to 0.5.
Authors' assumption. The discount to peers can be explained. LUKOIL itself is on the US sanctions list, has lost its international business, has stopped disclosing segments and revenue structure, and 107 mn treasury shares (15.4% of capital) have still not been cancelled. 91 mn of them were bought in 2025 from non-residents at an average of RUB 7,200. This stake does not affect dividend per share, but until it is cancelled there is a risk it will be sold into the market. Valuation at Rosneft's multiple would give about RUB 8,800, but that requires an exit from sanctions.
International assets are written off to zero – any sale proceeds would be upside, but not soon
Fact (company accounts, OFAC). On 21 November 2025 LUKOIL lost control over LUKOIL International and wrote off the investment. In January 2026 the company signed a non-exclusive agreement with Carlyle to sell this business excluding the Kazakh assets. The deal has not closed: an OFAC licence permits negotiations, and sale proceeds must go to a blocked account in the US until sanctions are lifted. The company's accounts refer to the same special account.
Authors' assumption. The loss is already in the accounts. Sale proceeds, if any, would be a plus, but are unlikely to affect dividends in the coming years. What LUKOIL effectively retains are its stakes in Karachaganak, Tengiz and CPC in Kazakhstan.
The main risks are refinery outages, fast margin normalisation and taxes
- Refinery outages. In 2H all three large refineries stopped after attacks. A decree of 24 August 2026 allows the state to introduce temporary management of facilities that the owner failed to protect or restore in time.
- Fast margin normalisation. A US-Iran deal would quickly bring Brent back to USD 75-85 and compress the diesel margin. The 2026 dividend barely depends on this, as three quarters have already passed at high prices, but the 2027 dividend could halve.
- Damper and export bans. The high margin reaches the company through rules that the government changes every few months.
- Taxes. The 2026 budget deficit is expected at about 3% of GDP. Published materials contain no new levies on the oil sector, but the risk of them appearing is high.
- Sanctions, a strong rouble and the uncancelled 15.4% treasury stake. Reserves under the last disclosed audit cover more than 20 years of production, but reserve disclosure has been frozen since 2021.
Bottom line
Without its international business LUKOIL has become simpler and more profitable: the Russian business earned RUB 815 bn of EBITDA in the half-year, the company has 378 bn of net cash and no debt burden. The 2026 dividend of about RUB 1,000 (17-20%) is mostly already earned, and price upside under our approach is about +10%. The main driver and the main risk are the same – the refining margin: it is now more than twice its norm, and the company's refineries stood idle after attacks in 2H. The 2027 forecast is a price scenario, and we present it as a range.
What we will watch: the board's decision on the interim dividend (expected in the second half of November) and whether it excludes the working capital inflow; 3Q operating data and the timing of refinery restoration; decisions on the damper and diesel exports after October; US-Iran negotiations.
Sources
- LUKOIL IFRS for 2024-2025 (audited by Kept) and for 1H2025-1H2026 (review), disclosed versions; dividend policy and materials for the 23.04.2026 shareholder meeting – lukoil.ru.
- Prices and dividends – Moscow Exchange (ISS), price as of 26.09.2026. Urals – Ministry of Economic Development, damper and oil and gas revenues – Ministry of Finance, exchange rate – Bank of Russia, forward curves – ICE.
- Refinery outages – Reuters; sanctions and the international asset deal – OFAC, company press releases; dividend forecasts – Sinara, Tsifra Broker, Alfa-Bank, BCS (28.08.2026).
- Consensus – Andromeda terminal (Euler), downloaded 15.09.2026. Peer multiples – Frontier portal, IFRS.
- EBITDA and dividend model and backtest – Pavel Granatkin and Enhanced Investments, base case as of 25-26.09.2026.
Reviews of other issuers and weekly analytics are in the Enhanced Investments Telegram channel, company cards are on the portal.
Open the company's financial profile LKOH →
See also: market overview · valuation map · stock screeners