MTS Bank: low valuation and double-digit dividends, but organic business growth is still weak
MTS Bank is the retail bank of the MTS group, listed since April 2024. The share trades at RUB 916 (MOEX, 30.09.2026), for a market capitalisation of RUB 34.4 bn. Since the IPO at RUB 2,500 the stock has lost 63%. The bank now trades at 0.32 of its equity, the latest dividend yields 10.5% at the current price, and ROE is back in double digits after the slump of 2025.
The share trades at a third of the bank's equity and yields 10.5% in dividends, but organic business growth is still weak.
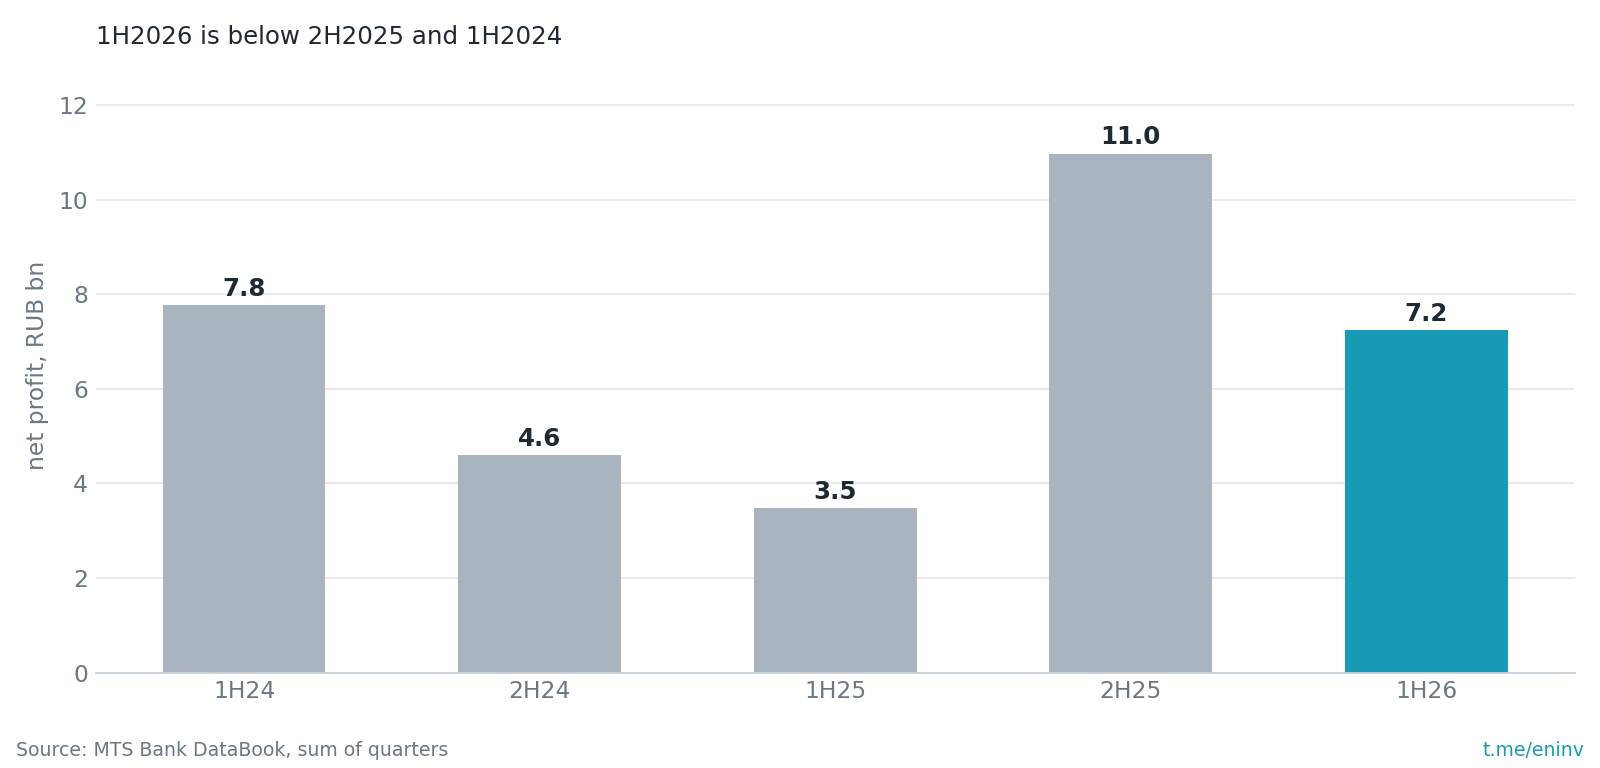
1H2026 profit is double last year's, but below 2H2025 and 1H2024.
ROE is back in double digits: 17.6% in 2Q under the bank's methodology and 13.5% after perpetual bond coupons.
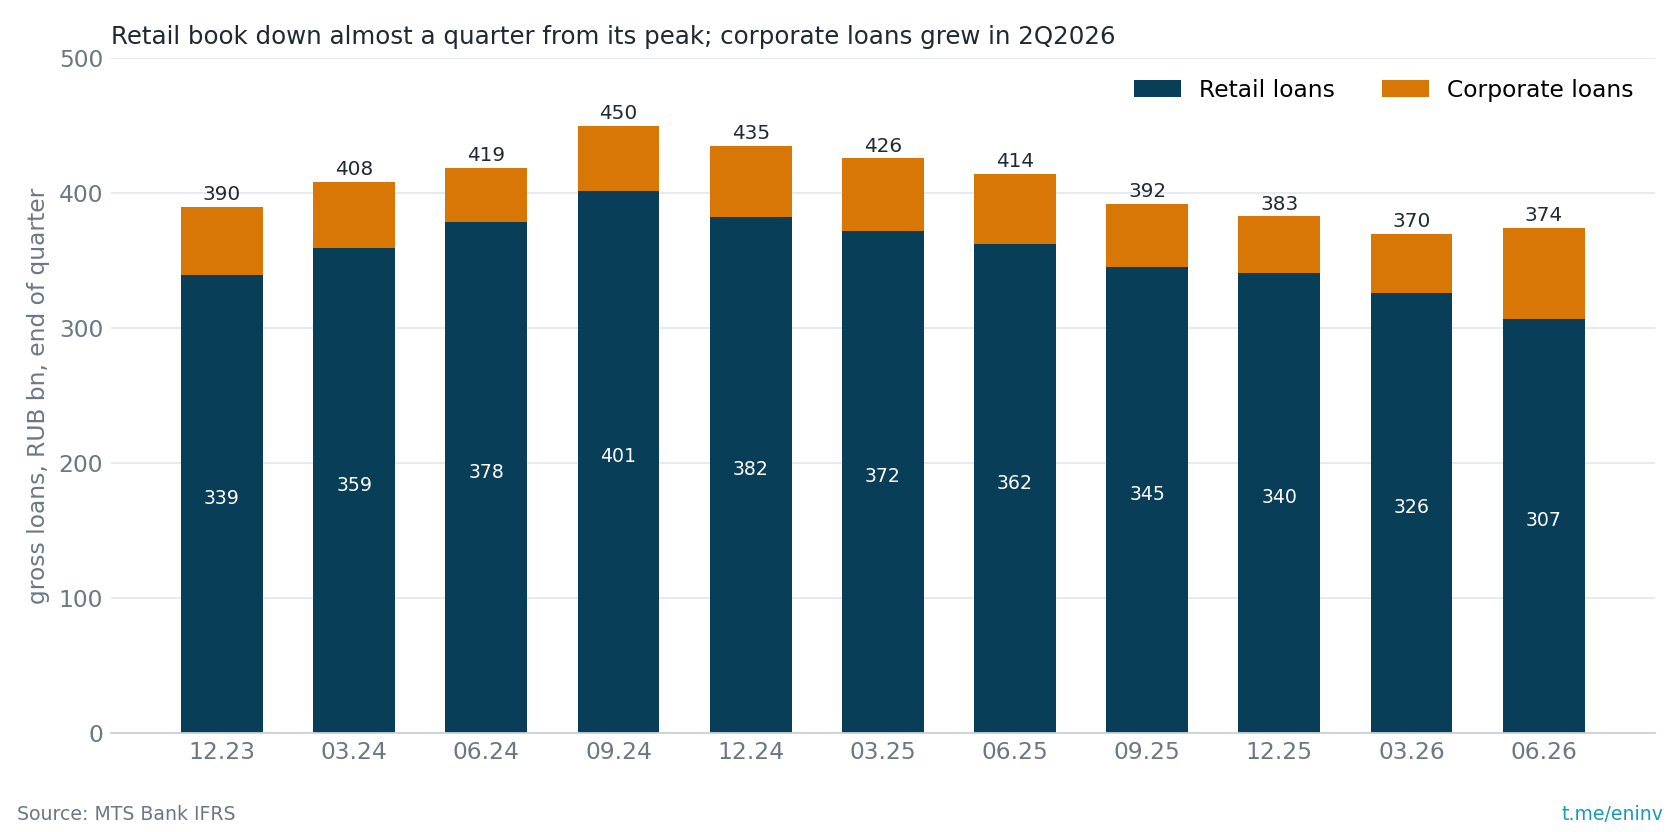
The loan book is shrinking, and the market does not like it. On the other hand, portfolio yield, corporate lending and the client base are growing.
Interest income grew mainly thanks to bonds and cheaper deposits; income from loans declined.
If ROE for 2026 is 15-20%, the dividend under the current payout approach will be RUB 109-148 by our estimate (11.9-16.2% of the current price).
We value the share at RUB 1,000-1,600, with the earnings-based valuation closer to the lower end.
Based on monthly reporting, we estimate 3Q profit at about RUB 4 bn, below 2Q and a third lower than last year.
For the share to become interesting, it needs a strong report, further growth in ROE and dividends, and a market valuation closer to book value.
Profit has recovered from a low base but has not yet exceeded the 2024 level
In 2Q2026 the bank earned RUB 4.7 bn versus 2.5 bn a year earlier (+90%), and 7.2 bn versus 3.5 bn for the half-year. This growth reflects a low base: from 4Q2024 to 2Q2025 the bank earned only RUB 0.5-2.5 bn per quarter.
Comparing adjacent half-years gives a more modest picture. 1H2026 profit (7.2 bn) is a third lower than in 2H2025 (11 bn) and slightly lower than in 1H2024 (7.8 bn).
The good news is return on equity. ROE shows how much the bank earns in a year on each rouble of its own equity. Under the bank's methodology it was 24.5% in 3Q2025, 19.0% in 4Q, 9.3% in a weak 1Q2026 and 17.6% in 2Q.
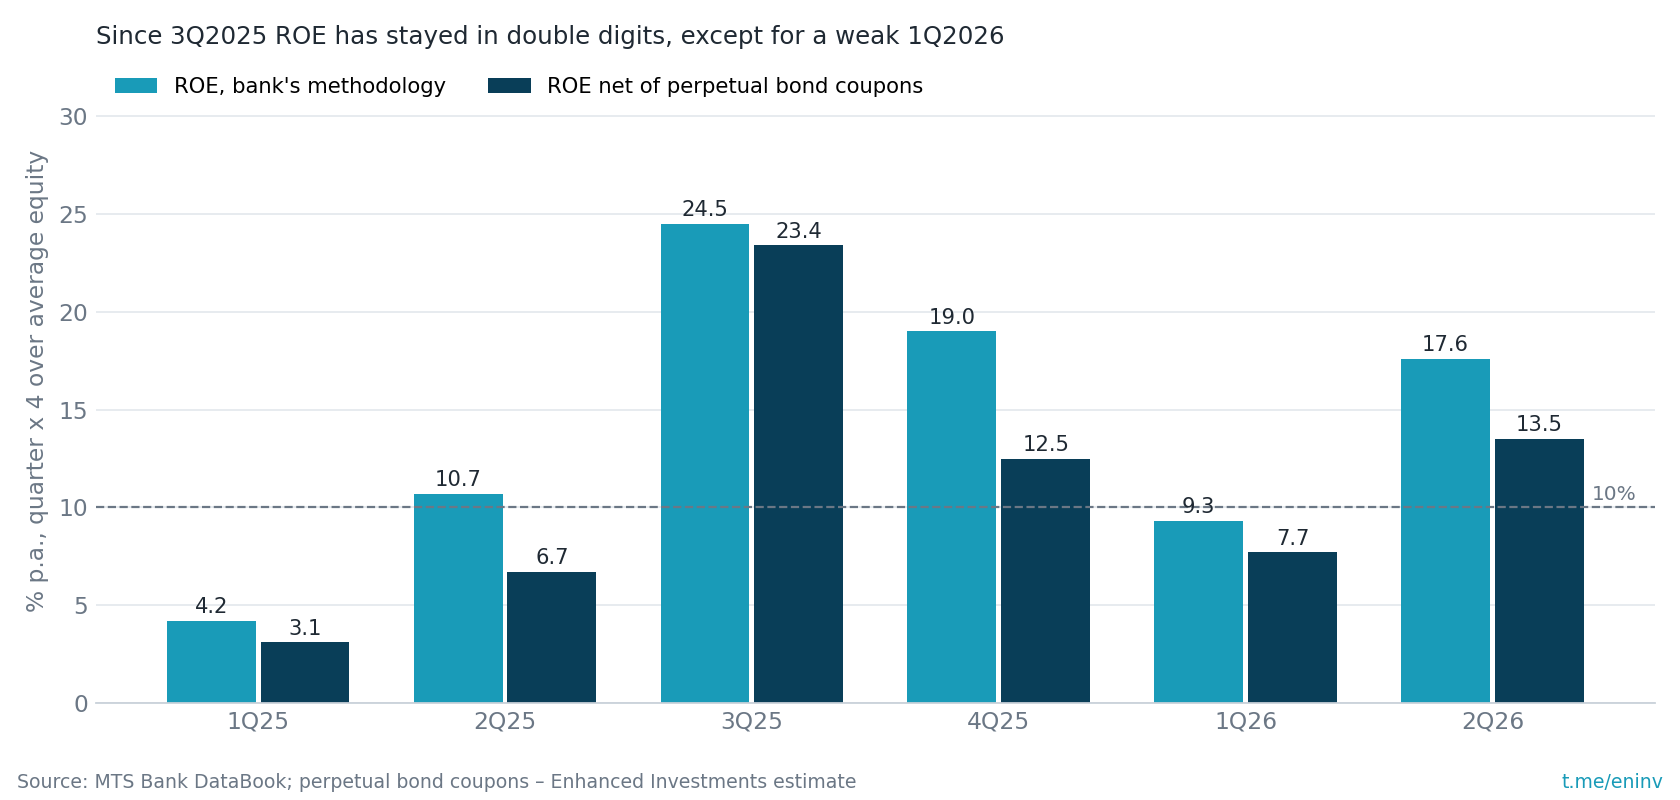
The bank has RUB 19.5 bn of perpetual bonds. Formally they count as equity, but in substance they are debt: the coupons (about 16% a year) are paid out of profit ahead of shareholders. The bank calculates ROE on equity excluding these bonds but does not deduct the coupons from profit. Including coupons, ROE was 13.5% for 2Q and 13.8% for the last 12 months.
What matters more for an investor is not year-on-year growth but whether ROE can stay above 10-15% without the low-base effect. In three of the last four quarters it was above 15% under the bank's methodology.
The loan book is shrinking but earning more
The retail loan book peaked in September 2024 at RUB 401 bn and has been shrinking for seven quarters in a row since then. As of 30 June 2026 it stood at RUB 307 bn, 23% below the peak. The total gross loan book is now RUB 374 bn versus 450 bn at the peak. For the market this is the main negative: if lending does not grow, there is nowhere for lending profit to grow from.
But the contraction has another side. Below is what has changed inside the bank. Brackets indicate whether a point is based on reported figures or on management's statements.
- Retail book mix (reported figures). There are fewer POS loans, which are issued in stores: RUB 58.4 bn in September 2024 and 24.5 bn in March 2026. The share of credit cards in unsecured loans rose from 25.9% to 35.4%. However, it rose because everything else shrank: cards themselves are not growing (104 bn at the peak, 100 bn now). The average yield on retail loans rose from 19.6-19.9% in 2024 to 21.5-21.9% in recent quarters. How much of this came from the change in mix and how much from rates cannot be determined from the reports. Net interest margin over the same period rose from 5.8% to 8.5%.
- Fees (reported figures). Net fee and commission income fell from RUB 23.2 bn in 2024 to 15.2 bn in 2025. Almost all of the decline came from agency fees on insurance sold together with loans: 11.1 bn in 2024, 5.4 bn in 2025 and another 1.3 bn less in 1H2026. Income from settlement operations grew by 1.1 bn in 1H. According to management, the payments business is growing fast: 76.3 mn transactions through MTS Pay in the half-year, payment services turnover above RUB 1 trn, debit card turnover +25%, retail current account balances +42%. Payment services account for 29% of net fee income versus 19% a year ago. By our recalculation from these shares, payments income rose from about 1.5 to 1.9 bn per half-year, i.e. by a third. On the bank's scale this is still small, and payments growth does not offset the loss of insurance fees.
- Corporate loans (reported figures). Grew from 44 to 67 bn in 2Q2026.
- Cost of funding (reported figures). The average rate on borrowed funds fell from 16.4% in 1H2025 to 13.0% in 1H2026. According to the presentation, the share of current accounts in customer funds rose from 18% to 23%.
- Team (reported figures). Since November 2025, investments and premium banking have been headed by Sergei Maltsev, who previously ran Private Banking at T-Bank.
- Ecosystem and clients (management view). 62% of the bank's clients are MTS subscribers, the bank now acquires 8 times more clients through ecosystem channels, active clients number 5.8 mn (+81% year on year), and debit card turnover grew by 25%.
The bank is currently earning on quality, not volume. It can operate this way for quite a while, but to grow profit it will sooner or later have to expand the loan book again.
Provisions remain high, although for credit cards they have halved
Cost of risk (CoR) shows what share of the loan book the bank sets aside in a year as provisions against defaults. At MTS Bank it was 7.9% in 1Q2026 and 6.7% in 2Q. At Sber it was 1.2% for 1H2026, at VTB 0.9%. MTS Bank mainly issues unsecured loans and credit cards, and such borrowers are the first to stop paying when money becomes more expensive.
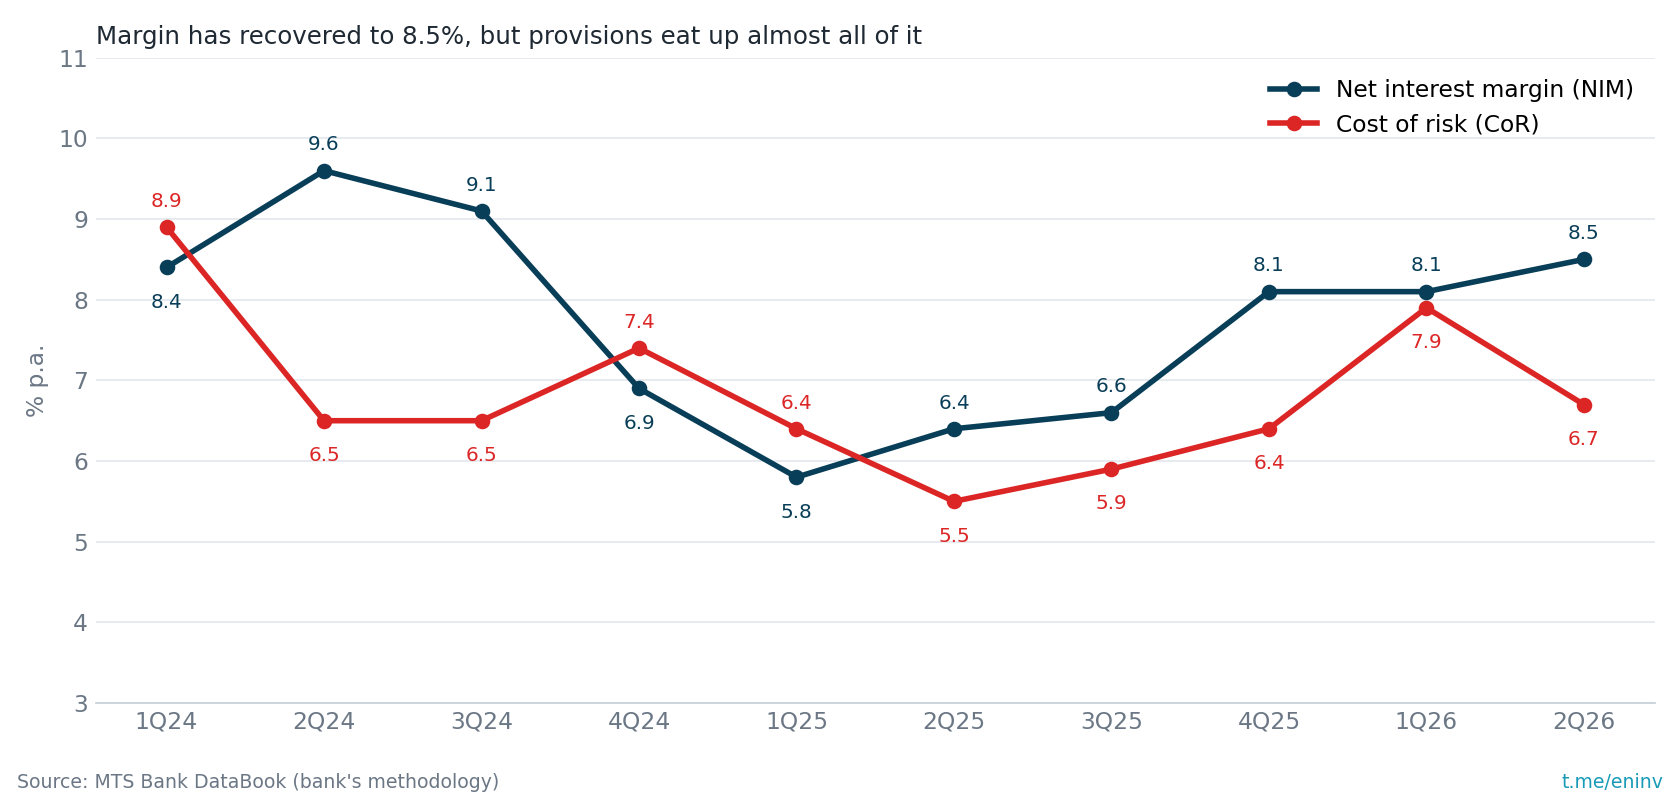
The picture is improving for individual products. According to the presentation, cost of risk on credit cards fell from 12.6% in 2024 to 6.5% in 2025, and for retail as a whole from 8.5% to 6.6%.
In 2Q2026 problem retail debt (Stage 3) fell from RUB 34.9 bn to 28.2 bn, and provisions against it from 24.3 bn to 16.3 bn. The bank does not comment on this in its reports.
Provisions are the biggest driver of the bank's profit. Each percentage point of cost of risk on a RUB 374 bn book equals about RUB 2.8 bn of after-tax profit, roughly a fifth of 2025 profit.
Profit grew thanks to bonds and cheaper deposits; fees reduced it
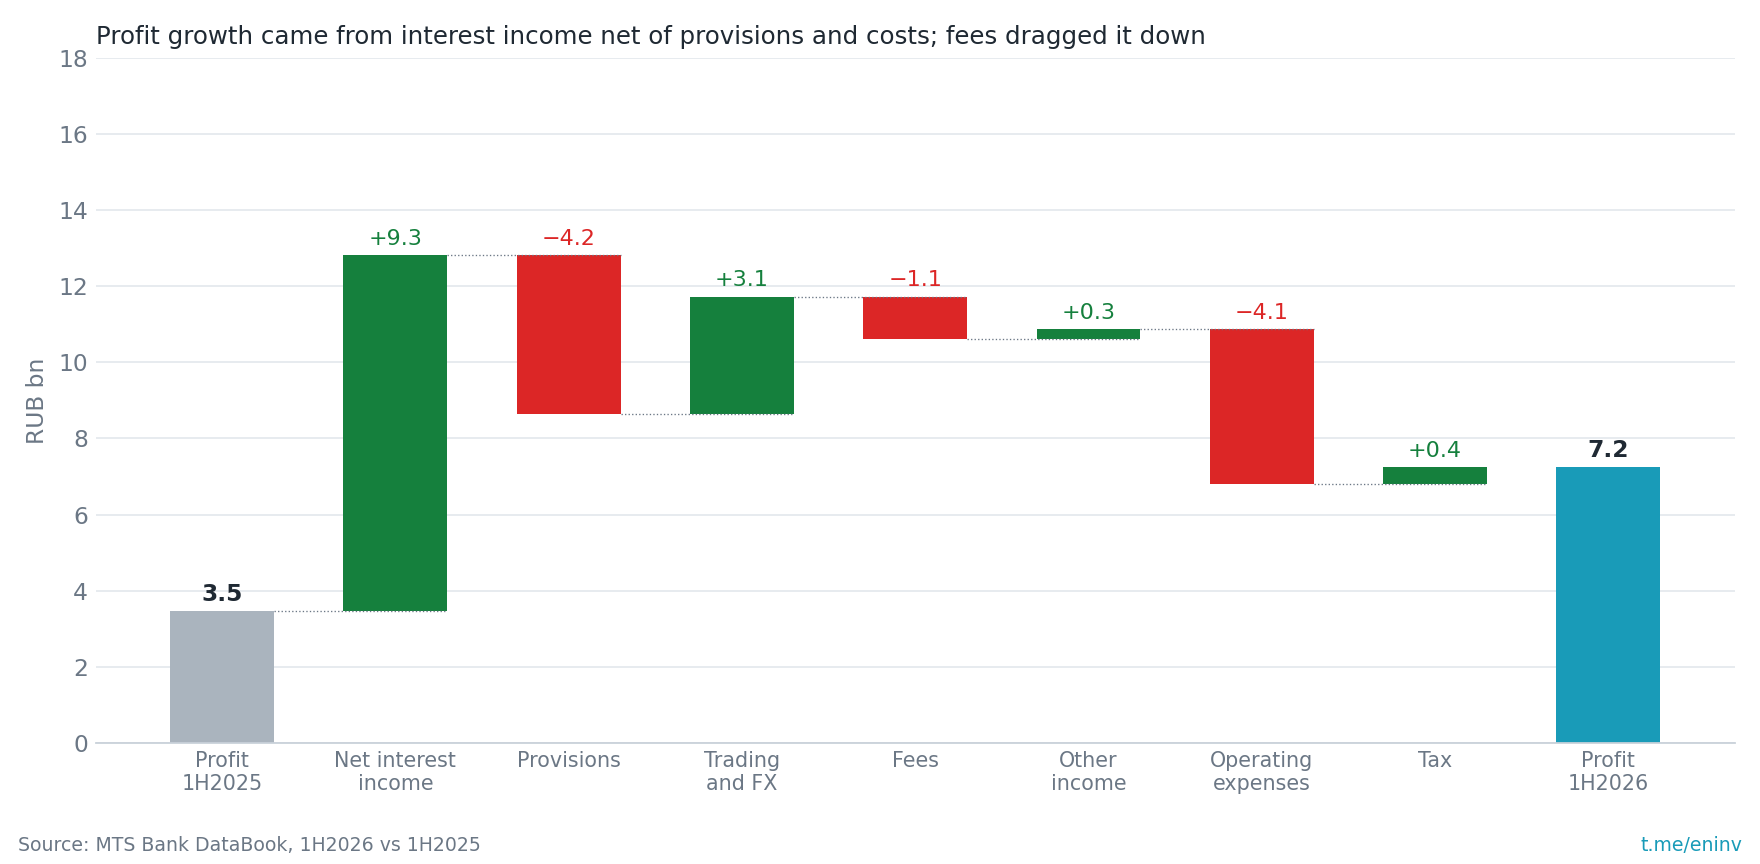
In 1H2026 the bank earned RUB 3.8 bn more than a year earlier. Net interest income rose by 9.3 bn, even though interest on loans brought in 3.7 bn less. Growth came from bonds (+6.5 bn) and from deposits becoming cheaper for the bank (interest on customer funds fell by 4.9 bn). This refers to a RUB 156 bn bond portfolio with OFZs as the underlying asset, which the bank bought from a related party in April 2025 at a yield of about 21-22%.
Of the increase in interest income, 4.2 bn went to provisions and 4.1 bn to operating expenses, of which 3.3 bn to salaries. Trading and FX operations added 3.1 bn, fees subtracted 1.1 bn.
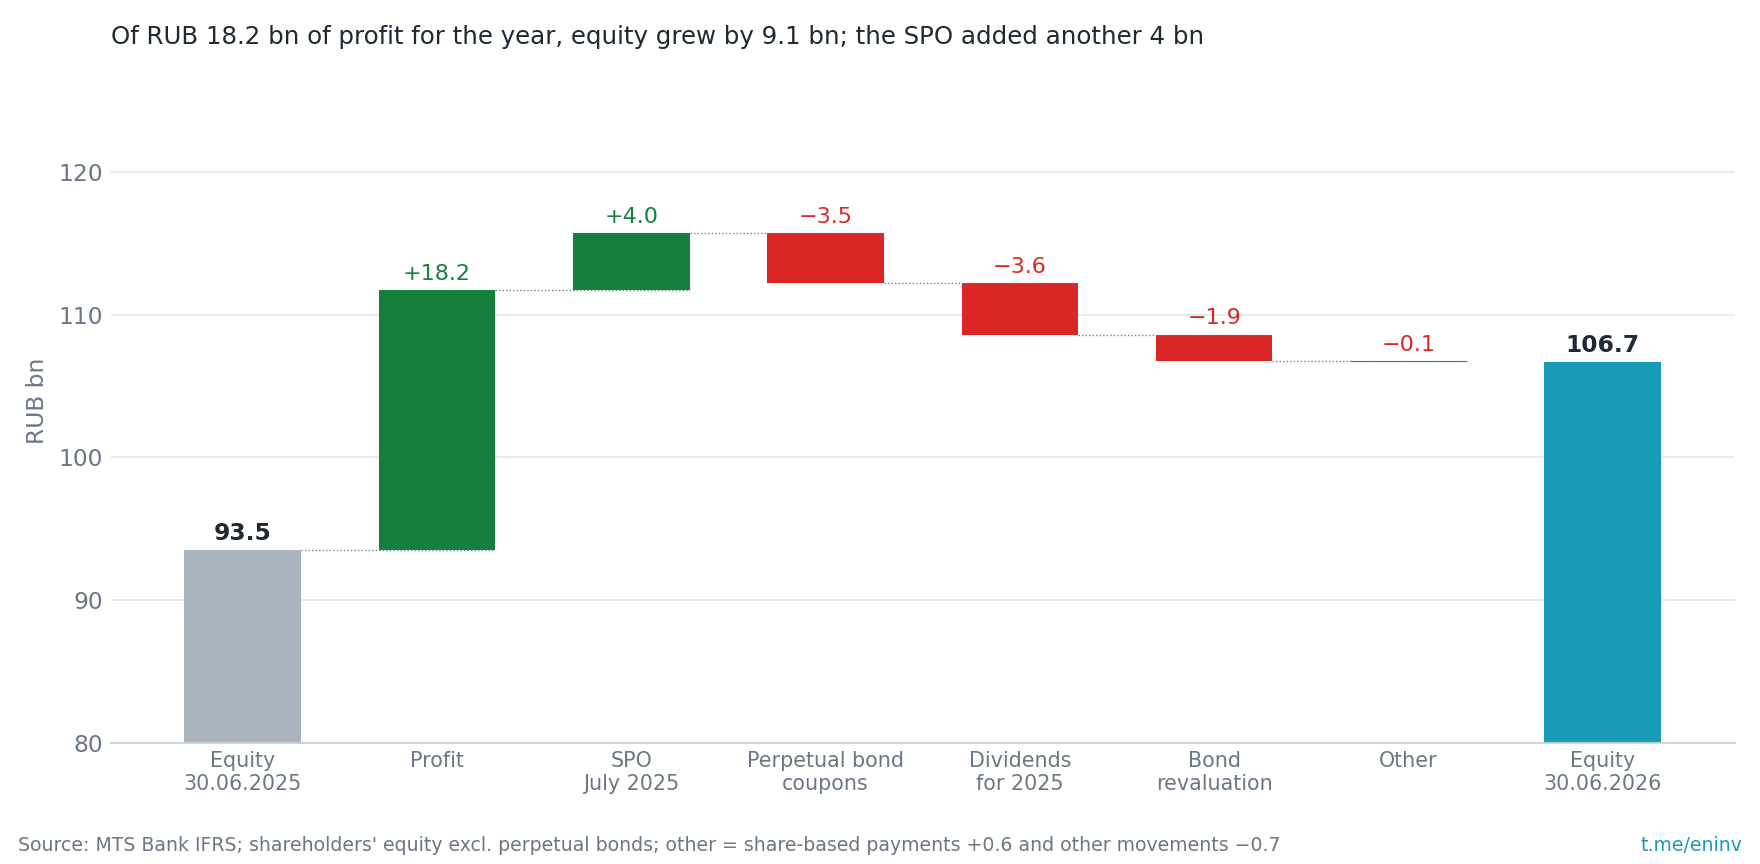
How much of the earnings stayed in the bank can be seen from equity. From 30 June 2025 to 30 June 2026 the bank earned RUB 18.2 bn. Equity excluding perpetual bonds grew by 13.1 bn, but 4 bn of that came from the SPO in July 2025. Perpetual bond coupons took 3.5 bn, dividends for 2025 3.6 bn, and bond revaluation 1.9 bn.
So profit is now growing thanks to bonds bought from the group and falling rates, not thanks to lending. The bonds will keep generating income, while the benefit from cheaper deposits depends on whether the key rate continues to fall.
Capital is sufficient for growth and the current dividend, but the buffer for generous payouts is small
The bank's key ratio, N1.1, shows how much of its own capital stands against risk-weighted assets. As of 1 September 2026 it was 8.8% versus 8.0% a year earlier. The bank cites a minimum including buffers of 6%, so the headroom is 2.8 pp.
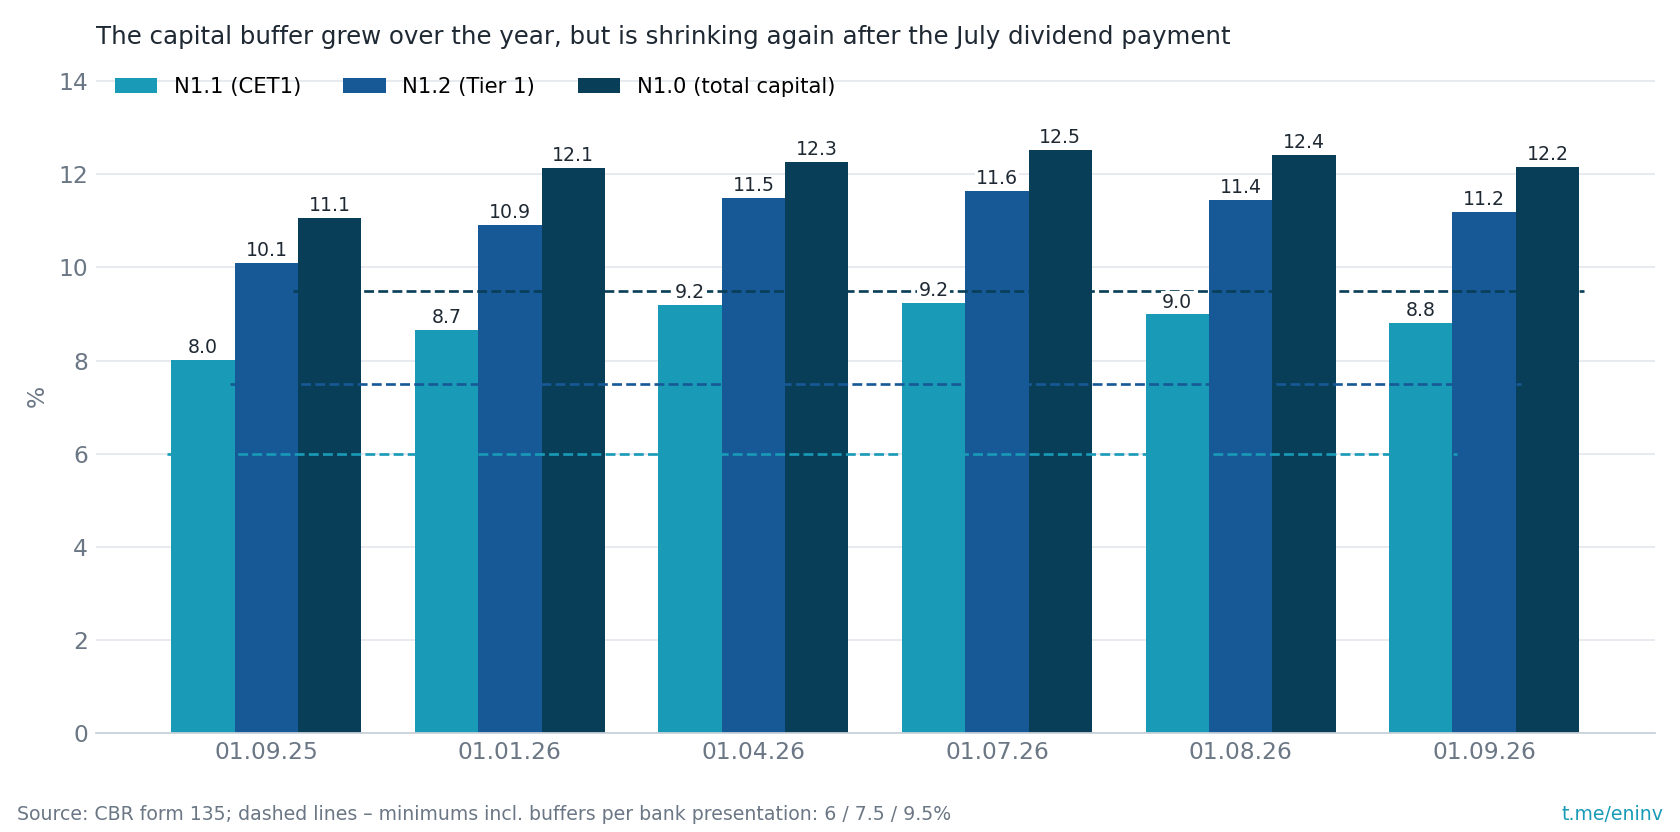
The headroom grew over the year, but in July and August 2026 the ratios declined, N1.1 from 9.24% to 8.81%. This is exactly when the bank was paying dividends and expanding corporate lending. By our estimate, every RUB 3.6 bn of payouts (the annual dividend under the current approach) takes about 0.45 pp off N1.1.
Dividends are already in double digits and may grow for 2026
For 2025 the bank paid RUB 96.12 per share, 10.5% of the current price. Under its dividend policy the bank pays out 25-50% of IFRS profit net of perpetual bond coupons. The presentation describes the 2025 payout as 31.9% of that profit; relative to profit before deducting coupons it is 25%. The bank paid on the same basis for 2024.
How much the bank pays for 2026 depends on ROE. We calculated three scenarios, each with two payout levels: as now (25% of profit before coupons) and at the policy maximum (50% of profit after coupons).
| Scenario | Profit, RUB bn | Current approach: 25% of pre-coupon profit | Policy ceiling: 50% of adjusted profit |
|---|---|---|---|
| Actual for 2025 | 14.4 | RUB 96 (10.5%) | - |
| ROE about 15%: 2Q run-rate holds | 16.4 | RUB 109 (11.9%) | RUB 177 (19.3%) |
| ROE 20%: two quarters of 7.5 bn | 22.2 | RUB 148 (16.2%) | RUB 255 (27.8%) |
| 2028 strategy target: ROE 25%+ | 30 | RUB 200 (21.8%) | RUB 358 (39.1%) |
*Dividend per share and yield at RUB 916 under different ROE. Authors' estimate based on the bank's targets, not a forecast. Perpetual bond coupons about RUB 3.1 bn a year, 37.5 mn shares.*
How realistic each scenario is:
- ROE of about 15% will be achieved if the bank keeps earning as in 2Q, RUB 4.7 bn per quarter. Dividend of RUB 109 (11.9%) under the current approach.
- ROE of 20% requires two record quarters in a row of RUB 7.5 bn each. The best quarter of 2025 delivered 6.0 bn. Dividend of RUB 148 (16.2%) under the current approach. If at that ROE the bank paid out the policy maximum, about RUB 9.6 bn, N1.1 would fall by roughly 1.2 pp.
- ROE of 25% and profit of RUB 30 bn is the bank's strategy target for 2028. That is more than two years away.
For minority shareholders it matters that money from the bank reaches all shareholders through dividends rather than leaving through transactions with the group. For comparison, at parent MTS, under the new policy of 16.09.2026, 30% of capital returns will go through share buybacks, and the repurchased shares stay with the company.
We value the share at RUB 1,000-1,600, with the earnings-based valuation closer to the lower end
At RUB 916 the bank trades at 0.32 of its equity (P/B), with book value per share of RUB 2,842. Profit for the last 12 months is RUB 18.2 bn, i.e. P/E of 1.9. Net of perpetual bond coupons, profit attributable to shareholders is 14.7 bn, P/E 2.3.
| Bank | Net interest income, y/y | Net profit, y/y | ROE 2Q2026 | P/B |
|---|---|---|---|---|
| MTS Bank | +35% | +90% | 17.6%¹ | 0.32 |
| VTB | +122%² | −34% | ~15% | 0.28³ |
| Sovcombank | +69% | 5.1x | 24.5% | 0.50 |
| Bank Saint Petersburg | −7% | −39% | ~10% | 0.54 |
| Sber | +27% | +21% | 24% | 0.74 |
| T-Technologies | +32% | −15% | ~21% | 0.89 |
*Net interest income and profit growth in 2Q2026 year on year, quarterly ROE and price to book. VTB's interest income grew from a very low base. ¹ Bank's methodology; 13.5% net of perpetual bond coupons. ² Low 2Q2025 base. ³ Ordinary shares only.*
Of the two banks trading below 0.35 of equity, only MTS Bank is growing profit; VTB's fell by 34%. Sovcombank is growing faster (ROE of 24.5% in 2Q), but it also trades at 0.5 of equity. Bank Saint Petersburg trades at 0.54 of equity, DOM.RF and Sber at about 0.75, T-Technologies at almost 0.9.
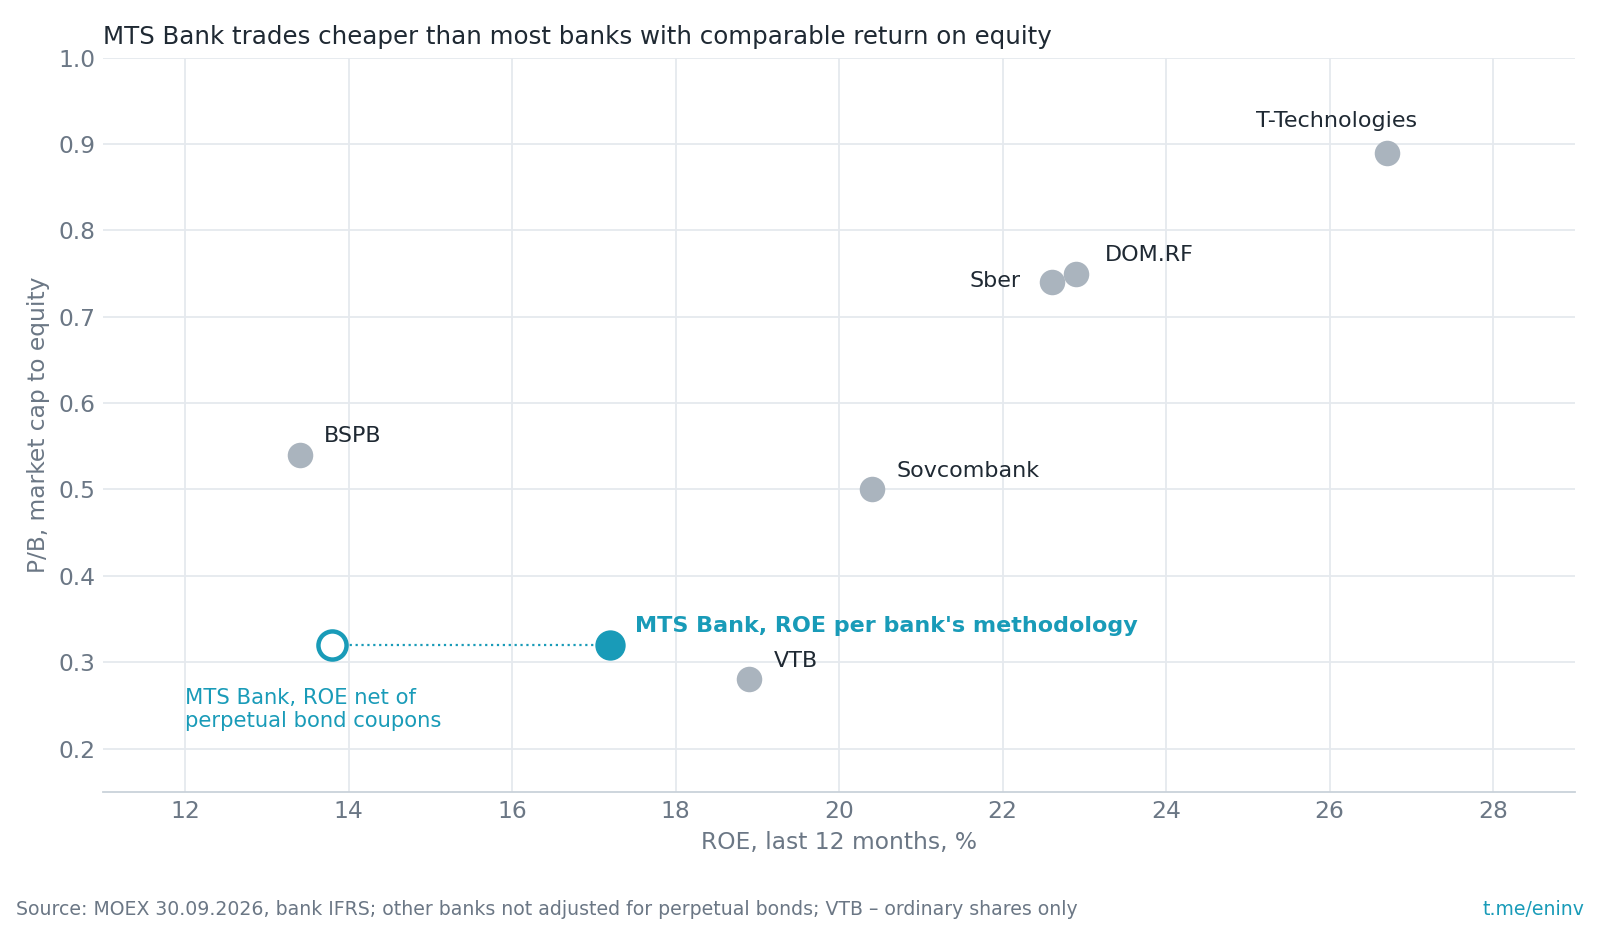
We valued the bank in three ways. This is our valuation, not a target price.
- Based on equity. If the bank earns about 14% on equity after coupons and an investor requires 25% a year (the 14% key rate plus a risk premium), the fair price is about 0.55 of equity, or RUB 1,550-1,600 per share (+69-75%).
- Based on earnings. If the bank earns RUB 14.5-16 bn for 2026, shareholders will be left with 11.4-12.9 bn after coupons, a P/E of 2.7-3.0 on that profit. A typical bank from the table trades at 3.3 times annual profit (median for five banks: Sber 3.3, VTB 1.5, Sovcombank 2.6, Bank Saint Petersburg 4.0, T-Technologies 3.6; IFRS profit for the last four quarters, MOEX prices as of 30.09.2026). At that multiple the share would be worth RUB 1,000-1,130 (+9-23%).
- Based on dividends. Under the current approach the dividend for 2026 will be RUB 97-107. For it to yield the 14% key rate, the share would have to cost RUB 690-760. At the current payout ratio this valuation is below the current price, so payout growth matters most for the share price.
In sum, we value the share at RUB 1,000-1,600, with the earnings-based valuation closer to the lower end. If ROE falls to about 10%, the equity-based valuation would be about RUB 1,140 (+24%) and the earnings-based about RUB 940 (+3%), i.e. still not below the current price.
Analyst consensus provides a cross-check. In the Andromeda terminal only two research houses have a forecast for MTS Bank: profit of RUB 15.9 bn in 2026, 18.6 bn in 2027 and 22.5 bn in 2028, ROE of 12.8%, 14.2% and 15.5%. This consensus has no target price or dividend. In February 2026, before the 1H reports, SberCIB valued the share at RUB 1,800 and expected profit growth of more than 30% in 2026 (from 13.3 bn for 2025). According to the bank, the average target price of eight houses as of 20 May 2026 was RUB 1,739. Our 2026 profit estimate is in line with consensus. ROE of 20% already in 2026 is noticeably more optimistic: analysts expect that level of profit only in 2028.
Corporate governance in brief
MTS owns 85.7% of the bank, with a free float of about 12%. The board of directors has 3 independent directors out of 9. The bank has large transactions with the group: the RUB 156 bn bond portfolio bought from a related party, loans of 16.4 bn to companies under common control, and 54.7 bn of funds of the group and its shareholders in accounts at the bank.
What has to happen for the share to become interesting
First, a good 3Q report. We would consider a quarter good if profit is no lower than in 2Q (RUB 4.7 bn) and ROE is above 17% under the bank's methodology. Year-on-year growth is not guaranteed here: 3Q2025 was the bank's best quarter since at least 2024 (RUB 6.0 bn of profit, ROE of 24.5%).
Every month the bank files Russian-standard (RAS) reports with the CBR (forms 101 and 102), and July and August are already visible in them. Interest income net of interest expense is holding at about RUB 4 bn a month, slightly above 2Q (3.8-3.9 bn) and a year ago (3.5-3.7 bn). Fee income is below last year: about 1.5 bn a month versus 2.0-2.2 bn. Profit for July and August was RUB 2.7 bn versus 4.2 bn a year earlier.
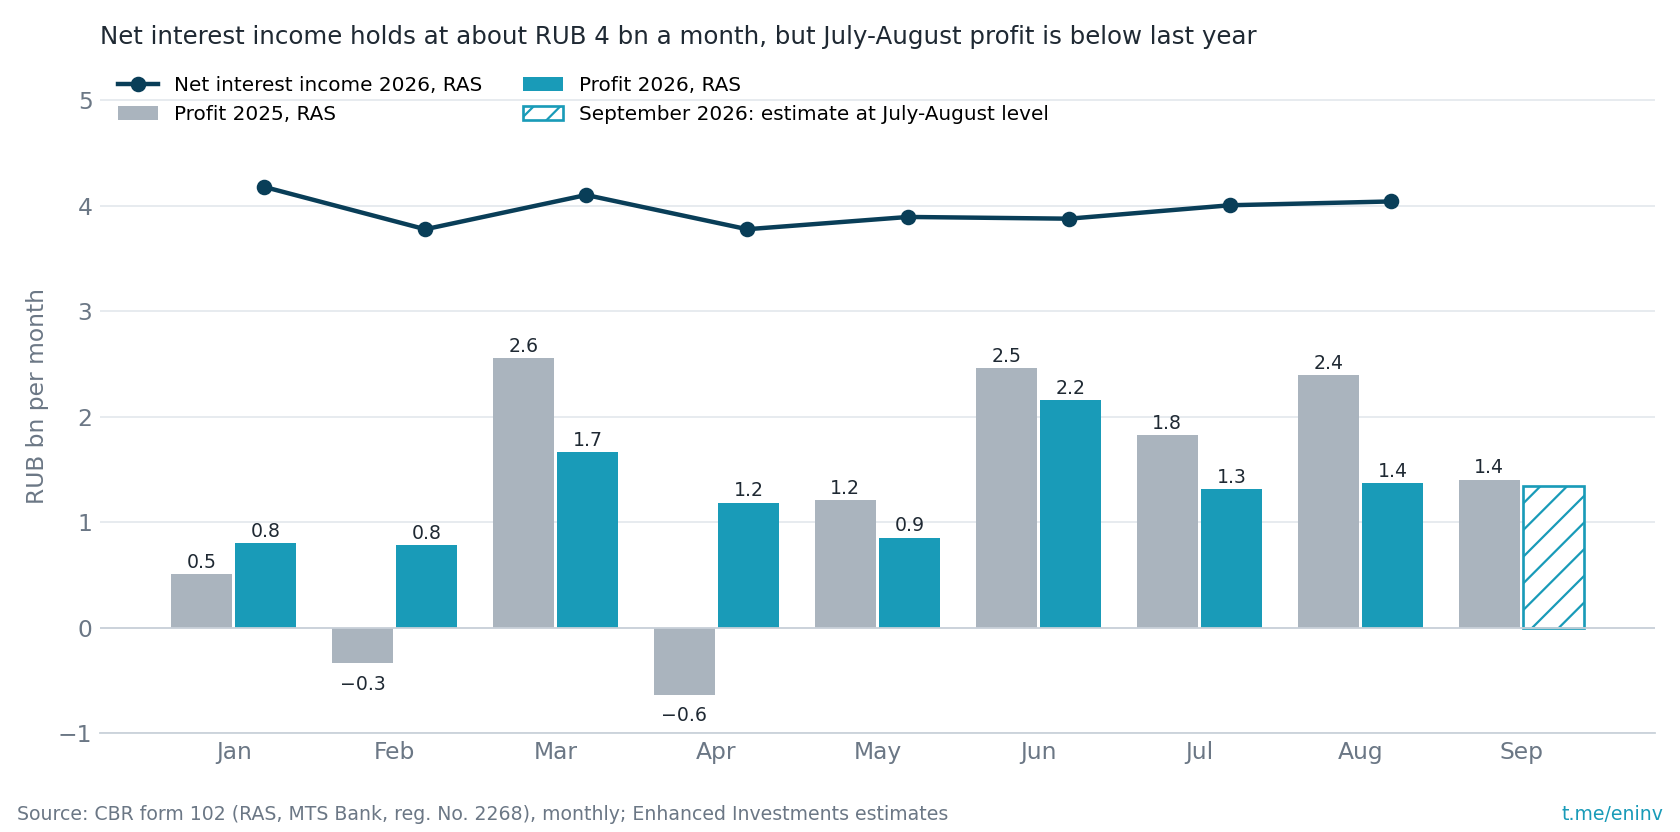
If September is at the July-August level, RAS profit for 3Q will be about RUB 4.0 bn versus 5.6 bn a year ago. IFRS profit differs from RAS: over the last four quarters it ranged from 0.77 to 1.13 times RAS profit. Hence our estimate of 3Q IFRS profit is RUB 3.1-4.5 bn, about 4 bn at the midpoint, with ROE of about 15% under the bank's methodology. That is below the bar for a good quarter and a third below 3Q2025. The 2026 consensus (15.9 bn) implies about 4.3 bn per quarter in 2H, so our estimate is close to analysts' expectations. The CBR will publish the September reports in mid-October, when the estimate can be refined.
Second, further growth in ROE and dividends; the scenarios are calculated above.
Third, the market starts valuing the bank closer to its book value.
All of the bank's figures over time are collected on the MTS Bank card on Frontier.
Open the company's financial profile MBNK →
See also: market overview · valuation map · stock screeners