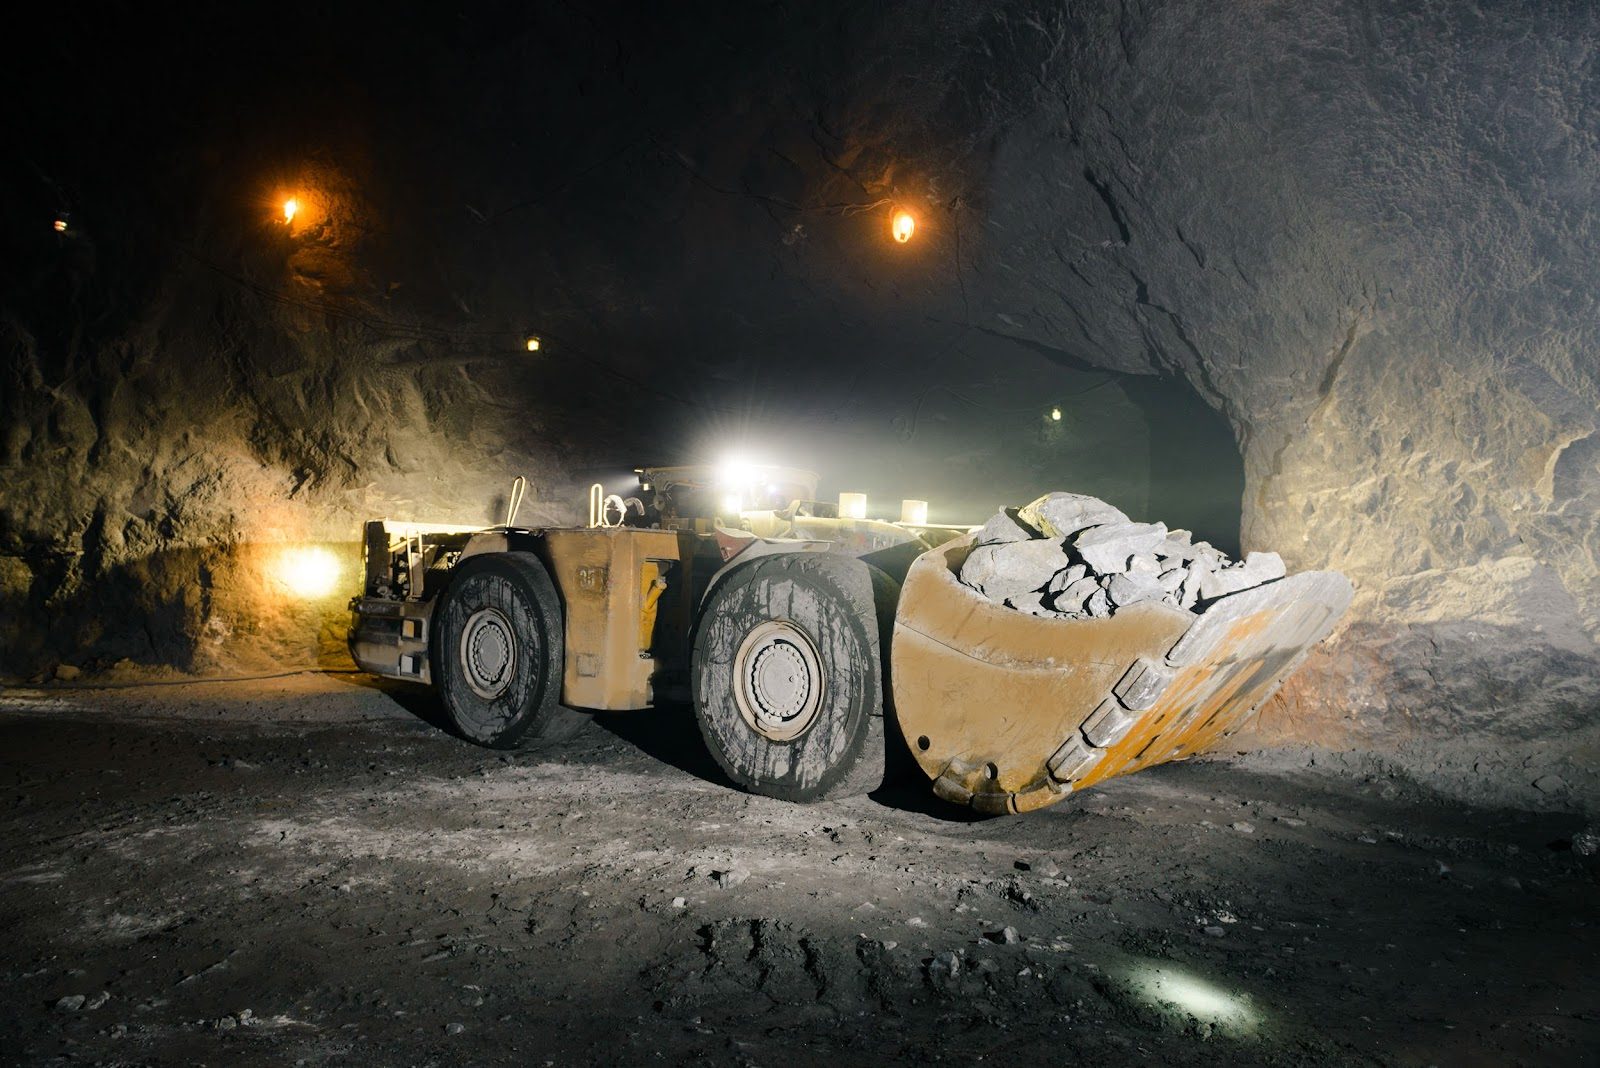
Sector: Gold mining
ALTYNGOLD
Net debt (table and EV/EBITDA): |short-term borrowings| + |long-term borrowings| + |other financial liabilities| when extracted + |non-controlling interest| when extracted − |cash and equivalents|; amounts in millions of the reporting currency.
Shares: connector/market_inputs
Monetary columns are in M USD, one decimal; scale (K/M/B/T) keeps values readable. For the period (default) shows P&L and cash flow for that row’s reporting window: quarterly amounts when the feed uses quarter-duration facts (typical US 10-Q revenue and income), quarterly cash flows after stripping YTD where only cumulative tags exist, and an implied Q4 on 31 Dec FY rows (P&L: FY minus Q1–Q3; operating / investing cash flow: FY 12m minus 9M YTD to 30 Sep when sourced from SEC builder evidence) so they match 10-Q scale. Some issuers still use cumulative YTD minus the prior row in the same calendar year. As reported shows values stored on each row (e.g. full-year on FY). Balance sheet is always as reported. Source JSON may use millions etc.; conversion uses amounts_unit per row.
| Date | Period | Status | RevenueM USD | Operating profitM USD | D&AM USD | EBITDAM USD | Net profitM USD | Operating CFM USD | Capex + M&AM USD | AssetsM USD | EquityM USD | ROE (annualized) | Net debtM USD | Source |
|---|---|---|---|---|---|---|---|---|---|---|---|---|---|---|
| 2025-12-31 | H2 2025 (6M) | OK | 105.4 y/y 85.0% | 48.2 y/y 77.4% | 9.1 y/y 97.2% | 57.3 y/y 80.3% | 35.0 y/y 92.8% | 24.1 | -7.2 | 215.1 y/y 37.4% | 150.1 y/y 82.7% | 47.8% | 18.5 | Report (PDF) |
| 2025-06-30 | H1 2025 (6M) | OK | 70.0 y/y 77.0% | 37.0 y/y 143.5% | 7.1 y/y 59.8% | 44.1 y/y 124.6% | 27.0 y/y 226.8% | 31.6 | -12.6 | 184.9 y/y 23.1% | 109.2 y/y 45.2% | 56.4% | 35538.0 | Report (PDF) |
| 2024-12-31 | H2 2024 (6M) | OK | 57.0 y/y 6.4% | 27.2 y/y 179.1% | 4.6 y/y -1.2% | 31.8 y/y 120.7% | 18.2 y/y 117.4% | 23.2 | -17.4 | 156.6 y/y 7.6% | 82.2 y/y 16.2% | 33.6% | 49.7 | Report (PDF) |
| 2024-06-30 | H1 2024 (6M) | OK | 39.5 y/y 263.0% | 15.2 y/y 146.3% | 4.4 y/y 90.8% | 19.6 y/y 131.1% | 8.3 y/y 176.7% | 6.2 | -4.1 | 150.3 y/y 11.6% | 75.2 y/y 13.3% | 22.6% | 289875.3 | Report (PDF) |
| 2023-12-31 | H2 2023 (6M) | OK | 53.5 y/y — | 9.7 y/y — | 4.7 y/y — | 14.4 y/y — | 8.4 y/y — | 18.2 | -21.0 | 145.5 y/y — | 70.7 y/y — | 16.5% | 53.0 | Report (PDF) |
| 2023-06-30 | H1 2023 (6M) | PARTIAL | 10.9 y/y — | 6.2 y/y — | 2.3 y/y — | 8.5 y/y — | 3.0 y/y — | -3.5 | -19.9 | 134.6 y/y — | 66.4 y/y — | — | 270915.9 | Report (PDF) |
| Short-term debt (incl. ST leases) | 13 |
| Long-term debt (incl. LT leases) | 28 |
| − Cash & equivalents | 23 |
| Net debt | 18 |
|---|
Quarterly values ($ mln)
Year-over-year change
FCF ($ mln)
Net debt / cash ($ mln)
Physical operating metrics — supplementary, not part of the financial statements
Gold
| Year | Reserves, Moz |
|---|---|
| 2019 | 3.80 |
| Year | Production, koz |
|---|---|
| 2025 | 53.85 +44.4% |
| 2024 | 37.30 +12.7% |
| 2023 | 33.10 |
AltynGold plc (LSE:ALTN) Sekisovskoye mine: gold poured 53.85 koz FY2025 (+44% YoY, beat 50koz target; 1Mtpa plant fully ramped) vs 37.3 koz FY2024 / 33.1 koz FY2023. Medium-term target >100 koz/yr via plant expansion to 2-2.5Mtpa + Teren-Sai. JORC P+P reserves 3.80 Moz (E&Y CPR 2019, latest disclosed).
Current 4 035spot vs LTM -5%
Target market cap from conservative EBITDA and the historical EV/EBITDA
Upside: -30.3%
Main driver: Gold -5% vs LTM; revenue ×0.95 vs costs ×1.04; EBITDA 101→73; at 3.0× EV/EBITDA → -30%.
Product prices — moves vs the LTM average
| Commodity | Share | Spot | LTM | 3-yr | vs LTM, $ | 3y vs LTM |
|---|---|---|---|---|---|---|
| Gold (rev) | +100% | 4 034.58 | 4 246.02 | 3 201.08 | -5% | -25% |
How it is calculated — revenue → costs → EBITDA → target market cap
| 1 · Reported baseline (LTM) | |
| LTM revenue | 175 |
| LTM EBITDA | 101 |
| LTM cash costs (revenue − EBITDA) | 74 |
| 2 · Revenue projection | |
| Revenue multiplier — spot | ×0.950 (-5%) |
| = Spot revenue | 167 |
| Revenue multiplier — 3y price | ×0.754 (-25%) |
| = 3-year-price revenue | 132 |
| 3 · Costs projection | |
| Cost multiplier — spot | ×1.040 (+4%) |
| = Spot cash costs | 77 |
| Cost multiplier — 3y price | ×1.040 (+4%) |
| = 3-year-price cash costs | 77 |
| 4 · EBITDA projection (revenue − costs) | |
| = Spot EBITDA | 90 |
| = 3-year-price EBITDA | 55 |
| Conservative EBITDA = min(spot, avg) | 73 |
| 5 · Valuation → target market cap | |
| Historical EV/EBITDA (75th pct) | 3.0x |
| Target EV = EV/EBITDA × conservative EBITDA | 219 |
| Net debt | 18 |
| Target market cap = EV − net debt | 201 |
| Current market cap | 288 |
Upside = target market cap ÷ current − 1 = -30.3%
Model: revenue scales with spot commodity vs its LTM average. Cash costs = baseline cash costs × country PPI ÷ devaluation (baseline cash = revenue − EBITDA); devaluation = spot FX ÷ LTM average FX (KZT per USD). Amounts are in reporting currency (USDm) unless noted. Baseline P&L is the latest full-year row (annual), not a rolling sum of quarters — compare cards to that FY.
| Line item | Value |
|---|---|
| 1 · Reported baseline Figures from financial periods in the table above. | |
| Baseline revenue (latest FY annual) | 175 USDm |
| Baseline EBITDA (latest FY annual) | 101 USDm |
| Baseline cash costs (revenue − EBITDA) | 74 USDm |
| 2 · Commodity & revenue bridge Average gold price (and FX average when enabled) use the same reporting dates as baseline revenue — not a rolling “last 365 days from today”. Window used: 2025-01-01 … 2025-12-31. | |
| Commodity spot price (current) (GC=F) | 4 144.00 USD/oz |
| Commodity LTM average price (GC=F) | 3 447.35 USD/oz |
| → Implied change vs LTM avg (for revenue) | +20.2% |
| → Combined revenue multiplier (commodity × FX) | 1.2021 |
| 3 · Cash cost adjustment Transforms baseline cash costs into projected spot cash costs. | |
| PPI pair (expense inflation) | USDKZT |
| PPI multiplier (×) | 1.17574 |
| Devaluation factor | 0.92 |
| 4 · Spot forward P&L Combine sections 2–3; «=» rows are the published spot headline numbers. | |
| = Projected spot revenue | 211 USDm |
| = Projected spot cash costs | 95 USDm |
| = Spot EBITDA | 116 USDm |
| 5 · Valuation vs spot Uses enterprise value from key metrics (mcap + net debt) and Spot EBITDA from §4. | |
| Enterprise value (current) | 302 USDm |
| EV ÷ Spot EBITDA | 2.6x |
Flow: baseline → commodity/FX revenue bridge → PPI & devaluation on costs → spot P&L → EV vs spot EBITDA. Hover values for formulas.
Projected EV/EBITDA 3.4x · target 75th pct (3y) 11.9x · LTM avg 4.2x
No dividend rows found for this issuer (checked: Yahoo Finance (ex-div)).
Investor reporting (IR): https://altyngold.uk/reports/
Reporting forms detected in loaded periods: ✓ ✓ ✓ (Balance sheet / Profit or loss (P&L) / Cash flows)
Financial results, valuation multiples (P/E, P/B, EV/EBITDA), profitability and dividend yield of Altyn Gold (ALTYNGOLD) — from primary filings.
Altyn Gold develops and operates gold projects in Kazakhstan and Central Asia, with London-listed exposure.