Kazakhstan: why the market is cheap and who reported best
Kazakhstan grows one and a half times as fast as the world economy, yet its stock market trades at half the emerging-market multiple. At the end of September the MSCI Kazakhstan index traded at 7 times trailing earnings, against 14.9 for MSCI Emerging Markets and 25.4 for the US. Its dividend yield was 6.1%, against 1.5% for the world index.
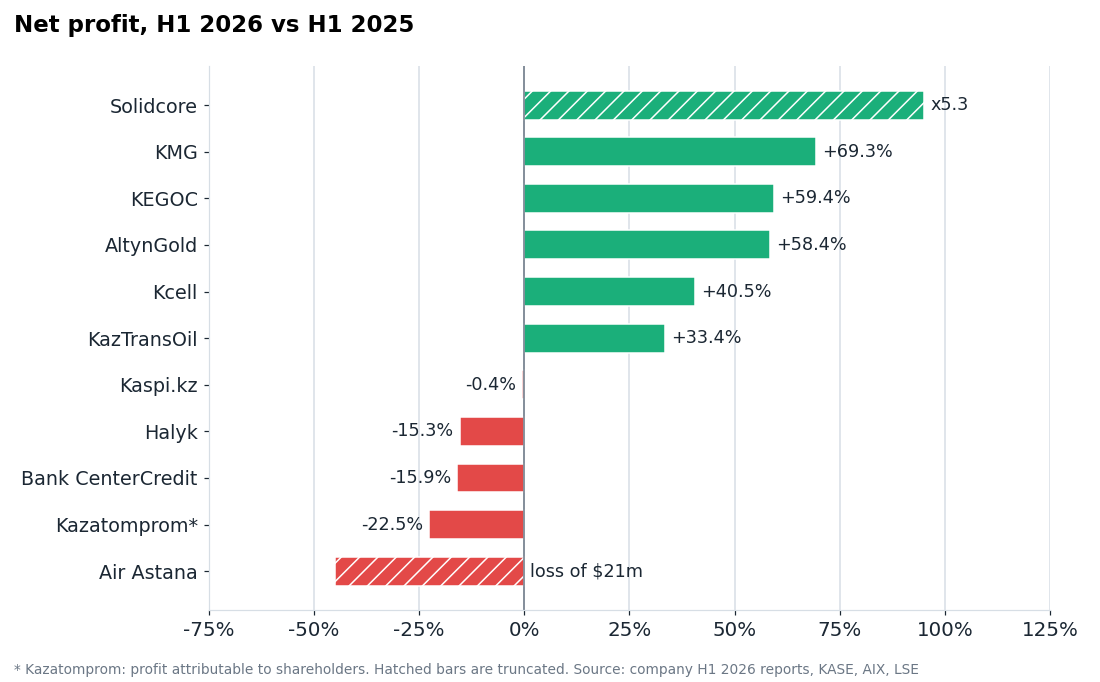
In the first half of 2026 profit grew fastest in gold, oil and the power grid. Solidcore earned 5.3 times more than a year earlier, KazMunayGas 69% more, KEGOC 59% and AltynGold 58%. The banks and Kazatomprom earned less. The cheapest names with growing profit are KEGOC, AltynGold, Solidcore and KazTransOil.
Halyk is a stock we have historically made a lot of money on; AltynGold is in our portfolio today. Halyk's profit grew eightfold from 2016, its dividend from zero to KZT 58 per share. Right now profit is falling and we watch two numbers. AltynGold is the cheapest of the 14 names on reported earnings, but a strong tenge is eating its margin.
The catch is liquidity, the role of the state and dependence on oil. That is why cheapness can last. Details, charts and sources below. Prices as of 30 September 2026.
Disclosure: Enhanced Investments holds positions in Halyk Bank and AltynGold.
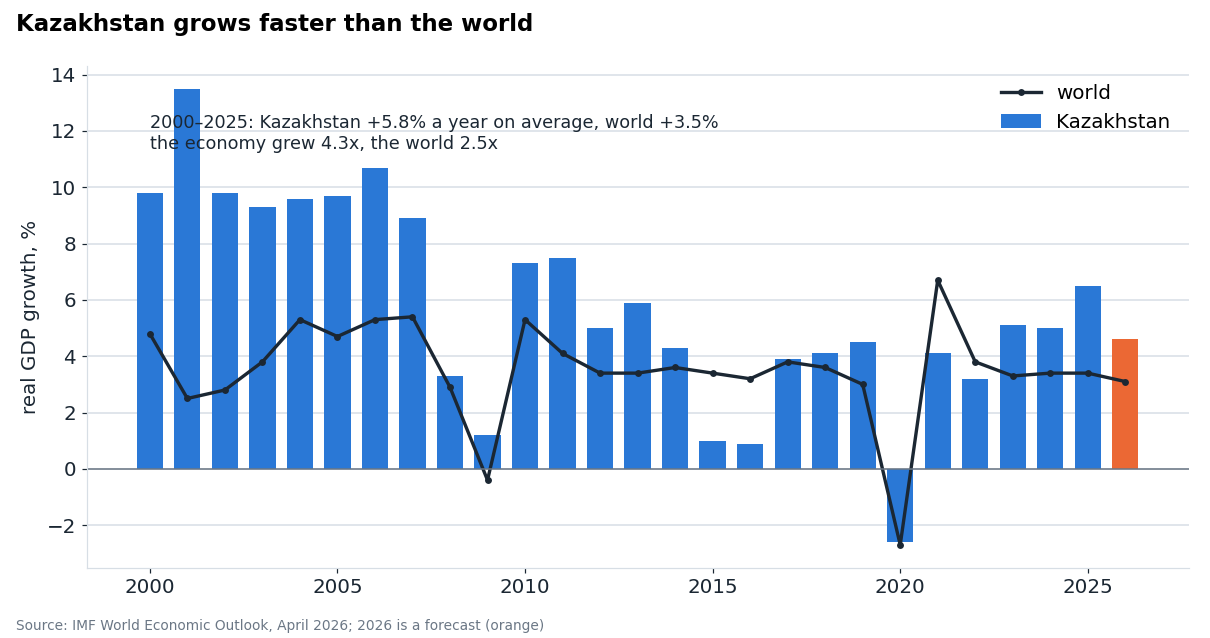
The economy has grown 4.3x since 2000; the world 2.5x
According to the IMF, Kazakhstan's real GDP grew 5.8% a year on average in 2000-2025, against 3.5% for the world, 5.1% for emerging and developing economies and 2.2% for the US. Growth was 6.5% in 2025. For 2026 the IMF expects 4.6%, against 3.1% for the world, 2.3% for the US and 1.1% for Russia.
The population is about 20.5 million, growing about 1% a year, with a median age of 29.7. GDP per capita is about $14,900. In August S&P raised the sovereign rating to BBB, the first BBB since 2016; Fitch also rates it BBB, Moody's Baa1. The National Fund held $68.2bn of foreign-currency assets on 1 September.
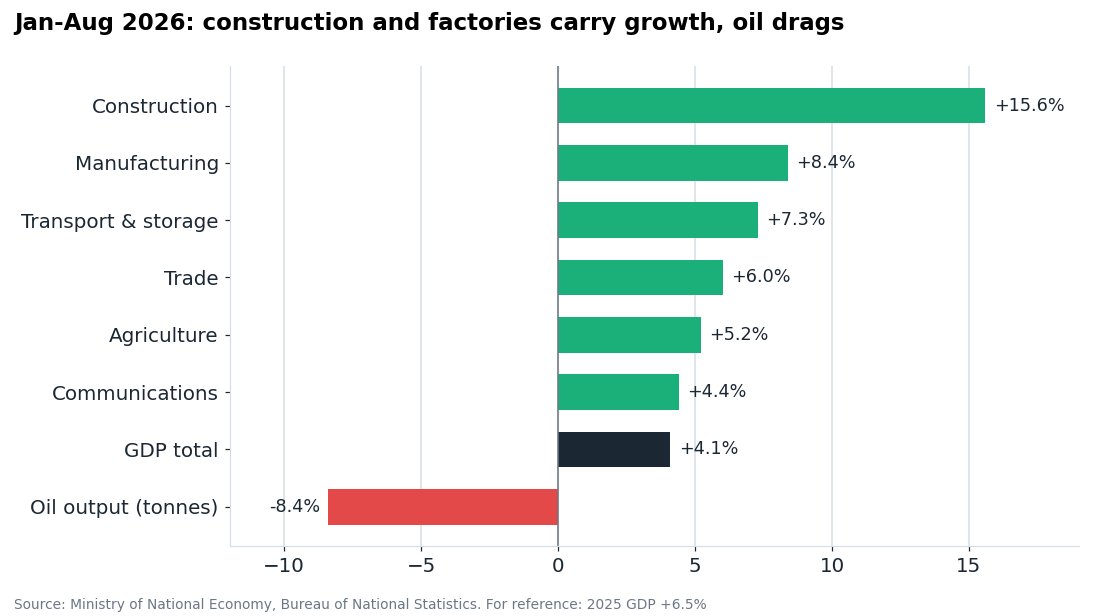
Oil is falling, yet the economy grows 4%, carried by construction and manufacturing
GDP grew 4.1% in January-August. Oil output fell 8.4% in eight months after drone strikes on Caspian Pipeline Consortium infrastructure and a fire at Tengiz; the annual plan was cut from 100.5 to 96 million tonnes. The non-oil economy grows 5.4%: construction +15.6%, manufacturing +8.4%, transport +7.3%, trade +6%.
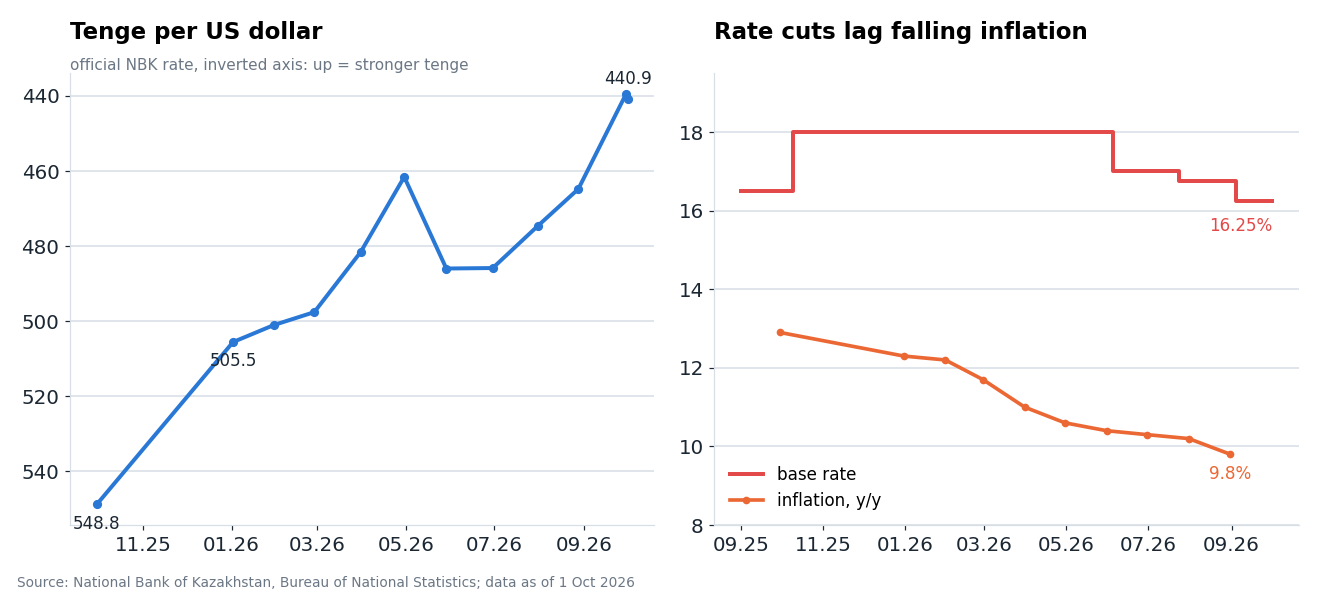
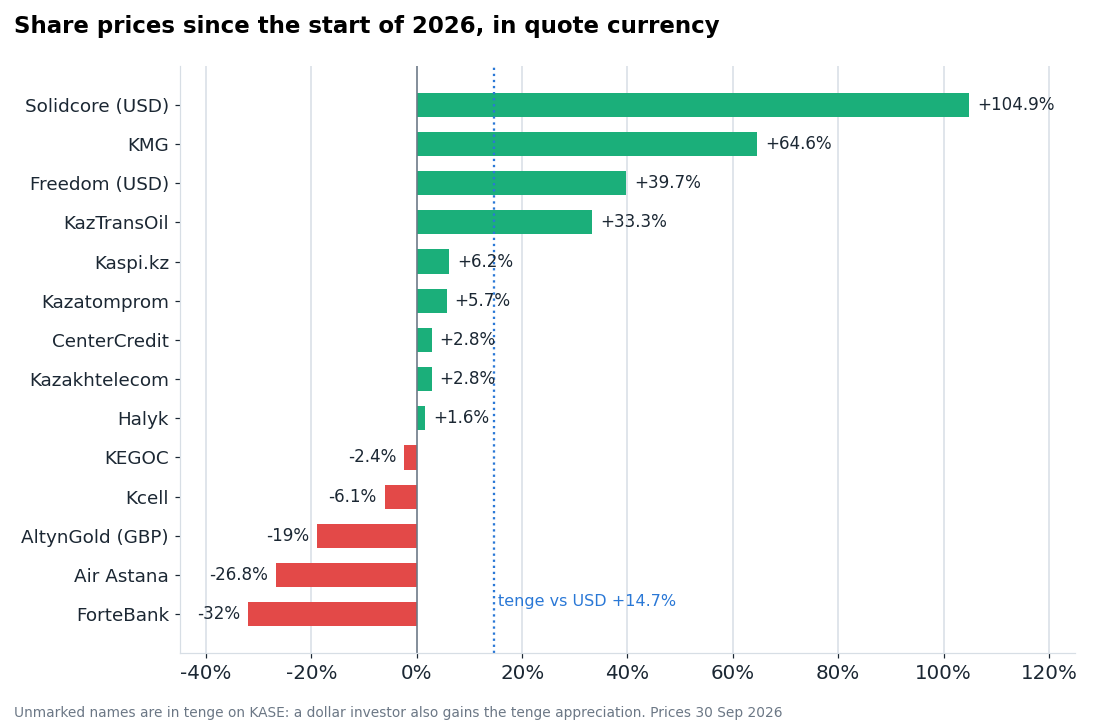
The tenge is up 14.7% this year; the base rate is 16.25% with inflation at 9.8%
The official rate on 1 October was KZT 440.86 per dollar, against 505.53 at the start of the year. Expensive oil and National Fund FX sales hold it up, and since September the National Bank has added sales to mirror its gold operations. The base rate is 16.25%, next decision on 23 October; the National Bank has warned that room for further cuts is limited.
For a dollar investor the strong tenge added 14.7% to the return on tenge stocks this year. It cuts both ways: if oil gets cheaper or the National Fund sells less currency, the tenge can weaken.
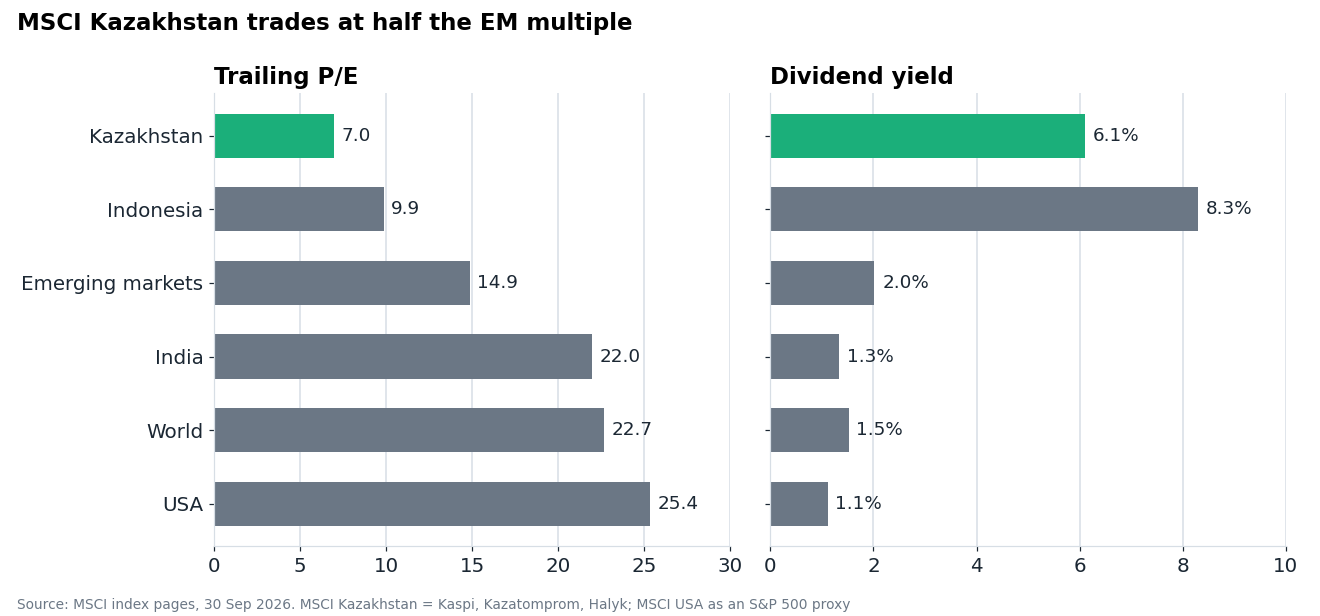
The market trades at 7x earnings – half the emerging-market multiple
MSCI index pages as of 30 September: MSCI Kazakhstan – P/E 7.0, dividend yield 6.1%; MSCI Indonesia – 9.9; MSCI Emerging Markets – 14.9; MSCI India – 22.0; MSCI World – 22.7; MSCI USA – 25.4. MSCI Kazakhstan holds three stocks: Kaspi.kz (43%), Kazatomprom (31%) and Halyk (26%). Across all 12 profitable listed companies, the median P/E on annualised first-half earnings is about 8.
The reasons are clear: a small, illiquid market, state control of the largest companies, oil dependence, and global funds keeping Kazakhstan on the periphery. That is exactly why you can buy growing businesses here with double-digit dividend yields.
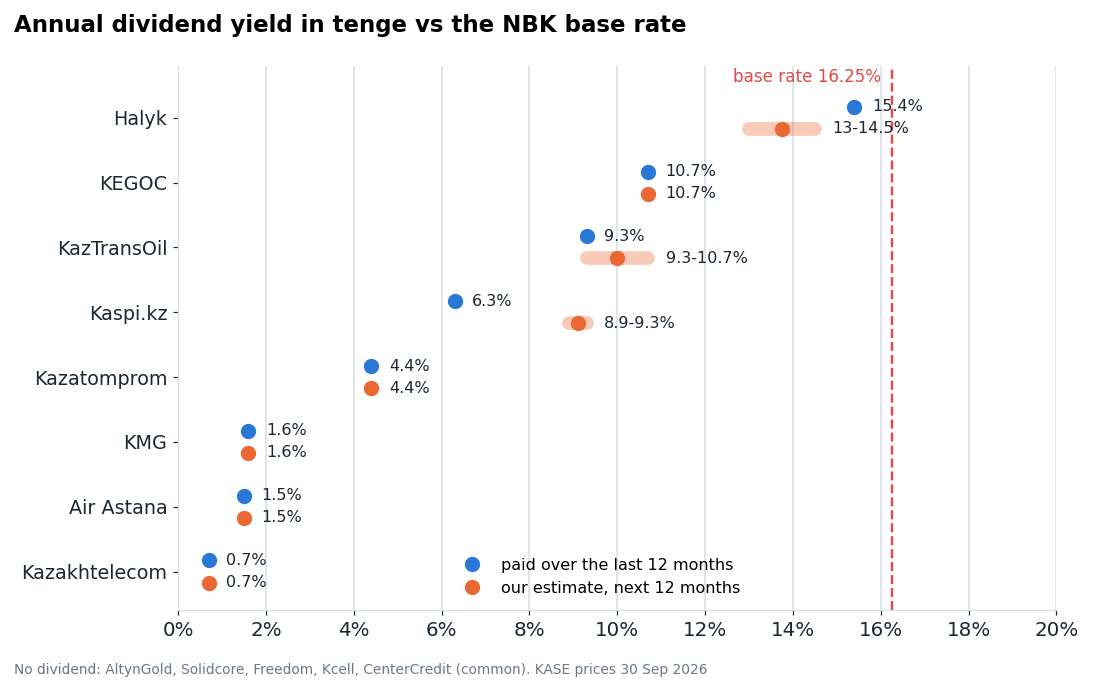
Dividends: Halyk 15.4%, KEGOC 10.7%, KazTransOil 9.3%
Only an annual yield is comparable with the base rate. For 2025 Halyk paid KZT 30.10 in May and another 28.09 in September, 58.19 in total, or 15.4% of the price. KEGOC pays twice a year; the board proposed KZT 81.25 for the first half of 2026, about 10.7% annualised. KazTransOil paid KZT 118 for 2025 (9.3%). Kaspi.kz is paying quarterly again; at KZT 1,000 a quarter the next 12 months come to about 9%.
First half: gold, oil and the grid grow; banks and uranium earned less
- Solidcore (formerly Polymetal): revenue $972m vs $325m, net profit $453m vs $85m, output +71%. Net cash $648m.
- KazMunayGas: net profit KZT 904bn vs 534bn on Brent at $92 vs $72 and KZT 441bn of dividends from Tengizchevroil. Net debt rose from 375 to 983bn.
- KEGOC: revenue +31%, cost of sales +16%, net profit KZT 54.6bn (+59%). Operating profit was held back by a one-off KZT 11.5bn grid revaluation. Debt rose by a third to KZT 215bn.
- Kcell: profit +40.5%, but free cash flow was KZT -37.6bn, cash fell to 2.1bn from 32bn in December, and the report now carries a going-concern section.
- KazTransOil: profit +33%, but operating profit only +6.7%; the rest came from deposit interest.
- Kaspi.kz: revenue +23%, profit KZT 511bn, flat year on year, held back by expensive deposits and Turkey's Hepsiburada.
- Halyk: profit KZT 447.6bn (-15%), ROE down from 33.6% to 24.8%.
- Bank CenterCredit: profit KZT 123bn (-16%); bank profit tax rose to 25% from 2026.
- Kazatomprom: profit to shareholders KZT 157bn vs 202bn (-23%), cost per pound +37%.
- Air Astana: revenue +16%, but a $21m loss vs an $11m profit.
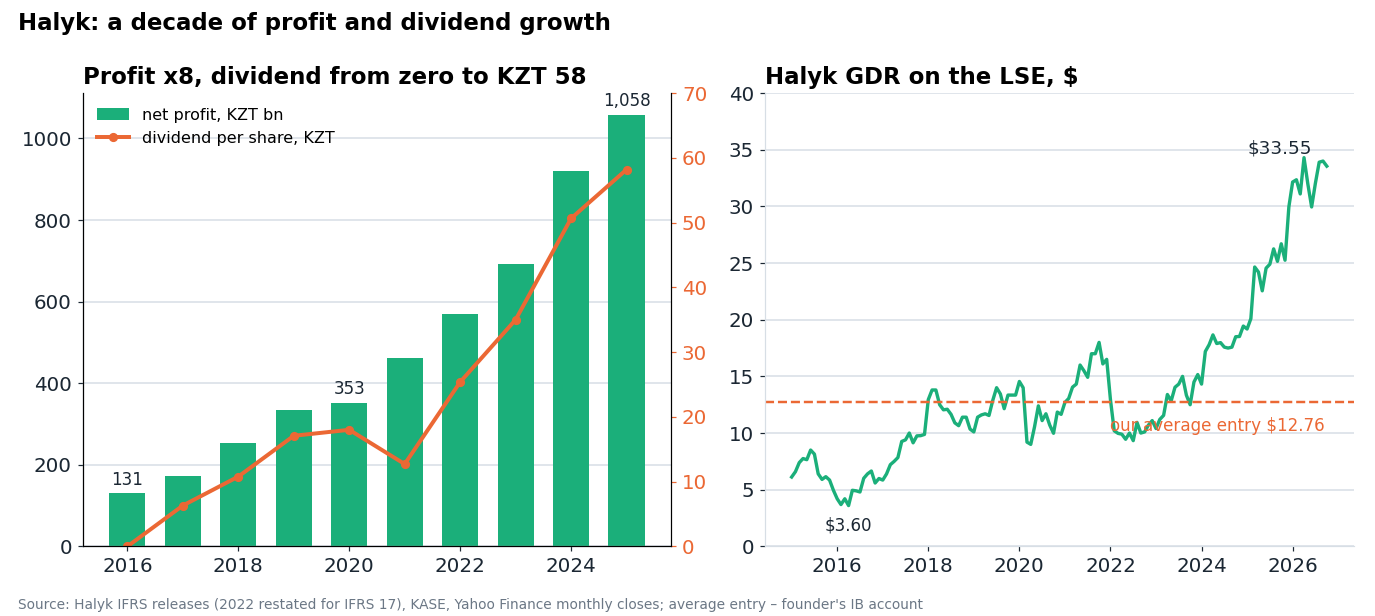
Halyk: profit up 8x in nine years – a stock we have made a lot of money on
Halyk is Kazakhstan's largest bank. From 2016 to 2025 its IFRS net profit grew from KZT 131bn to KZT 1,058bn, and its dividend from zero to KZT 58.19 per share. Its London-listed GDR cost $3.60 in April 2016 and $33.55 on 2 October 2026. Over the last 12 months the bank paid about $5 per GDR in dividends.
Our average entry price is $12.76 per GDR – a 2.6x gain, and last year's dividends alone were almost 40% of our entry price.
Today the picture is more mixed. First-half profit fell 15%, and ROE dropped from 33.6% to 24.8%. The bank names the reasons: higher mandatory reserves, tighter consumer-lending rules, more expensive deposits; loan-loss provisions rose 69%. Monthly National Bank data show profit down 24% in July but only 3% in August (KZT 76bn vs 79bn), and the stage-3 loan share edged down from 8.3% to 8.1%.
We watch two numbers: monthly profit and the problem-loan share. As long as they don't deteriorate, a bank at 4.6x earnings with a 13-15% yield stays cheap.
AltynGold: the cheapest of the 14, but a strong tenge eats the margin
AltynGold mines gold in East Kazakhstan; its shares trade in London. It is in our portfolio. The half-year report came out on 29 September.
- Revenue $115.2m (+65%), adjusted EBITDA $68.5m (+55%), net profit $42.7m (+58%).
- 24.6k oz sold (+9%) at an average $4,615/oz vs $3,071 a year earlier.
- All-in sustaining cost rose to $1,995/oz from $1,530 for 2025: costs are in tenge, revenue in dollars.
- Net debt $19.3m, 0.15x annual EBITDA. 2026 guidance 52-55k oz; the Teren-Sai mining licence is expected in Q4.
- No dividend yet; the board has said it will revisit the question.
On annualised first-half earnings the P/E is about 4.3 and EV/EBITDA about 2.8 – the lowest of the 14 companies. Yet the shares are down 19% this year in pounds. At today's gold price (about $4,160) and exchange rate (KZT 441/$), assuming about 80% of costs in tenge, annual EBITDA would be about $105m vs $126m over the last 12 months, and EV/EBITDA closer to 3.7. Our platform model, which also assumes gold reverting to its three-year average, shows no upside after the report. What could re-rate it: output growth, the Teren-Sai licence and the start of dividends.
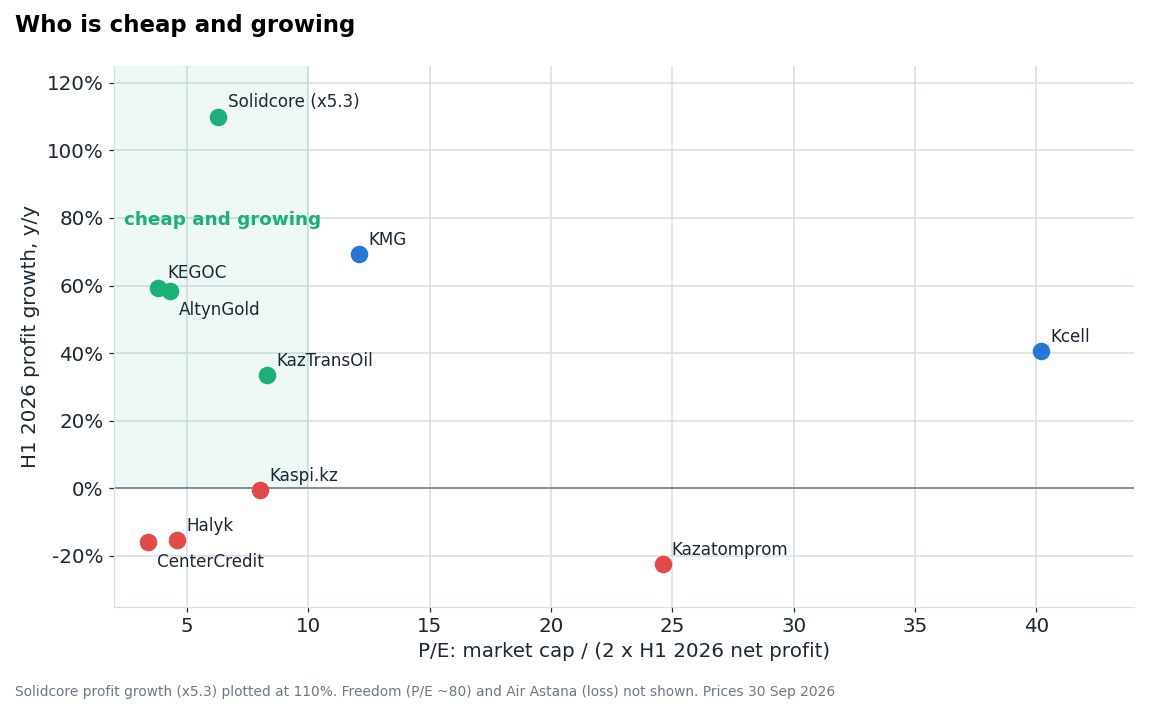
Cheap and growing: KEGOC, AltynGold, Solidcore, KazTransOil
P/E on the chart is market cap over twice first-half profit – rough for seasonal businesses, but fine for comparison. KEGOC trades at about 3.8x with profit up 59%, but the state sets its tariff. Solidcore is at 6.3x with profit up 5.3x, but the shares have doubled this year. KazTransOil is at about 8x, with growth driven by deposit interest. Expensive: Kazatomprom (about 25x), KazMunayGas (12x after a 65% rally), Kcell (about 40x), Kazakhtelecom (about 37x).
The catch: liquidity, the state and oil
- The market is small and illiquid; many KASE stocks trade only every few days. A large position cannot be sold quickly.
- The state controls the largest companies (KazMunayGas, Kazatomprom, KEGOC, KazTransOil, Air Astana) through Samruk-Kazyna. Dividends and tariffs depend on its decisions.
- The economy and budget are tied to oil; the tenge is tied to oil and National Fund FX sales. An oil slump would hit both profits and the currency.
- The market is far from global investors, so cheapness can last – a re-rating is not guaranteed.
Bottom line
Kazakhstan offers a growing economy, companies at under 10x earnings and dividends of up to 15%. For value plus growth, KEGOC, AltynGold and Solidcore stand out. For income, Halyk, if its profit stabilises. KazMunayGas and Kazatomprom look expensive after their rally; Kcell's debt is rising and its cash is running out.
Company cards with financials, multiples and dividend history are on the Enhanced Investments Frontier platform.
Disclosure: Enhanced Investments holds positions in Halyk Bank and AltynGold.
See also: market overview · valuation map · stock screeners