The gas pause: US gas producers and the widest arbitrage in energy (EXE, GPOR, RRC, CNX)
NATGAS →While oil spiked 31% in a month on the Hormuz crisis (Brent ~$101) and European gas jumped to ~EUR 60/MWh, US natural gas went the other way: Henry Hub - the benchmark price at the US pipeline hub in Louisiana - sits near $2.9-3.2/MMBtu, and the producers' shares have gone nowhere. This review checks whether that gap is an opportunity: the macro setup, our screening model, and a hard look at four names - Expand Energy, Gulfport, Range Resources and CNX - through primary filings: hedge books, breakevens, debt and buybacks.
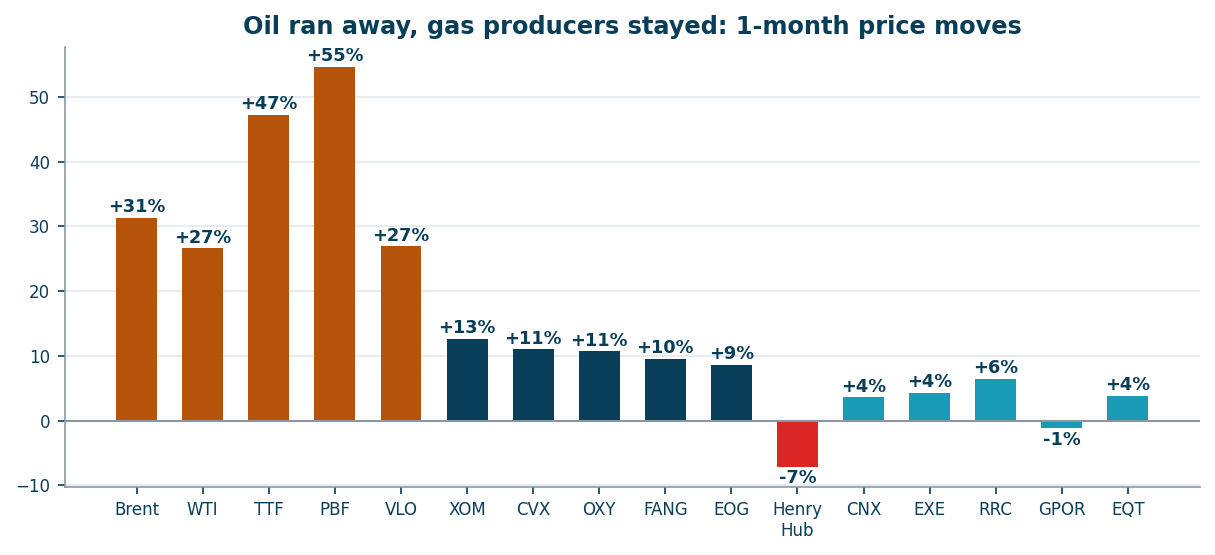
Why not the oil producers: the move is largely priced in
The obvious question is why not simply buy oil names - Exxon, EOG, Occidental, Diamondback. Because their repricing has largely happened: the stocks followed crude up, and on a normalized oil price they are now expensive. Our model values producers on the lower of spot and the 3-year average - for oil that means ~$75-80, not $101 - and on that basis the US oil E&Ps screen deeply negative: OXY -16%, EOG and Chevron around -42%, Exxon -44%, ConocoPhillips -64%, Diamondback -82%. Buying them today means paying for spike-level oil as if it were permanent, while the spike itself is geopolitical and reverses on any Hormuz de-escalation. If your scenario is a prolonged blockade and $100+ oil for quarters, oil producers will deliver earnings upgrades - but that is a bet on geopolitics, not on a mispricing. The gas leg offers the opposite asymmetry: spot near the floor and structural demand still ahead.
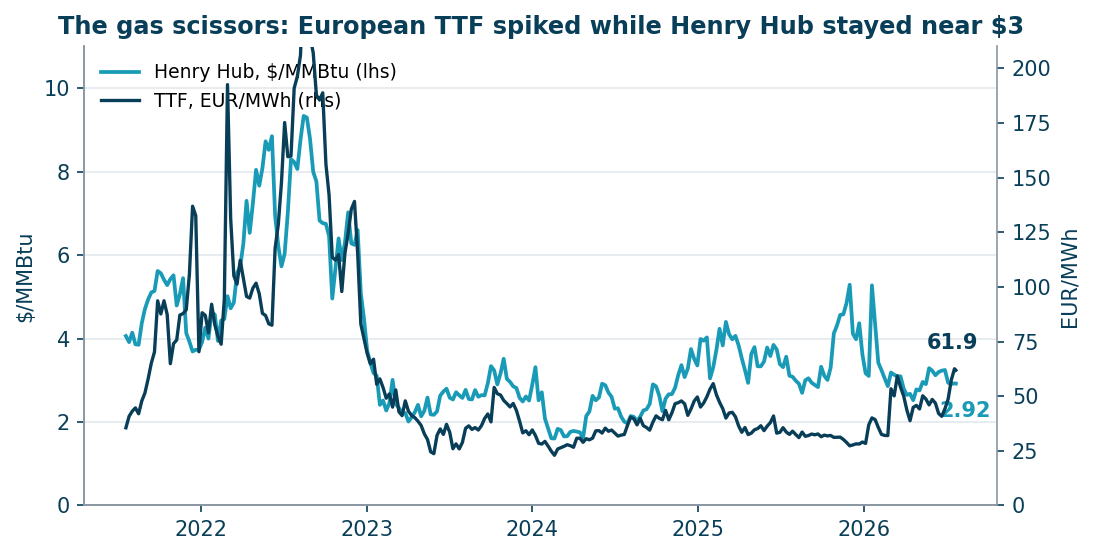
Two prices for the same molecule: the widest arbitrage in energy
The same unit of energy costs ~$2.9-3.2 in the US and ~$20 equivalent in Europe (TTF is the European gas benchmark). The gross spread of ~$17/MMBtu dwarfs the full cost of liquefying and shipping US gas (~$4-5), so every LNG plant on the Gulf Coast runs at maximum: March 2026 set an export record, and terminals consume ~17.9 billion cubic feet of gas a day (Bcf/d) - about 15% of all US production. The constraint is liquefaction capacity, not economics - and that capacity is in the middle of its biggest expansion wave ever.
Why Henry Hub is cheap - the honest part
US gas is cheap for real reasons. Production is at an all-time record (~111 Bcf/d of dry gas in June, +3.4% y/y). Storage is 6% above the 5-year average. And oil at $100 makes it worse: Permian oil wells produce associated gas as a by-product regardless of gas prices (~28 Bcf/d and growing). The most sobering fact: back in January the US Energy Information Administration forecast $4.60 gas for 2027; by July it had cut that forecast to $3.49 - supply keeps absorbing the demand growth. Anyone buying gas producers must respect this: the bear case is not hypothetical, it is the current trajectory.
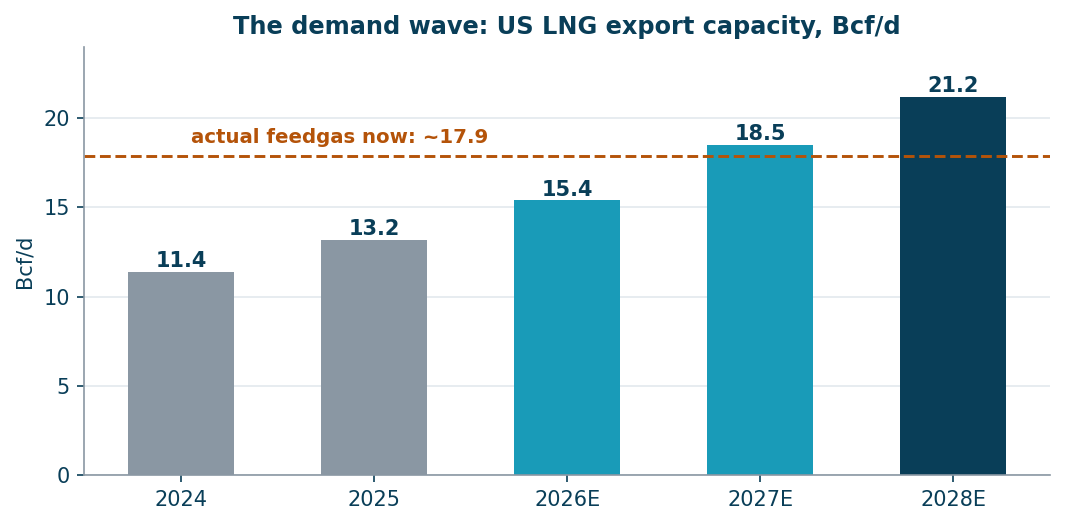
What changes in 2026-2028: the LNG wave plus data centers
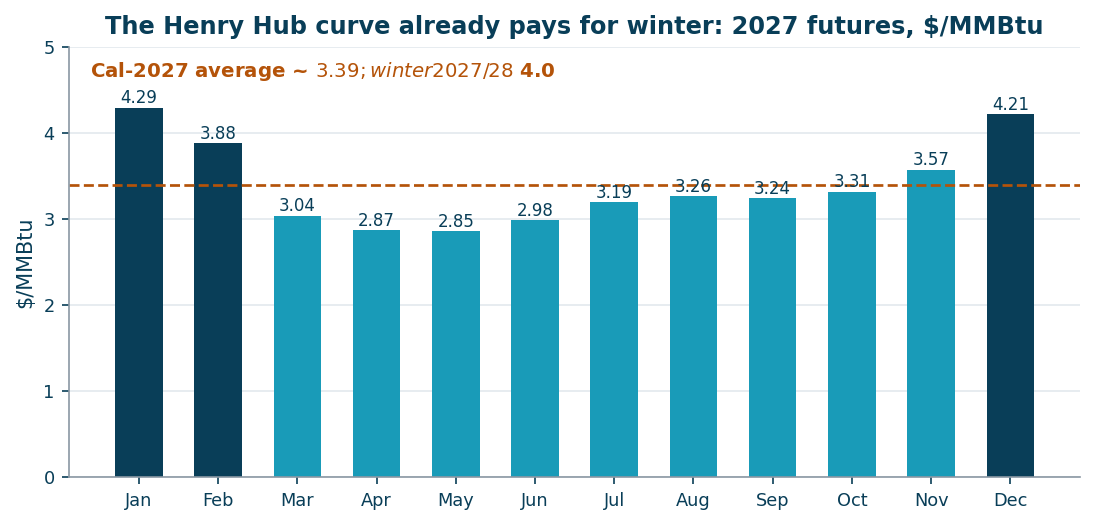
US LNG export capacity grows from 15.4 Bcf/d to ~21.2 Bcf/d by 2028 - a wave of ~6 Bcf/d of new structural demand. It is not a forecast, it is concrete: Plaquemines runs at full rates, Corpus Christi Stage 3 is commissioning, Golden Pass (delayed two years) shipped its first cargo in April 2026 and adds two more trains through 2027, Port Arthur and Rio Grande follow in 2027. On top of that, AI data centers: independent estimates (S&P Global, East Daley) see +3-6 Bcf/d of gas demand for power by 2030, and the deals are already signed - the 4.5 GW Homer City campus in Pennsylvania, the largest gas-fired plant in the US, is contracted to burn Appalachian gas from 2027. The futures curve already prices the shift partially: calendar-2027 averages $3.39 with winter months above $4.20.
Our screen - and why hedges pick your scenario
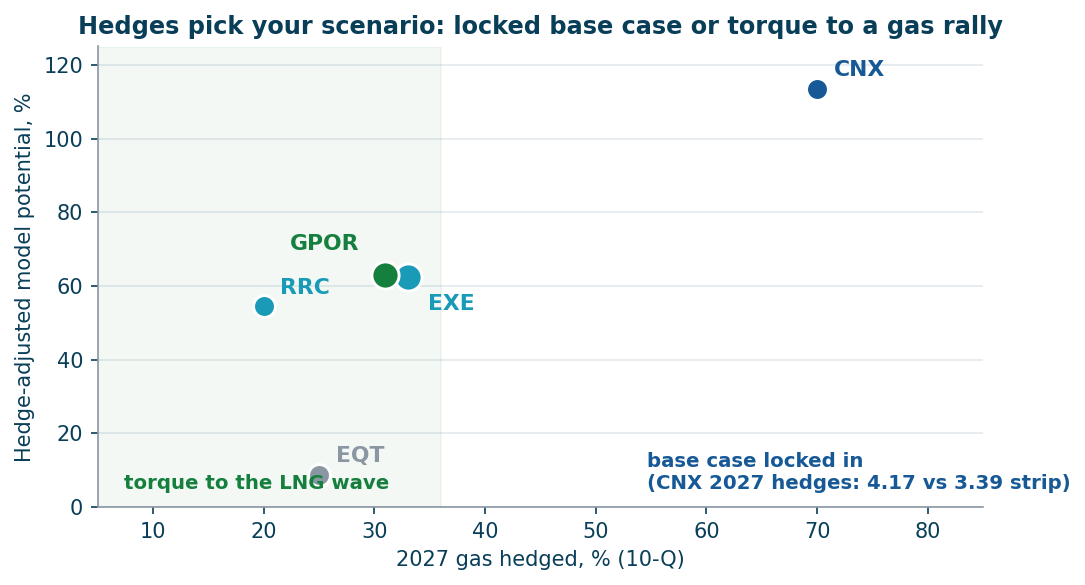
Our spot-potential model (recomputed nightly; conservative price basis = the lower of spot and the 3-year average, EV/EBITDA capped) ranks the gas producers as the biggest untapped upside pocket in coverage. Hedges are valued explicitly: a hedge is a contract fixing the sale price of future production, so hedged volumes will not realize the scenario price - the model prices each disclosed hedge book (10-Q volumes and strikes) against its scenario price and books the difference as an adjustment to net debt, a quasi-debt when hedges sit below the scenario price and an asset when above. On that hedge-adjusted basis: CNX +114%, Gulfport +63%, Expand +62%, Range +55%. At the conservative scenario price (~$3) the hedge books are mild assets for everyone - CNX's 2027 swaps at $4.17 alone are worth ~$0.5bn against it. But the same math flips in a rally: at $4.50 gas the hedged volumes become the quasi-debt, and that is where the names differ. CNX has 81% of 2026 and roughly 70% of 2027 sold - its base case is locked in, its rally participation is structurally muted until 2028. Gulfport (~30% hedged for 2027) and Range (~20%) keep the torque; Expand sits in between.
Pick #1 - Expand Energy (EXE): the scale leader with a Buy consensus
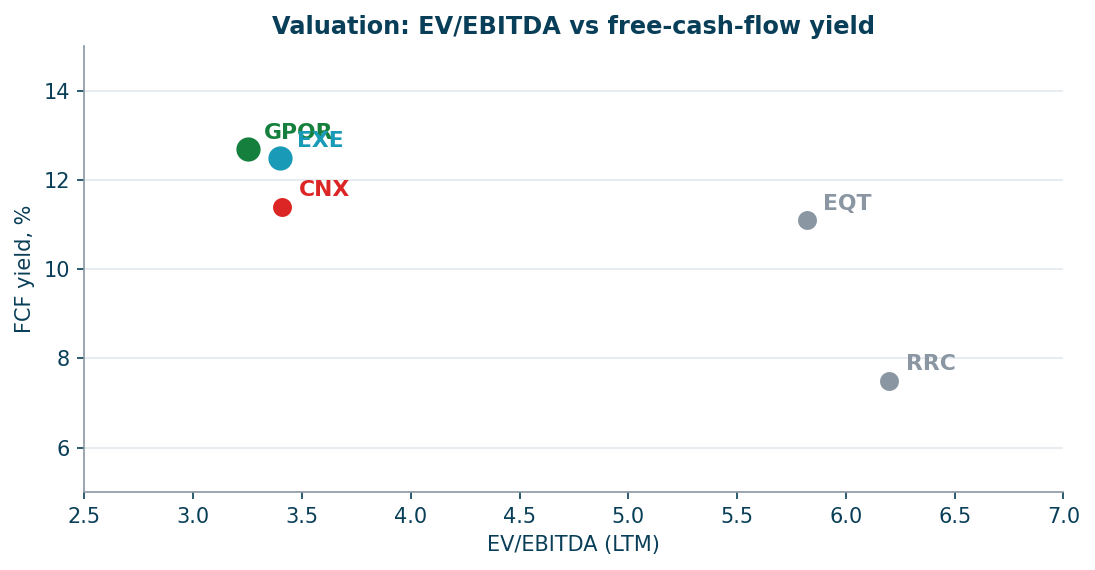
Expand - the Chesapeake+Southwestern merger - is the largest gas producer in the US (~7.5 Bcfe/d, 93% gas) across Appalachia and Haynesville, the basin closest to the LNG plants. Q1 2026: record free cash flow $1.7bn, net debt cut to $2.8bn (~0.5x EBITDA - debt basically solved), merger synergies running at ~$600mn/yr. Valuation: ~3.4x EV/EBITDA, ~12.5% FCF yield, plus a $2.30/yr base dividend (~2.5%). LNG optionality is real: anchor shipper (with an equity stake) on the new NG3 pipeline into the LNG corridor and a 20-year offtake deal with Delfin. Hedges: 66% of 2026 (collars capped at $4.75), roughly a third of 2027 - balanced, not neutered. Street consensus: Buy, average target ~$126-132 (+34-43%). The cleanest single name for the thesis.
Pick #2 - Gulfport (GPOR): the torque and the buyback machine
Gulfport is a ~1 Bcfe/d Utica/Marcellus producer that deliberately keeps 2027 hedges at the bottom of its policy range (~30%) - management is explicitly positioned for stronger gas. Leverage is 0.9x, well-level breakevens below $2.50, ~15 years of inventory. The capital-return math is striking: all free cash flow goes to buybacks - a record $173mn repurchased in Q1 2026 alone against a $2.9bn market cap; roughly 30% of the share base has been retired since 2022. At 3.25x EV/EBITDA and a 12.7% FCF yield, every year of flat gas shrinks the denominator by ~10%. Consensus: Moderate Buy, average target ~$230 (+23%). The risks are structural: only ~18mn shares outstanding, a thin float, and post-bankruptcy holder Silver Point (14.1%) selling down in blocks - expect volatility around those sales.
Pick #3 - CNX: the highest hedge-adjusted potential, for the opposite scenario
After the hedge adjustment CNX is the screen leader at +114% - and that deserves a straight answer on why it is not pick #1. The potential is computed at the conservative scenario price (~$3): at that price CNX's $4.17 hedges are a ~$0.5bn asset, its guided ~$525mn of FCF is locked in regardless of what gas does, and the buyback keeps shrinking the base (37% of shares retired since 2020). What CNX does not offer is participation in the LNG wave before 2028 - 70-81% of production is already sold. So the roles split cleanly: EXE and GPOR monetize the bull case, CNX monetizes the base-and-bear case. A barbell of GPOR plus CNX covers both ends; we size the wave leg larger only because the wave is the thesis of this piece. CNX-specific risks to respect: leverage of 1.8x versus 0.5-0.9x at peers, ~12mn shares of convertible dilution in 2026, and ~$70mn of guided FCF rides on 45Z clean-fuel tax credits still awaiting a final Treasury rule.
The bench: Range and EQT
Range Resources is arguably the best asset (30+ years of core Marcellus inventory, ~$2.00 breakeven - the lowest, 30% liquids sold at an export premium) and the least hedged for 2027 (~20%) - but the market knows: 6.2x EV/EBITDA and a Hold consensus make it a quality-at-a-price story, plus a quarter of its gas contracts with LNG exporters reprices into the 2026-27 wave. EQT (we hold it) is the quality consensus pick with the data-center contracts (1.5 Bcf/d signed) - and the most expensive of the five; we are not adding at 5.8x EV/EBITDA.
The Q2 prints landing this week: weak headlines, watch something else
Should you expect strong Q2 reports? Headline-wise, no - and two of the five have already proven it. EQT and Range both reported on July 21. EQT was operationally strong: volumes above the top of guidance, full-year production guide raised by 90 Bcfe with capex cut by $25mn, a record 29,000-foot lateral. Range printed record production and an EPS beat - but realized prices fell from $4.84/mcfe in the spike-quarter Q1 to $3.53, net income declined y/y, and the stock fell on the report. That is the template for Expand (July 28) and CNX (July 30): solid operations, sequentially weaker prices. For the thesis this is fine - expectations are low and the stocks have not moved, so a soft print is already in the price (Range just demonstrated it). What actually matters in these reports: whether 2027 hedge books get extended (that would cut the torque this idea is built on), Expand's buyback ramp now that its debt target is done, production guides into the LNG wave, and CNX's clarity on its 45Z tax credits. One honest irony to note: EQT's guidance raise is itself part of the bear case - operational outperformance is exactly how record supply keeps outrunning demand.
Base case (the current curve, ~$3.4-3.5 through 2027): all four generate high single-digit to low double-digit FCF yields; buybacks convert flat gas into ~10-15%/yr per-share compounding. Bull case (the LNG wave outruns supply, $4.25-4.50 average in 2027): EBITDA of the low-hedged names grows 30-40%+ at multiples of 3-3.5x - this is where the hedge-adjusted potentials of +55-63% for GPOR/EXE/RRC get realized; Expand alone guides to ~$3.85bn annual FCF at $4.00 gas (17% yield). Bear case (supply keeps winning, $2.70-3.00): breakevens of $2.00-2.60 keep everyone FCF-positive, CNX outearns peers on its $4.17 hedges, GPOR/RRC keep shrinking share counts at depressed prices. The main risks: Permian associated gas at $100 oil (price-insensitive supply), LNG project slippage (Golden Pass was two years late), a warm winter on top of +6% storage, and the sector's own capital discipline breaking if prices do rally.
How to buy
All five are liquid US listings (NYSE/NASDAQ), available at any international broker including Interactive Brokers at standard commissions; options are liquid for EXE and EQT. No withholding complexities beyond the standard 15-30% US dividend tax - and for GPOR and CNX there is no dividend at all, returns come via buybacks.
Prepared by Enhanced Investments from company filings (10-Q/10-K, Q1-Q2 2026 releases: Expand Energy, Gulfport, Range Resources, CNX, EQT), EIA data (STEO July 2026, storage and production reports), CME futures and exchange data; July 2026. Not individual investment advice.